. 2021 Nov 2;12(11):987.
doi: 10.3390/insects12110987.

CSI Pollen: Diversity of Honey Bee Collected Pollen Studied by Citizen Scientists

Affiliations

CSI Pollen: Diversity of Honey Bee Collected Pollen Studied by Citizen Scientists

Robert Brodschneider et al. Insects. .

Abstract

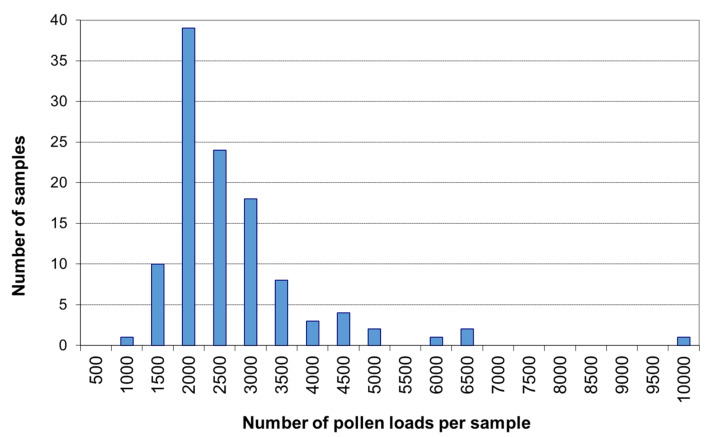
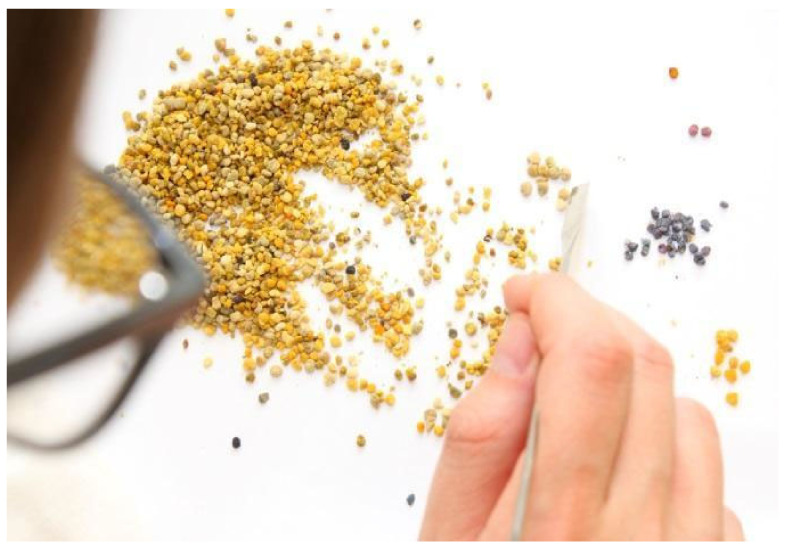
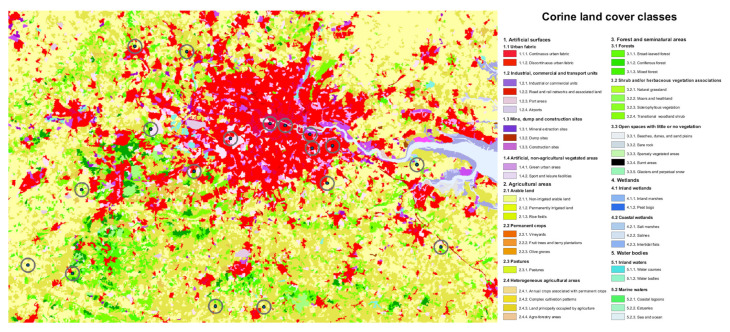
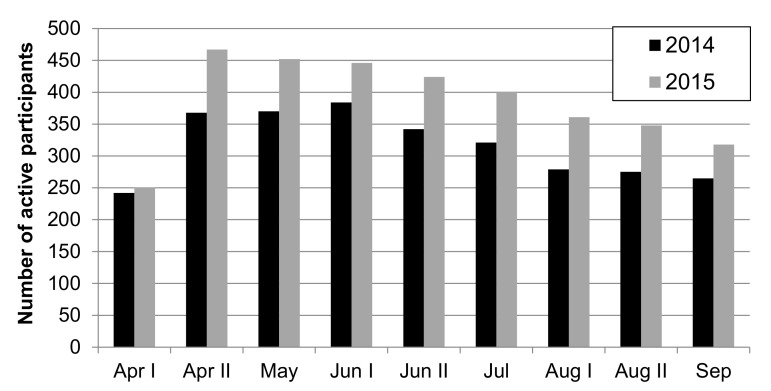
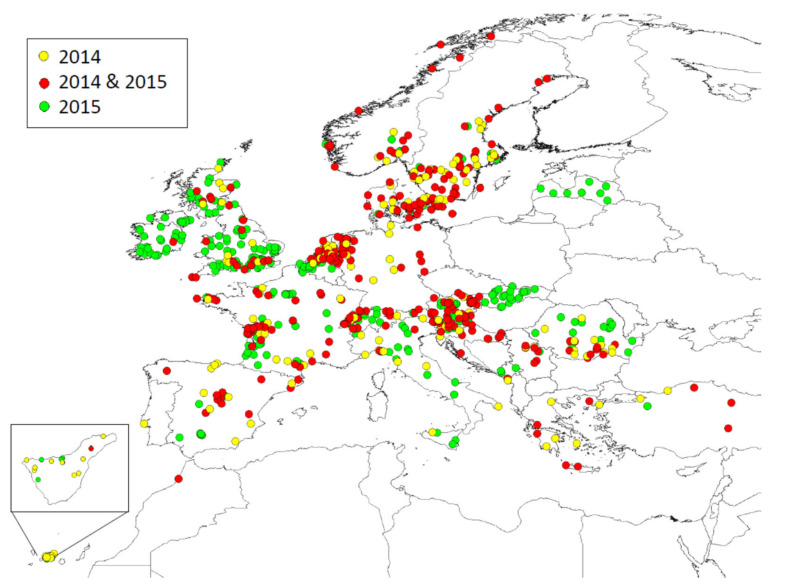
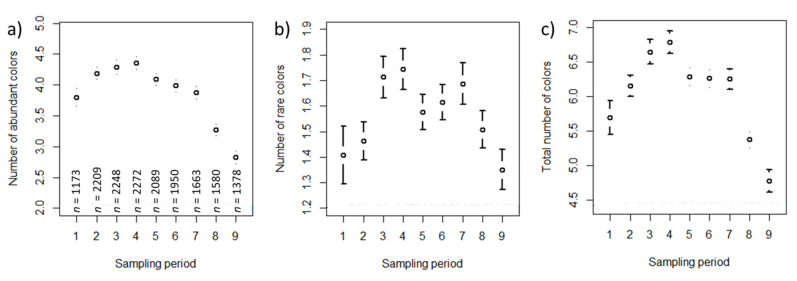
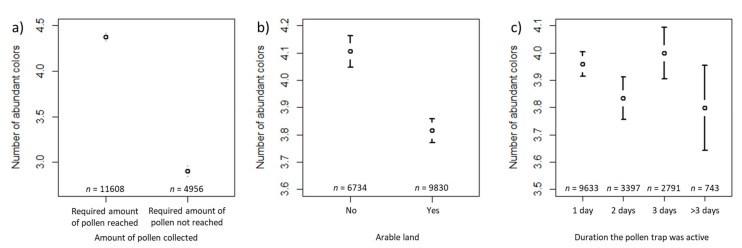
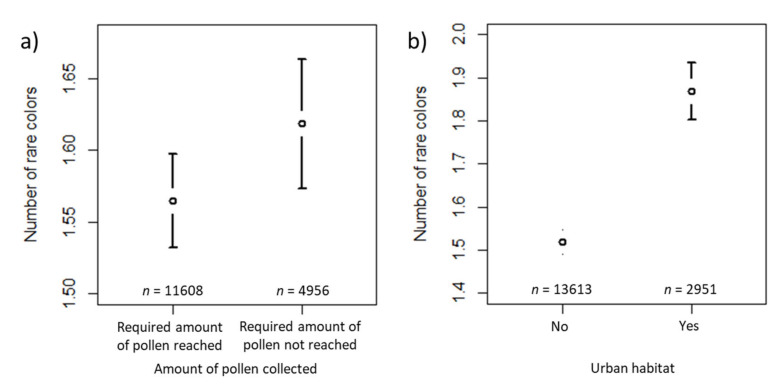
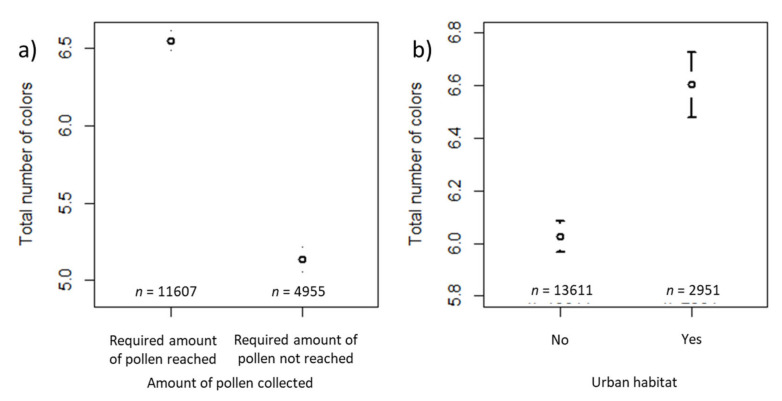
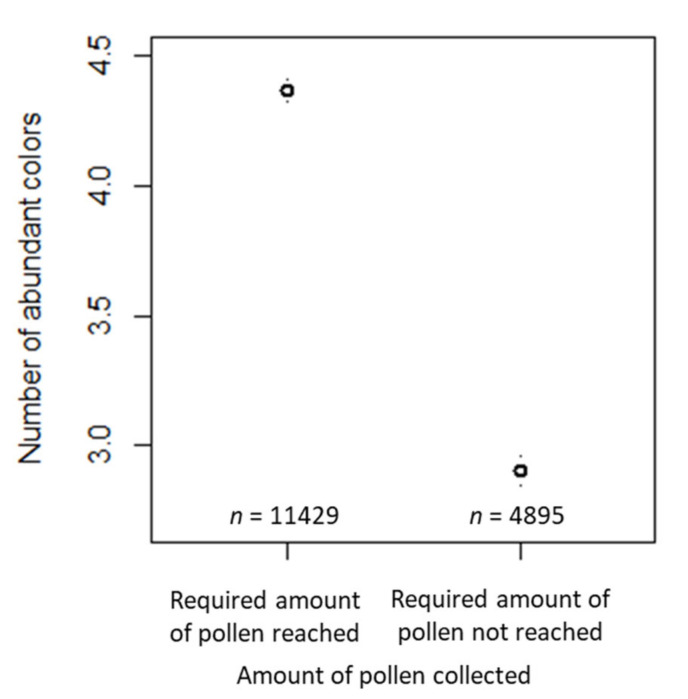
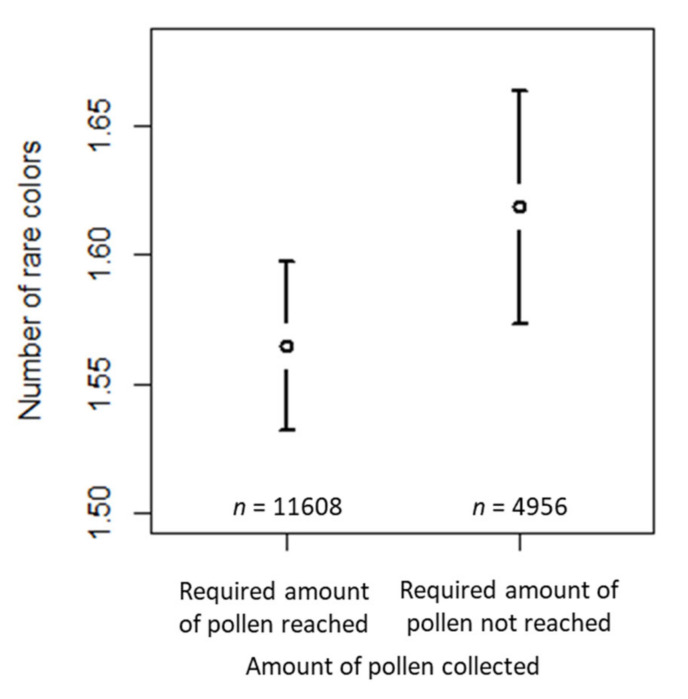
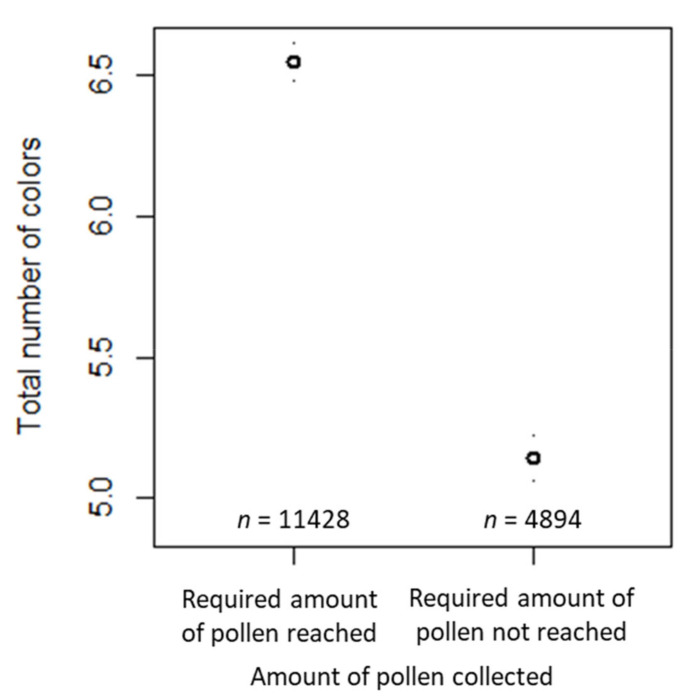
A diverse supply of pollen is an important factor for honey bee health, but information about the pollen diversity available to colonies at the landscape scale is largely missing. In this COLOSS study, beekeeper citizen scientists sampled and analyzed the diversity of pollen collected by honey bee colonies. As a simple measure of diversity, beekeepers determined the number of colors found in pollen samples that were collected in a coordinated and standardized way. Altogether, 750 beekeepers from 28 different regions from 24 countries participated in the two-year study and collected and analyzed almost 18,000 pollen samples. Pollen samples contained approximately six different colors in total throughout the sampling period, of which four colors were abundant. We ran generalized linear mixed models to test for possible effects of diverse factors such as collection, i.e., whether a minimum amount of pollen was collected or not, and habitat type on the number of colors found in pollen samples. To identify habitat effects on pollen diversity, beekeepers' descriptions of the surrounding landscape and CORINE land cover classes were investigated in two different models, which both showed that both the total number and the rare number of colors in pollen samples were positively affected by 'urban' habitats or 'artificial surfaces', respectively. This citizen science study underlines the importance of the habitat for pollen diversity for bees and suggests higher diversity in urban areas.

Keywords: Apis mellifera; COLOSS; citizen science; diversity; foraging ecology; landscape; nutrition; season.


Conflict of interest statement

Authors declare no conflict of interest.

Figures

Figure A1
Figure A1
Number of pollen loads per sample that fit in a standard honey jar lid. n = 113 samples collected by citizen scientist beekeepers in Spain (excl. Tenerife) and manually counted.
Figure 1
Figure 1
Sorting corbicular pollen loads collected in pollen traps by color using a spatula. Photo: Bernd Niederkofler.
Figure 2
Figure 2
Exact location (point) and 2 km buffers (circles) around sampling sites in the area of greater London, UK. Map shows CORINE land cover classes.
Figure 3
Figure 3
Number of active citizen scientists per sampling in 2014 and 2015.
Figure 4
Figure 4
Map showing sampling locations in 2014, 2015, and in both years. Insert shows the island of Tenerife.
Figure 5
Figure 5
Percentage of honey bee colonies that collected the required amount of 20 g pollen loads throughout the season. Data from two years and trapping duration (1 day) or 1 to 3 or more days (1–3+ days) are shown. n = 209–1241 colonies sampled by citizen scientists per data point.
Figure 6
Figure 6
Confidence interval plots (mean and 95% CI) for number of colors per sampling period. (a) number of abundant colors per sampling period; (b) number of rare colors per sampling period; (c) total number of colors per sampling period. Sample sizes in (a) apply for (b) and (c) too.
Figure 7
Figure 7
Confidence interval plots for number of abundant colors as dependent variable and sampling amount and duration and habitat types according to the beekeepers’ specification as fixed effects. Mean (and 95% CI) number of abundant colors in samples where (a) the required amount of pollen was reached vs. samples where the required amount was not reached; (b) arable land vs. no arable land surrounded the apiary and: (c) the pollen trap was open for different durations.
Figure 8
Figure 8
Confidence interval plots for number of rare colors as a dependent variable and habitat types according to the beekeepers’ specification as a fixed effect. Mean (and 95% CI) number of rare colors in samples where: (a) the required amount of pollen had been reached vs. samples where the required amount had not been reached; (b) urban habitat vs. rural habitat surrounded the apiary.
Figure 9
Figure 9
Confidence interval plots for the total number of colors as a dependent variable and habitat types according to the beekeepers’ specification as a fixed effect. Mean (and 95% CI) total number of colors in samples where: (a) the required amount of pollen had been reached vs. samples where the required amount had not been reached; (b) urban habitat vs. rural habitat surrounding the apiary.
Figure 10
Figure 10
Confidence interval plot for number of abundant colors as a dependent variable and habitat proportions according to the CORINE data as a fixed effect. Mean (and 95% CI) number of abundant colors in samples where the required amount of pollen had been reached vs. samples where the required amount had not been reached.
Figure 11
Figure 11
Confidence interval plots for number of rare colors as dependent variable and habitat proportions according to the CORINE data as a fixed effect. Mean (and 95% CI) number of rare colors in samples where the required amount of pollen had been reached vs. samples where the required amount had not been reached.
Figure 12
Figure 12
Confidence interval plots for the total number of colors as a dependent variable and habitat proportions according to the CORINE data as a fixed effect. Mean (and 95% CI) total number of rare colors in samples where the required amount of pollen had been reached vs. samples where the required amount had not been reached.

References

    1. McLellan A.R. Factors Affecting Pollen Harvesting by the Honeybee. J. Appl. Ecol. 1976;13:801. doi: 10.2307/2402256. - DOI
    1. Coffey M.F., Breen J. Seasonal Variation in Pollen and Nectar Sources of Honey Bees in Ireland. J. Apicult. Res. 1997;36:63–76. doi: 10.1080/00218839.1997.11100932. - DOI
    1. Dimou M., Thrasyvoulou A. Seasonal Variation in Vegetation and Pollen Collected by Honeybees in Thessaloniki, Greece. Grana. 2007;46:292–299. doi: 10.1080/00173130701760718. - DOI
    1. Vaudo A.D., Tooker J.F., Grozinger C.M., Patch H.M. Bee Nutrition and Floral Resource Restoration. Curr. Opin. Insect Sci. 2015;10:133–141. doi: 10.1016/j.cois.2015.05.008. - DOI - PubMed
    1. De Vere N., Jones L.E., Gilmore T., Moscrop J., Lowe A., Smith D., Hegarty M.J., Creer S., Ford C.R. Using DNA Metabarcoding to Investigate Honey Bee Foraging Reveals Limited Flower Use despite High Floral Availability. Sci. Rep. 2017;7:42838. doi: 10.1038/srep42838. - DOI - PMC - PubMed