Clinical Trial
. 2022 Jan;39(1):598-618.
doi: 10.1007/s12325-021-01919-z. Epub 2021 Nov 25.

Population Pharmacokinetics and Exposure-Response Analyses for Venetoclax in Combination with R-CHOP in Relapsed/Refractory and Previously Untreated Patients with Diffuse Large B Cell Lymphoma

Affiliations
Clinical Trial

Population Pharmacokinetics and Exposure-Response Analyses for Venetoclax in Combination with R-CHOP in Relapsed/Refractory and Previously Untreated Patients with Diffuse Large B Cell Lymphoma

Divya Samineni et al. Adv Ther. 2022 Jan.

Abstract

Introduction: Outcomes remain poor in patients with diffuse large B cell lymphoma (DLBCL) who overexpress BCL-2 protein. We present population pharmacokinetics (PopPK) and exposure-response (ER) analyses for venetoclax (a selective BCL-2 inhibitor) administered with rituximab-cyclophosphamide, doxorubicin, vincristine, and prednisone (R-CHOP) in patients with relapsed/refractory (R/R) and previously untreated (1L) non-Hodgkin lymphoma (NHL) from the phase 1b/2 CAVALLI study, to confirm dose selection for future studies.

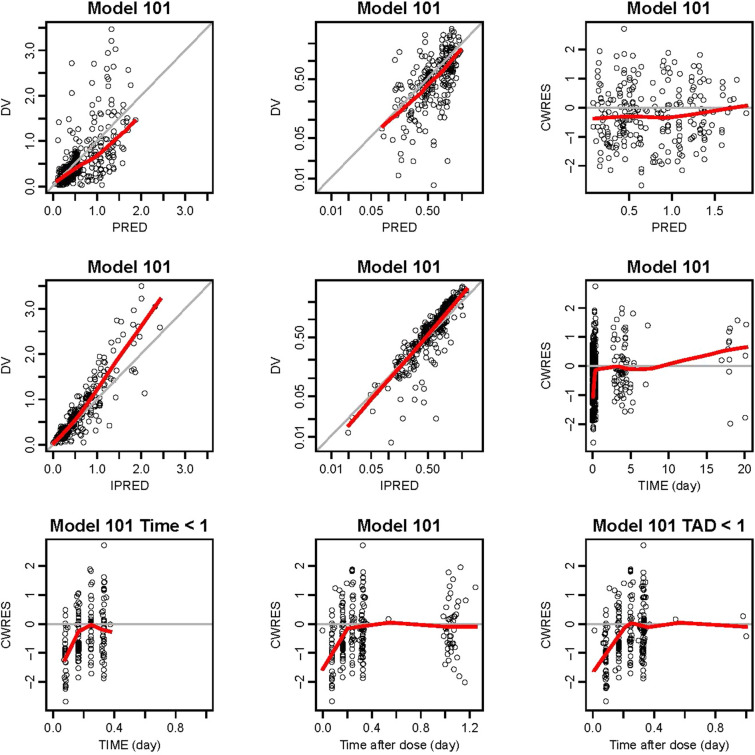
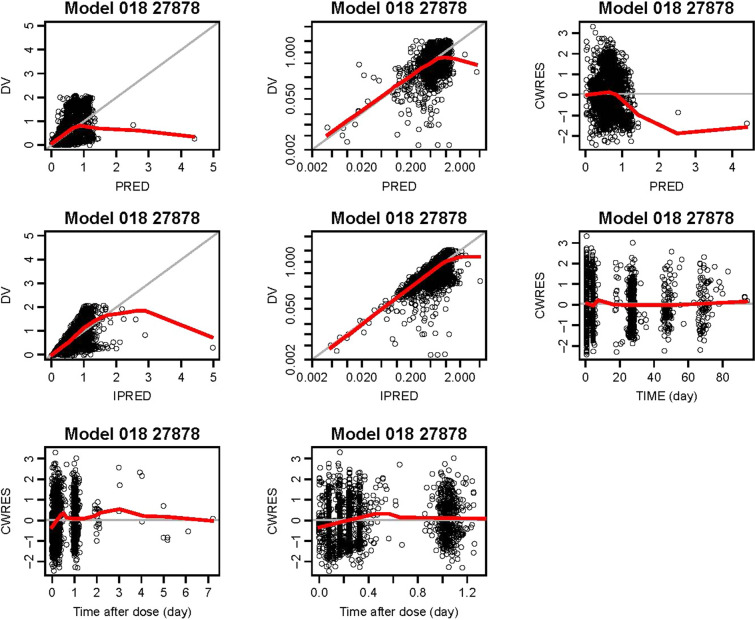
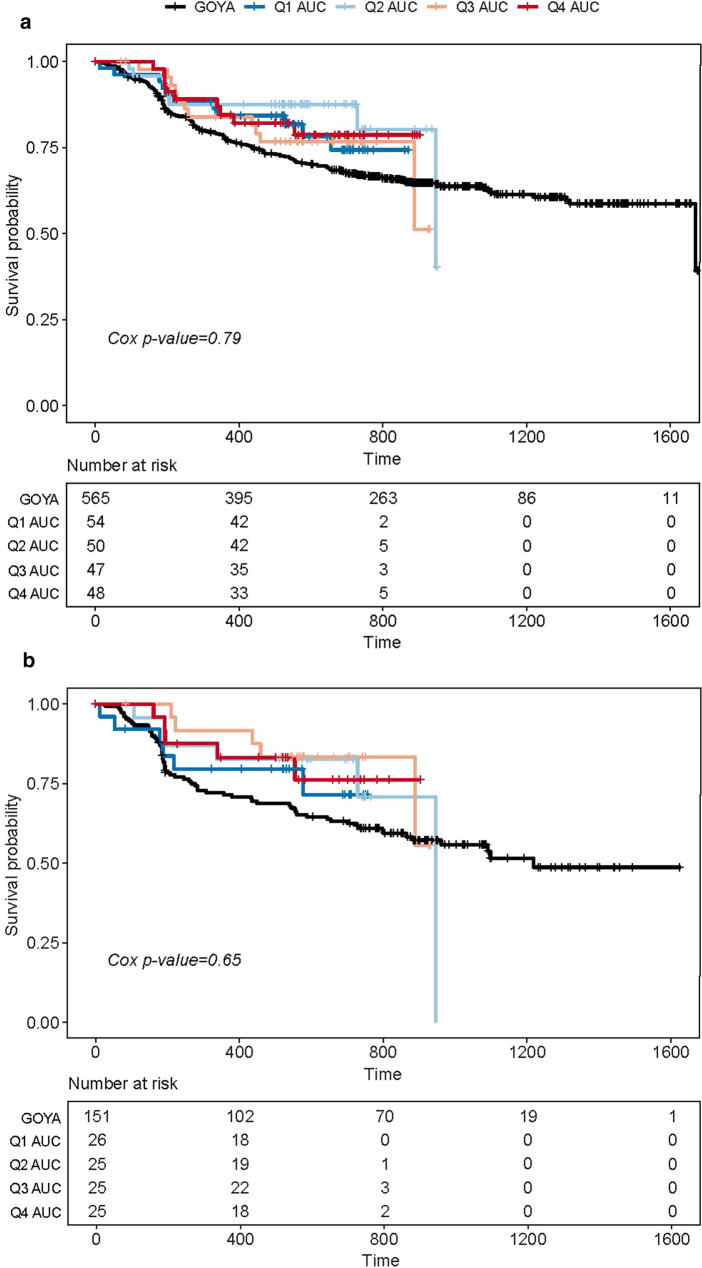
Methods: Analyses included 216 patients with R/R or 1L NHL treated for eight 21-day cycles with 400-800 mg venetoclax (cycle 1: days 4-10; cycles 2-8: days 1-10) in combination with R for eight cycles and CHOP for 6-8 cycles. A legacy PopPK model for venetoclax was used to describe the observed data and provide post hoc PK parameters. Venetoclax steady-state exposure (AUCss) was used to predict clinical efficacy, safety, or tolerability. To isolate the effect of venetoclax, ER analyses referenced data from the R-CHOP arm of a historical control study, GOYA, in 1L DLBCL.

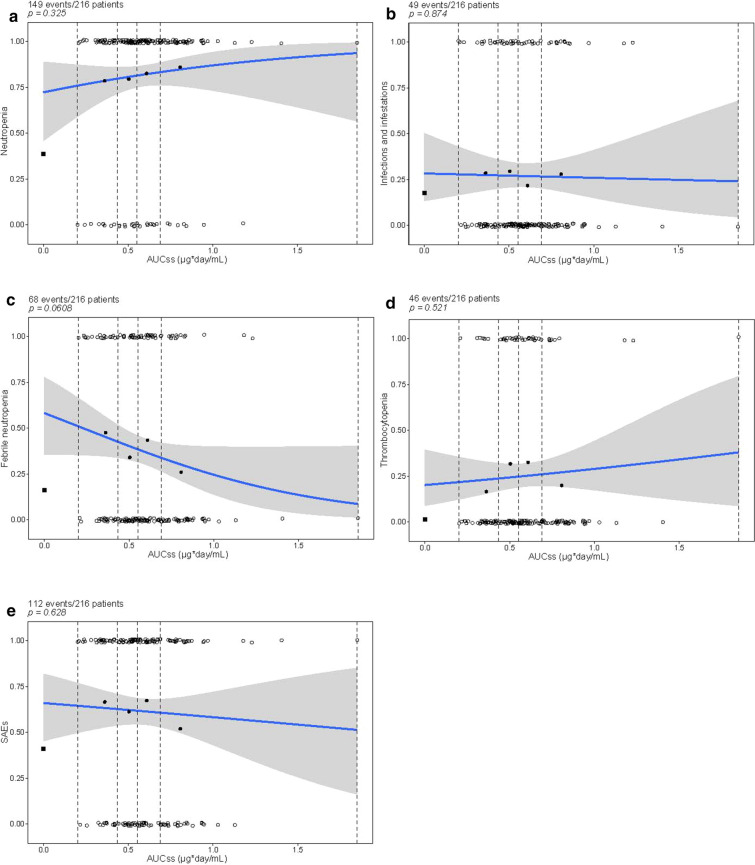
Results: There was no significant association between venetoclax AUCss and progression-free survival or complete response either for all-comers or the BCL-2-immunohistochemistry-positive subpopulation. No statistically significant trends were observed with venetoclax AUCss and the key grade ≥ 3 adverse events and serious adverse events. Similar dose intensities were observed for venetoclax and R-CHOP components across venetoclax exposures, suggesting venetoclax did not impact delivery of the R-CHOP backbone.

Conclusions: The PopPK and ER analyses, in addition to the positive benefit-risk observed in the clinical data, support the selection of 800 mg venetoclax given with R-CHOP for future studies in BCL-2-immunohistochemistry-positive patients with 1L DLBCL.

Trial registration: ClinicalTrials.gov Identifier NCT02055820.

Keywords: Diffuse Large B cell Lymphoma; Lymphoma; Pharmacokinetics; R-CHOP; Venetoclax.


Figures

Fig. 1
Fig. 1
Basic diagnostic plots for model 101 (Legacy Model Applied to the Data of CAVALLI). The gray solid y = x or y = 0 lines are included for reference. The bold red lines are the lowess (local regression smoother) trend lines. Bottom plot on the right is a truncated version of the bottom middle plot. DV observed concentrations, PRED population predictions of the model, IPRED individual predictions of the model, CWRES conditional weighted residuals, TIME time after the first dose, TAD time after the most recent dose
Fig. 2
Fig. 2
Final model (018) evaluation: goodness-of-fit plots for final model. Top row: observed versus population predicted venetoclax concentrations (linear and log scales); CWRES versus population predicted venetoclax concentrations. Second row: observed versus individual predicted venetoclax concentrations (linear and log scales); CWRES versus time. Bottom row: CWRES versus time after dose. The gray solid lines (showing plots of y = x or y = 0, as appropriate) are included for reference. The bold red lines are the lowess (local regression smoother) trend lines. CWRES conditional weighted residuals, DV observed concentrations, IPRED individual predictions of the model, PRED population predictions of the model, TIME time after the first dose
Fig. 3
Fig. 3
a Kaplan–Meier plot of PFS by investigator assessment according to venetoclax exposure (AUCss nominal) quartiles for all-comers. b PFS by investigator assessment according to venetoclax exposure quartiles for BCL-2-positive patients. AUC area under the curve of plasma concentration, BCL-2 B cell lymphoma 2, PFS progression-free survival
Fig. 4
Fig. 4
CR rate by PET at the EOT visit as a function of venetoclax nominal exposure (AUCss nominal) in a all-comers. *Black square represents the CR rates in GOYA, which was plotted, but not included in the ER analysis fit. Black unfilled circles = observed data in the CAVALLI study; blue solid line = logistical regression fitted curve; gray shaded area = 90% confidence interval (CI) of the blue solid line; probability of CR = 1: patients with CR; probability of CR = 0: patients with partial response/stable/progressive disease/no EOT assessments; black circles: observed probability of an event for each quartile of mean exposure plotted at the mean value within each exposure quartile. Dashed vertical lines show bounds of exposure groups. CIs were defined using 1000 bootstrap samples, and the logistic regression was fitted to each of these samples. The 90% CI for the logistic regression was defined as the 5th and 95th percentiles of the model predictions of the bootstrap data sets. AUCss unit: μg/mL × day. b BCL-2+ by FISH. *Red square represents the CR rates for the BCL-2 high (IHC scores 2+/3+) patients and blue square represents the CR rates for BCL-2 low (IHC scores 0/1+) patients in GOYA which was plotted, but not included in the ER analysis fit. Blue and red unfilled circles = observed data for the BCL-2 high and low subjects in the CAVALLI study; blue and red solid line = logistical regression fitted curve for the BCL-2 high and low subjects; green and pink shaded area = 90% CI of the blue and red regression line for the BCL-2 high and low subjects; probability of CR = 1: patients with CR; probability of CR = 0: patients with partial response/stable/progressive disease/no EOT assessments; blue and red circles: observed probability of an event for each quartile of mean exposure plotted at the mean value within each exposure quartile in the BCL-2 high and low subjects. CIs were defined using 1000 bootstrap samples, and the logistic regression was fitted to each of these samples. The 90% CI for the logistic regression was defined as the 5th and 95th percentiles of the model predictions of the bootstrap data sets. AUCss nominal unit: μg/mL × day. c BCL-2+ by IHC subpopulations. AUCss area under the curve of plasma concentration versus time at steady state, CI confidence interval, CR complete response, ER exposure–response, FISH fluorescence in situ hybridization, IHC immunohistochemistry, PET positron emission tomography, EOT end of treatment
Fig. 5
Fig. 5
Incidence of grade ≥ 3 a neutropenia, b infections and infestations, c febrile neutropenia, d thrombocytopenia, and e SAEs as a function of venetoclax nominal exposure (AUCss nominal). *Black square represents the observed fraction of patients with events in GOYA, which was plotted, but not included in the ER analysis fit. The blue solid line and gray shaded area = logistic regression model prediction and 90% CI of predictions. The unfilled circles = exposure of individual patients with events (p = 1) and without events (p = 0); black circles = observed probability of an event for each quartile of mean exposure plotted at the mean value within each exposure quartile in the CAVALLI study. Dashed vertical lines show bounds of exposure groups. CIs were defined using 1000 bootstrap samples, and the logistic regression was fitted to each of these samples. The 90% CI for the logistic regression was defined as the 5th and 95th percentiles of the model predictions of the bootstrap data sets. AUCss nominal unit: μg/mL × day. Venetoclax doses tested were 400 mg (N = 3), 600 mg (N = 8), 800 mg (N = 205) given for 10 days of 21-day cycles. AUCss area under the curve of plasma concentration versus time at steady state, CI confidence interval, ER exposure–response, SAE serious adverse event
Fig. 6
Fig. 6
RDIs for R-CHOP and venetoclax in CAVALLI as a function of venetoclax nominal exposure (AUCss nominal). Values in the lower right of each panel represent the correlation coefficient. Circles correspond to individual dose intensity values. AUCss defined by Eq. (1) was used as a measure of exposure. Red lines are the lowess trend lines. Plus sign represents an individual patient’s relative dose intensity values. AUCss area under the curve of plasma concentration versus time at steady state, CHOP cyclophosphamide, doxorubicin, vincristine, and prednisone, R rituximab, RDI relative dose intensity

References

    1. Hata AN, Yeo A, Faber AC, et al. Failure to induce apoptosis via BCL-2 family proteins underlies lack of efficacy of combined MEK and PI3K inhibitors for KRAS-mutant lung cancers. Cancer Res. 2014;74(11):3146–3156. doi: 10.1158/0008-5472.CAN-13-3728. - DOI - PMC - PubMed
    1. Campbell KJ, Tait SWG. Targeting BCL-2 regulated apoptosis in cancer. Open Biol. 2018 doi: 10.1098/rsob.180002. - DOI - PMC - PubMed
    1. Zhang HW, Cheng NL, Chen ZW, Wang JF, Li SH, Bai W. Clinical impact of t(14;18) in diffuse large B-cell lymphoma. Chin J Cancer Res. 2011;23(2):160–164. doi: 10.1007/s11670-011-0160-x. - DOI - PMC - PubMed
    1. Anderson MA, Tsui A, Wall M, Huang DC, Roberts AW. Current challenges and novel treatment strategies in double hit lymphomas. Ther Adv Hematol. 2016;7(1):52–64. doi: 10.1177/2040620715608091. - DOI - PMC - PubMed
    1. Souers AJ, Leverson JD, Boghaert ER, et al. ABT-199, a potent and selective BCL-2 inhibitor, achieves antitumor activity while sparing platelets. Nat Med. 2013;19(2):202–208. doi: 10.1038/nm.3048. - DOI - PubMed

Publication types

MeSH terms

Associated data