. 2022 Feb;51(2):318-332.
doi: 10.1007/s13280-021-01658-z. Epub 2021 Nov 25.

Monitoring a changing Arctic: Recent advancements in the study of sea ice microbial communities

Affiliations

Monitoring a changing Arctic: Recent advancements in the study of sea ice microbial communities

Karley Campbell et al. Ambio. 2022 Feb.

Abstract

Sea ice continues to decline across many regions of the Arctic, with remaining ice becoming increasingly younger and more dynamic. These changes alter the habitats of microbial life that live within the sea ice, which support healthy functioning of the marine ecosystem and provision of resources for human-consumption, in addition to influencing biogeochemical cycles (e.g. air-sea CO2 exchange). With the susceptibility of sea ice ecosystems to climate change, there is a pressing need to fill knowledge gaps surrounding sea ice habitats and their microbial communities. Of fundamental importance to this goal is the development of new methodologies that permit effective study of them. Based on outcomes from the DiatomARCTIC project, this paper integrates existing knowledge with case studies to provide insight on how to best document sea ice microbial communities, which contributes to the sustainable use and protection of Arctic marine and coastal ecosystems in a time of environmental change.

Keywords: Algae; Biogeochemistry; Climate Change; Microbes; Modeling; Sea ice.


Figures

Fig. 1
Fig. 1
Regional summary of minimum (cyan), maximum (red) and average (dark blue) values for 14C-based algal primary production (PP, circles) relative to chlorophyll a (chl a) and bacterial production (BP, squares) in sea ice: first year (unlabeled or F), multiyear (M), pack ice of unspecified age (P), or a combination of types (e.g. F + P). Arrows indicate the main water inflows from the Pacific (blue) and Atlantic (red) Oceans, general movement of surface waters, and nutrient fluxes (kmol s−1) into (positive) and out of (negative) the Arctic. Ice algal chl a (boxes, mg m−2) and bacterial cell counts (boxes, cells l−1) are also specified. Arctic water bodies defined by the International Hydrographic Organization (1953) are shaded and regions of interest highlighted in this paper are circled (purple). The approximate boundary between continental shelf and deep-water basins is shown as a dashed line. See supplementary material (S.1) for further references of information
Fig. 2
Fig. 2
Relative abundance of 18S rRNA gene amplicons at three sea ice sites (A, C, F) in northwestern Hudson Bay, shown on synthetic aperture radar (SAR) image for 16 May, 2019, offshore from the community of Coral Harbour. Organisms > 10 mm were selected for in this analysis by filtration. Note that Site C was sampled at three time points (4th, 17th and 29th May). Three replicates were generated from each sampling location
Fig. 3
Fig. 3
Example of denitrification pathway in a metagenomic assembled genome (MAG) of the Family Saccharospirillaceae. The MAG encodes both the facultatively anaerobic denitrification and dissimilatory nitrate reduction to ammonia pathways. It represented up to 10% of the prokaryotic community in northwestern Hudson Bay. Encoded enzymes in the MAG are designated in the black rectangles: NapAB nitrate reductase; NirS nitrite reductase; NorBC nitric oxide reductase subunits; NosZ nitrous-oxide reductase; NirBD nitrite reductase subunits
Fig. 4
Fig. 4
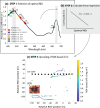
Illustration of process in using normalized difference indices (NDI) to remotely estimate ice algal chlorophyll a (chl a): a Step 1. An optimal NDI is calculated for a given study following Pearson Correlation analysis. The resultant optimal wavelength pairs of published NDIs are shown on the spectra of chl a absorption across photosynthetically active radiation (PAR), with 440 nm and 670 nm chl a absorption peaks highlighted (grey); b Step 2. A linear regression between ice core-based chl a and the optimal NDI is established for a given study; c Step 3. The linear regression of Step 2 may be applied to under-ice light data measured by remotely operated vehicle (pictured, ROV) to estimate chl a (coloured circles; secondary axis scale) over greater areas following calibration to ice cores (black circles). Data from Campbell et al. (in review)
Fig. 5
Fig. 5
a A coloured band of algal pigments indicating the chlorophyll (chl) a biomass present in the bottom 10 cm of ice cores collected from northwestern Hudson Bay; b the chl a biomass, as well as 8-bit blue channel intensity is shown for 2.5-cm intervals; c the linear relationship between chl a biomass and blue channel intensity in the bottom 10 cm of sea ice
Fig. 6
Fig. 6
Model output of a sea ice thickness, b snow depth and c irradiance as quanta of light in the range of photosynthetically active radiation (PAR) in the Biologically Active Layer (BAL; Tedesco et al. 2010) for the study setup. Model output based on reanalysis data with and without using sea ice thickness and snow depth observations as input for the model shown in red and black respectively, with the field observations shown in blue. d The model sensitivity of total chl a in the biologically active layer to scaling the light levels up and down by 50%. The evolution of total chl a concentration in BAL under the modelled PAR irradiance levels is shown in black, and the results from the simulations in which the PAR levels are scaled down and up by 50% are shown in red and blue, respectively

References

    1. Aksenov Y, Popova EE, Yool A, Nurser AJG, Williams TD, Bertina L, Bergh J. On the future navigability of Arctic sea routes: High-resolution projections of the Arctic Ocean and sea ice. Marine Policy. 2017;75:300–317. doi: 10.1016/j.marpol.2015.12.027. - DOI
    1. Arrigo KR. Sea ice ecosystems. Annual Review of Marine Science. 2014;6:439–467. doi: 10.1146/annurev-marine-010213-135103. - DOI - PubMed
    1. Aumack CF, Juhl AR, Krembs C. Diatom vertical migration within land-fast Arctic sea ice. Journal of Marine Systems. 2014;139:496–504. doi: 10.1016/j.jmarsys.2014.08.013. - DOI
    1. Bachy C, Lopez-Garcia P, Vereshchaka A, Moreira D. Diversity and vertical distribution of microbial eukaryotes in the snow, sea ice and seawater near the North Pole at the end of the polar night. Frontiers in Microbiology. 2011;2:1–12. doi: 10.3389/fmicb.2011.00106. - DOI - PMC - PubMed
    1. Boetius A, Albrecht S, Bakker K, Bienhold C, Felden J, Fernández-Méndez M, Hendricks S, Katlein C, et al. Export of algal biomass from the melting Arctic sea ice. Science. 2013;339:1430–1432. doi: 10.1126/science.1231346. - DOI - PubMed

LinkOut - more resources