. 2021 Nov 26;374(6571):eabh2444.
doi: 10.1126/science.abh2444. Epub 2021 Nov 26.

Stem cells expand potency and alter tissue fitness by accumulating diverse epigenetic memories

Affiliations

Stem cells expand potency and alter tissue fitness by accumulating diverse epigenetic memories

Kevin Andrew Uy Gonzales et al. Science. .

Abstract

Immune and tissue stem cells retain an epigenetic memory of inflammation that intensifies sensitivity to future encounters. We investigated whether and to what consequence stem cells possess and accumulate memories of diverse experiences. Monitoring a choreographed response to wounds, we found that as hair follicle stem cells leave their niche, migrate to repair damaged epidermis, and take up long-term foreign residence there, they accumulate long-lasting epigenetic memories of each experience, culminating in post-repair epigenetic adaptations that sustain the epidermal transcriptional program and surface barrier. Each memory is distinct, separable, and has its own physiological impact, collectively endowing these stem cells with heightened regenerative ability to heal wounds and broadening their tissue-regenerating tasks relative to their naïve counterparts.


Conflict of interest statement

Competing interests: The authors declare that they have no competing interests.

Figures

Fig. 1.
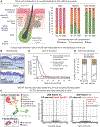
Fig. 1.. Hair follicle–derived epidermis is indistinguishable from native epidermis during homeostasis.
(A) Different niche contributions to re-epithelialization depending on type of wound. Left: SC niches and types of injuries analyzed. Dashed lines indicate which layer of cells are removed in each wounding scenario. Right: Flow cytometry quantifications of stem cell niche contributions to re-epithelialized skin epidermis (Linneg α6+ Sca1+ cells; Linneg = CD117neg CD45neg CD140aneg CD31neg) analyzed at days 3, 7, and 60 after wounding (see fig. S2C and supplementary materials). Sox9CreER is HF-specific, and its efficient labeling of HFs (~70 to 100%) indicates that repair from shallow and intermediate wounds originates from HFs and not epidermis. Krt19CreER is bulge-specific, and when normalized for its low labeling efficiency, it showed little contribution to shallow wounds but strong contribution to intermediate wounds (comparable percentage of Krt19CreER-traced EpdSCs in re-epithelialized epidermis and in HFSCs within the bulge). Error bars denote SD of three wounds per time point.(B) Toluidine blue–stained semi-thin sections show similar morphologies between day-60 HF-derived and native epidermis. Scale bars, 25 mm. (C) Epidermal barrier function analysis. Time-course measurements of trans-epidermal water loss were recorded with a Tewameter. Wound sizes were adjusted such that complete re-epithelialization was achieved in both wound types at day ~6 after wounding. Error bars denote SD for 12 mice. Convergence points were calculated using a one-phase decay model. (D) Cell cycle phase distribution based on DNA content in day-70 HF-derived and native EpdSCs (Linneg α6+ Sca1+ CD200neg), as quantified by flow cytometry. Error bars denote SD for 10 mice. Welch’s t test was used to calculate P value. (E) Single-cell transcriptomes of HF-derived EpdSCs are indistinguishable from those of native EpdSCs. Left: UMAP plot of Leiden-clustered transcriptomes from day-0 control, day-80 control, and day-80 intermediate-wounded epithelial cells, with inset indicating the niche origin of day-80 Epd cells. Right: DESeq2 analysis in the EpdSC and suprabasal Epd clusters, showing no differentially expressed genes between native and HF-derived epidermal cells. N.S., not significant.
Fig. 2.
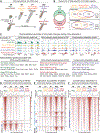
Fig. 2.. Stem cell fate switch requires epigenetic adaptation to the new niche.
(A) Cell populations collected for ATAC-seq analysis (see fig. S4A). (B) Venn diagrams depicting the categorization of niche-specific peaks as they are progressively gained or lost over time. Peaks that fluctuate over time were excluded. (C) Top: Snapshots of example genomic loci for HFSC-specific peaks lost, EpdSC-specific peaks gained only at day 80 (“niche-adaptive”), and peaks unique to HF-derived EpdSCs (“compensatory adaptation”). Light blue shading denotes called peaks. Bottom: Representative genes for each aforementioned category, grouped by function. (D to F) Density plots depicting ATAC-seq signals at summits ± 1 kb of HFSC-specific peaks (D), EpdSC-specific peaks (E), and peaks unique to HF-derived EpdSCs (F), with heatmaps of individual peaks beneath.
Fig. 3.
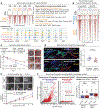
Fig. 3.. Wound memory intrinsically accelerates migration kinetics in secondary wounds.
(A) Density plots depict ATAC-seq signals at summits ± 1 kb of wound memory peaks with heatmap of individual peaks beneath. Representative genes are shown at right. At bottom are snapshots of genomic loci; light blue shading denotes called wound memory peaks. (B) Density plots depict ATAC-seq signalsat summits ± 1 kb of inflammatory and wound memory peaks, with corresponding heatmaps of individual peaks below. Inflammatory memory peaks were called by reanalyzing data from post-inflamed IMQ-treated skin in (23) (see fig. S6B and supplementary materials). Note that the 520 inflammatory memory peaks exhibit similar memory in HF-derived EpdSCs at day 80 after wounding, but the2584 memory peaks induced by wounding were relatively unchanged between post-inflamed EpdSCs and their untreated control. (C) Secondary deep wound closure assays. Timeline of the experiment is shown at top left, quantification of wound closure rates at bottom left, and representative photographs of wounds at right. Scale bars, 2 mm. Error bars denote SD from 11 (HF-derived) or 10 (native) wounds. Simple linear regression was used to calculate P value between slopes. (D) Representative immunofluorescence images of wound edge 2 days after a secondary deep wound administered to either HF-derived re-epithelialized day-80 epidermis or native epidermis. Vertical lines denote boundaries of the wound. Orange dashed line denotes the epidermis-eschar boundary. Scale bars, 50 μm. Quantification of migrating α5+ tongue length is at right. Error bars denote SD from 11 (HF-derived) or 10 (native) wound edges. Unpaired t test was used to calculate P value. (E) Top: Representative images of proliferation-blocked (by mitomycin C) cell migration into a large scratch wound (~2.5 mm), as tracked by CellTracker Green at the times indicated. Dashed lines denote migratory border. Scale bars, 0.5 mm. Bottom: Quantification of distance traveled over time. Error bars denote SD from 10 (HF-derived) or 14 (native) scratch wounds. Simple linear regression was used to calculate P value between slopes. (F) Left: DESeq2 analysis of EpdSCs collected3 days after deep wounding. Shown are genes whose expression is up-regulated in migratory versus quiescent clusters (see fig. S7, D and E). Representative genes with wound memory peaks are marked, highlighting their more robust transcription in the secondary versus primary wound. Right: Boxplot of median transcript levels as log2 (TPM+1) values of 202 wound memory–associated genes whose expression is up-regulated specifically in the migratory tongue of HF-derived EpdSCs in secondary wounds. Boxplot central line denotes the median, boxes denote the interquartile range (IQR), and whiskers denote 1.5 × IQR. Mann-Whitney test was used to calculate P value.
Fig. 4.
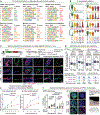
Fig. 4.. Memory of niche origin enables efficient reversion to HFSCs.
(A) Density plots depict ATAC-seq signals at summits ± 1 kb of memory-of-niche-origin peaks with heatmap of individual peaks beneath. Representative genes are shown at right; at bottom are snapshots of genomic loci; light blue shading denotes called HFSC memory peaks. (B) Colony-forming assays. Colonies (immunolabeled for integrin-β4) formed at 10 days after seeding freshly FACS-isolated SCs from skins onto culture conditions that mimic an activated HFSC state. Quantifications are shown beneath images. Error bars denote SD from five cell derivations. Paired t test was used to calculate P value.(C) Canonical WNT response to 24 hours of treatment with WNT7a and R-spondin1 in cultures of HF-derived and native EpdSCs. Left: TOPFLASH luciferase assay. Boxplot whiskers denote min-max, boxes denote 25th to 75th percentiles, and central line denotes the median. Numbers of replicates from left to right: 17, 12, 14, 13, 11, 9. Welch’s t test was used to calculate P value. Right: Scans of X-gal staining of Axin2-LacZ reporter cell lines (in 24-well plates). (D) Representative images of SCs cultured as 3D spheroids that mimic a quiescent bulge-like state. Green immunolabeling is for SOX9, NFIB and TCF3, whose genes have memory-of-bulge origin peaks. Red indicates KLF5, an EpdSC marker. Scale bars, 20 μm. (E) Representative photographs of de novo hairs that developed 2 months after grafting (chamber grafts) of SCs cultured under activated HFSC conditions. Scale bars, 0.5 cm. Numbers of grafts displaying substantial hair growth are shown at bottom.
Fig. 5.
Fig. 5.. Epigenetic memories are distinct, separate, and cumulative.
(A) Transcription factor motifs that are enriched in state-specific ATAC peaks (see fig. S9A) and memory peaks, based on de novo motif discovery by HOMER against genomic background. Significant motifs with a match score of >0.8 to a known motif are ranked (see table S9). (B) Differential TF expression in vivo. Data are shown as violin plots of transcript levels as log2 (TPM+1) values of representative TFs with motifs from (A). (C) Functional tests of memory peaks. Top: Experimental strategy. Lentiviruses harboring memory peak–driven GFP reporters and Pgk-H2BRFP (to track transduced cells) were delivered in utero, and skin samples of adult transduced mice were analyzed before and after intermediate wounding. Bottom: Representative images show state-specific reporter activities. Note that for the compensatory adaptation reporter, the cloned locus is associated with a gene expressed in native EpdSCs, but hereis integrated randomly in the genome; positive expression of the reporter is reflective of the absence of other peaks in its vicinity that normally drive the gene’s expression in the unwounded state. Scale bars, 20 μm. (D to F) Comparisons between memories of re-epithelialized EpdSCs derived from bulge HFSCs or from wound-adjacent EpdSCs. (D) Top: Boxplot of chromatin accessibility in peaks associated with memory in HF-derived (intermediate wound) and Epd-derived (deep wound) EpdSCs. Values are plotted from the union of peaks in each equivalent memory type (see fig. S10E), subdivided according to their association with genes in each relevant Gene Ontology term. Boxplot central line denotes the median, boxes denote IQR, and whiskers denote 1.5 × IQR. Mann-Whitney test was used to calculate P. Bottom: Snapshots of genomic loci; light blue shading denotes called memory peaks. (E) Memory of wound is independent of niche origin. Quantifications of migration rates after secondary wounds in vivo (left) or scratch wounds in vitro (right) are shown. Error bars denote SD from three in vivo wounds and four in vitro wounds. Simple linear regression was used to calculate P value between slopes. (F) Memory of WNT responsiveness and hair regeneration depends on niche origin. Left: TOPFLASH luciferase assay. Boxplot whiskers denote min-max, boxes denote 25th to 75th percentiles, and central line denotes the median. Numbers of replicates from left to right: 15, 15, 12, 13, 11, 9. Welch’s t test was used to calculate P. Center: Representative images of 3D spheroids immunolabeled for SOX9 and KLF5. Scale bars, 20 μm. Right: Representative photograph of chamber graft 2 months after grafting of cultured Epd-derived EpdSCs. Scale bar, 0.5 cm. Compare numbers of grafts displaying substantial hair growth to Fig. 4E.

Comment in

  • Stem cells remember insults.
    Hoste E. Hoste E. Science. 2021 Nov 26;374(6571):1052-1053. doi: 10.1126/science.abm6806. Epub 2021 Nov 25. Science. 2021. PMID: 34822297

References

    1. Gonzales KAU, Fuchs E, Skin and Its Regenerative Powers: An Alliance between Stem Cells and Their Niche. Dev. Cell 43, 387–401 (2017). doi: 10.1016/j.devcel.2017.10.001; - DOI - PMC - PubMed
    1. Johnson CB, Zhang J, Lucas D, The Role of the Bone Marrow Microenvironment in the Response to Infection. Front. Immunol 11, 585402 (2020). doi: 10.3389/fimmu.2020.585402; - DOI - PMC - PubMed
    1. Morrison SJ, Spradling AC, Stem cells and niches: Mechanisms that promote stem cell maintenance throughout life. Cell 132, 598–611 (2008). doi: 10.1016/j.cell.2008.01.038; - DOI - PMC - PubMed
    1. Blanpain C, Lowry WE, Geoghegan A, Polak L, Fuchs E, Self-renewal, multipotency, and the existence of two cell populations within an epithelial stem cell niche. Cell 118, 635–648 (2004). doi: 10.1016/j.cell.2004.08.012; - DOI - PubMed
    1. Lu CP et al., Identification of stem cell populations in sweat glands and ducts reveals roles in homeostasis and wound repair. Cell 150, 136–150 (2012). doi: 10.1016/j.cell.2012.04.045; - DOI - PMC - PubMed

Publication types