. 2021 Nov 6;13(11):787.
doi: 10.3390/toxins13110787.

Human Proximal Tubule Epithelial Cells (HK-2) as a Sensitive In Vitro System for Ochratoxin A Induced Oxidative Stress

Affiliations

Human Proximal Tubule Epithelial Cells (HK-2) as a Sensitive In Vitro System for Ochratoxin A Induced Oxidative Stress

Enrique García-Pérez et al. Toxins (Basel). .

Abstract

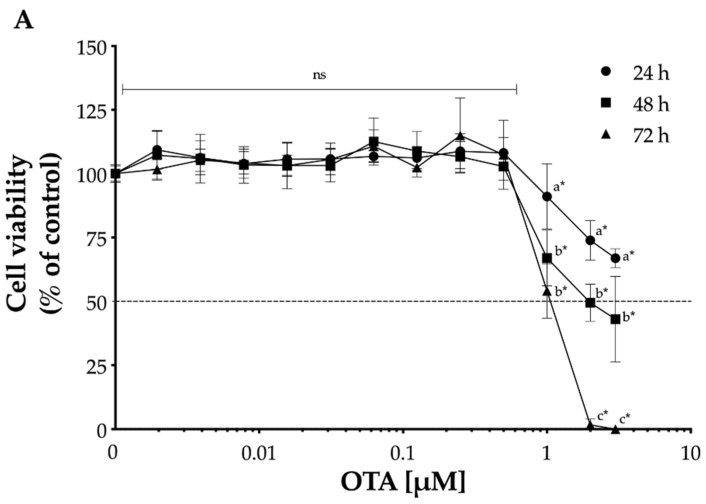
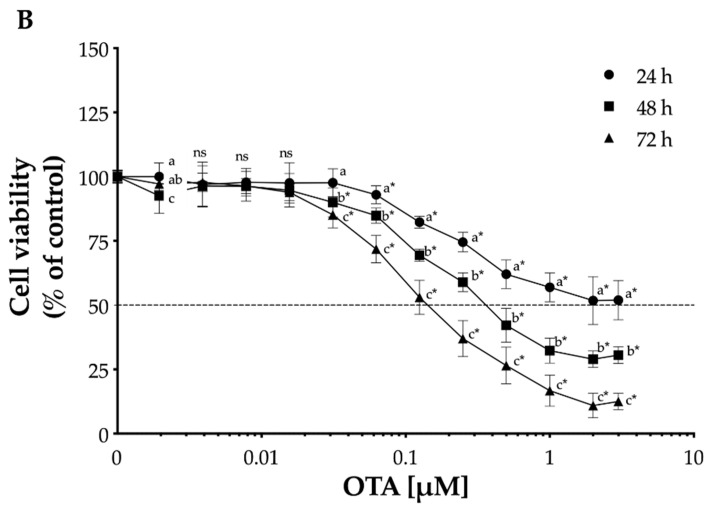
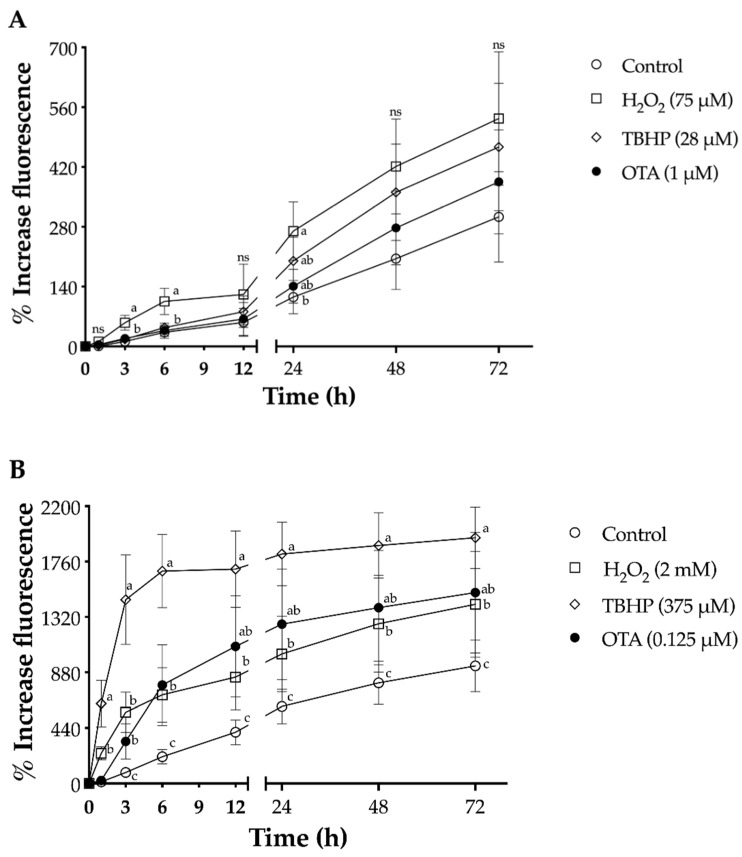
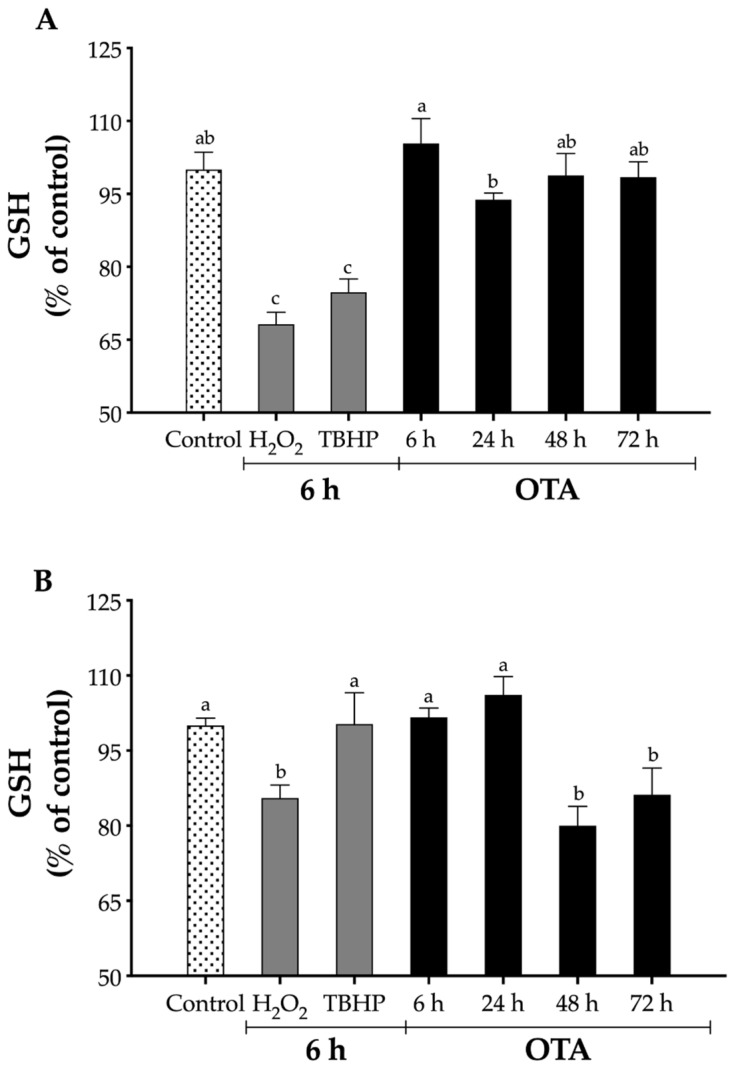
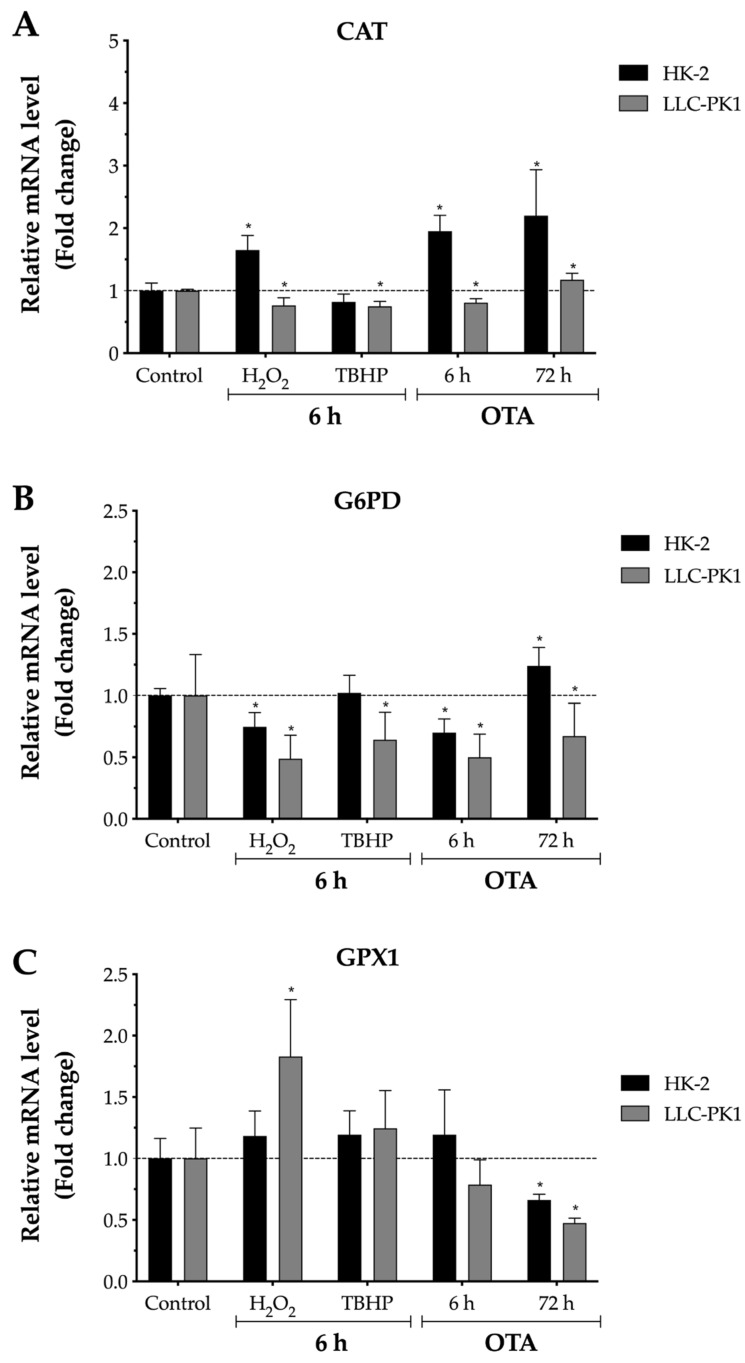
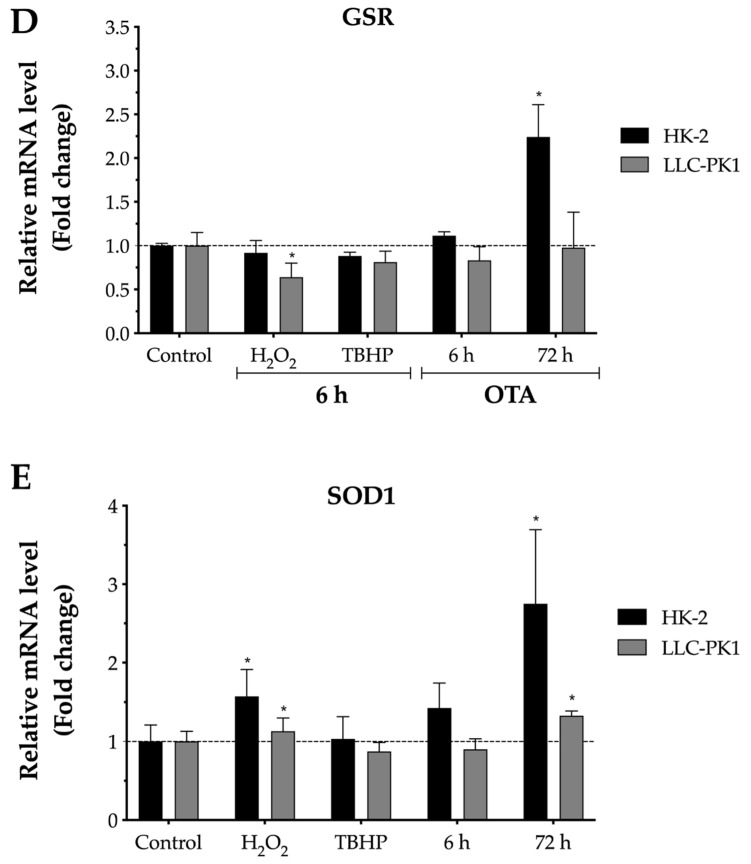
Ochratoxin A (OTA) is a mycotoxin that is potentially carcinogenic to humans. Although its mechanism remains unclear, oxidative stress has been recognized as a plausible cause for the potent renal carcinogenicity observed in experimental animals. The effect of OTA on oxidative stress parameters in two cell lines of LLC-PK1 and HK-2 derived from the kidneys of pig and human, respectively, were investigated and compared. We found that the cytotoxicity of OTA on LLC-PK1 and HK-2 cells was dose- and time-dependent in both cell lines. Furthermore, increased intracellular reactive oxygen species (ROS) induced by OTA in both cell lines were observed in a time-dependent manner. Glutathione (GSH) was depleted by OTA at >48 h in HK-2 but not in LLC-PK1 cells. While the mRNA levels of glucose-6-phosphate dehydrogenase (G6PD) and glutathione peroxidase 1 (GPX1) in LLC-PK1 were down-regulated by 0.67- and 0.66-fold, respectively, those of catalase (CAT), glutathione reductase (GSR), and superoxide dismutase 1 (SOD) in HK-2 were up-regulated by 2.20-, 2.24-, and 2.75-fold, respectively, after 72 h exposure to OTA. Based on these results, we conclude that HK-2 cells are more sensitive to OTA-mediated toxicity than LLC-PK1, and OTA can cause a significant oxidative stress in HK-2 as indicated by changes in the parameter evaluated.

Keywords: HK-2; LLC-PK1; kidney cell lines; ochratoxin A (OTA); oxidative stress; renal carcinogen.


Conflict of interest statement

The authors have declared no conflicts of interest.

Figures

Figure 1
Figure 1
Time- and concentration-dependent cytotoxicity of ochratoxin A (OTA) in proximal tubule epithelial cells. Cell viability was determined by the reduction in MTT after incubation with OTA for 24 h (•), 48 h (■), and 72 h (▲) in LLC-PK1 (A) and HK-2 (B) cells. Values are mean (n = 3) ± standard deviation, and they are expressed as percentage of control. The dotted line (···) represents the concentration of OTA that reduced the cell viability by 50%. Different letters indicate a statistically significant difference (p < 0.05) between values within the same OTA concentration by Tukey’s multiple comparison test, while ns = non-significant. Asterisks (*) indicate a statistically significant difference (p < 0.05) between values against each group control by Dunnett’s test.
Figure 1
Figure 1
Time- and concentration-dependent cytotoxicity of ochratoxin A (OTA) in proximal tubule epithelial cells. Cell viability was determined by the reduction in MTT after incubation with OTA for 24 h (•), 48 h (■), and 72 h (▲) in LLC-PK1 (A) and HK-2 (B) cells. Values are mean (n = 3) ± standard deviation, and they are expressed as percentage of control. The dotted line (···) represents the concentration of OTA that reduced the cell viability by 50%. Different letters indicate a statistically significant difference (p < 0.05) between values within the same OTA concentration by Tukey’s multiple comparison test, while ns = non-significant. Asterisks (*) indicate a statistically significant difference (p < 0.05) between values against each group control by Dunnett’s test.
Figure 2
Figure 2
Production of reactive oxygen species by H2O2, TBHP, and ochratoxin A (OTA) in proximal tubule epithelial cells at various exposure times up to 72 h. Increase in DCF fluorescence, upon oxidation of carboxy-H2DCF, was monitored after exposure to the test compound. (A) LLC-PK1 cells H2O2 (☐ ,75 μM), TBHP (△, 28 μM), and OTA (•, 1 μM); (B) HK-2 H2O2 (☐, 2 mM), TBHP (△, 375 μM), and OTA (•, 0.125 μM). In both cell lines, non-treated controls are denoted by open circles (◯). Values are mean (n = 3) ± standard deviation, and they are expressed as percentage increase in fluorescence from time zero. Different letters indicate a significant difference (p < 0.05) between treatments at each time by Tukey’s multiple comparison test, while ns = non-significant difference.
Figure 3
Figure 3
Relative levels of GSH in proximal tubule epithelial cells. GSH levels were determined by the reaction with DTBN to form 5′-thio-2-nitrobenzoic acid in cells homogenates. (A) LLC-PK1 cells H2O2 (75 μM), TBHP (28 μM), and OTA (1 μM); (B) HK-2 H2O2 (2000 μM), TBHP (375 μM), and OTA (0.125 μM). Values are mean (n = 3) ± standard deviation, and they are expressed as percentage of control. Different letters indicate a statistically significant difference (p < 0.05) between treatments at each time by Tukey’s multiple comparison test.
Figure 4
Figure 4
Relative mRNA levels of CAT, G6PD, GSR, GPX, and SOD in proximal tubule epithelial cells after exposure to H2O2, TBHP, and ochratoxin A (OTA). The mRNA expression of each gene was normalized using GADPH mRNA expression as housekeeping gene. LLC-PK1 cells H2O2 (75 μM), TBHP (28 μM), and OTA (1 μM). HK-2 H2O2 (2 mM), TBHP (375 μM), and OTA (0.125 μM). (A) Catalase, CAT. (B) Glucose-6-phosphate dehydrogenase, G6PD. (C) Glutathione peroxidase 1, GPX1. (D) Glutathione reductase, GSR. (E) Superoxide dismutase 1, SOD1. Values are mean (n = 3) ± standard error of the mean, and they are expressed as fold change by the 2−ΔΔCt method. The dotted line (···) represents the level of mRNA for control cells. Asterisks (*) indicate a statistically significant difference (p < 0.05) between values against each cell line control by Student’s t-test. The fold change in OTA 72 h group was normalized with an independent control at 72 h.
Figure 4
Figure 4
Relative mRNA levels of CAT, G6PD, GSR, GPX, and SOD in proximal tubule epithelial cells after exposure to H2O2, TBHP, and ochratoxin A (OTA). The mRNA expression of each gene was normalized using GADPH mRNA expression as housekeeping gene. LLC-PK1 cells H2O2 (75 μM), TBHP (28 μM), and OTA (1 μM). HK-2 H2O2 (2 mM), TBHP (375 μM), and OTA (0.125 μM). (A) Catalase, CAT. (B) Glucose-6-phosphate dehydrogenase, G6PD. (C) Glutathione peroxidase 1, GPX1. (D) Glutathione reductase, GSR. (E) Superoxide dismutase 1, SOD1. Values are mean (n = 3) ± standard error of the mean, and they are expressed as fold change by the 2−ΔΔCt method. The dotted line (···) represents the level of mRNA for control cells. Asterisks (*) indicate a statistically significant difference (p < 0.05) between values against each cell line control by Student’s t-test. The fold change in OTA 72 h group was normalized with an independent control at 72 h.

References

    1. International Agency for Research on Cancer (IARC) Some Naturally Occurring Substances: Food Items and Constituents, Heterocyclic Aromatic Amines and Mycotoxins. IARC; Lyon, France: 1993.
    1. Lee H.J., Ryu D. Significance of ochratoxin A in breakfast cereals from the United States. J. Agric. Food Chem. 2015;63:9404–9409. doi: 10.1021/jf505674v. - DOI - PubMed
    1. Palumbo J.D., O’Keeffe T.L., Ho Y.S., Santillan C.J. Occurrence of ochratoxin A contamination and detection of ochratoxigenic Aspergillus species in retail samples of dried fruits and nuts. J. Food Prot. 2015;78:836–842. doi: 10.4315/0362-028X.JFP-14-471. - DOI - PubMed
    1. Solfrizzo M., Panzarini G., Visconti A. Determination of ochratoxin A in grapes, dried vine fruits, and winery byproducts by high-performance liquid chromatography with fluorometric detection (HPLC−FLD) and immunoaffinity cleanup. J. Agric. Food Chem. 2008;56:11081–11086. doi: 10.1021/jf802380d. - DOI - PubMed
    1. Pfohl-Leszkowicz A., Manderville R.A. Ochratoxin A: An overview on toxicity and carcinogenicity in animals and humans. Mol. Nutr. Food Res. 2007;51:61–99. doi: 10.1002/mnfr.200600137. - DOI - PubMed

Publication types

LinkOut - more resources