. 2022 Jan 10;40(1):36-52.e9.
doi: 10.1016/j.ccell.2021.11.002. Epub 2021 Nov 24.

The allergy mediator histamine confers resistance to immunotherapy in cancer patients via activation of the macrophage histamine receptor H1

Affiliations

The allergy mediator histamine confers resistance to immunotherapy in cancer patients via activation of the macrophage histamine receptor H1

Hongzhong Li et al. Cancer Cell. .

Abstract

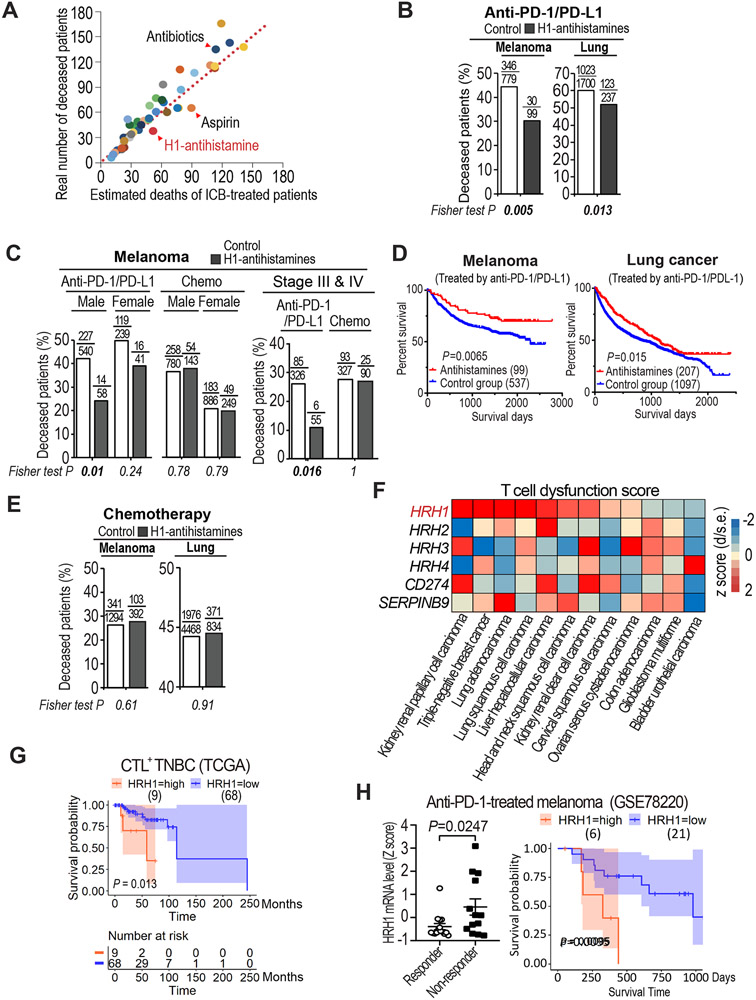
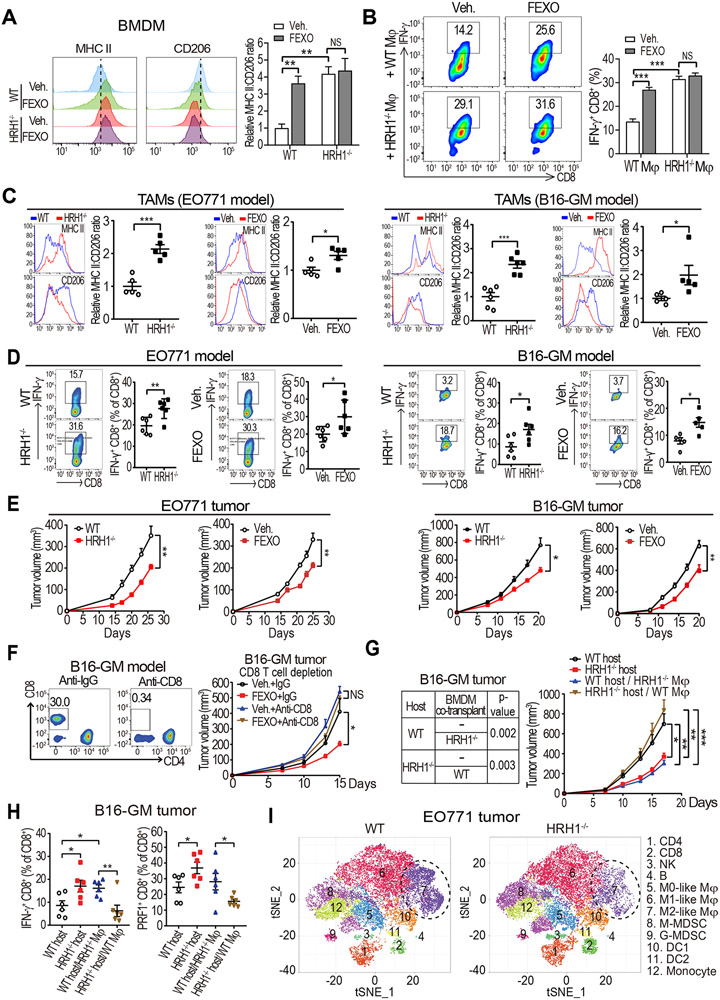
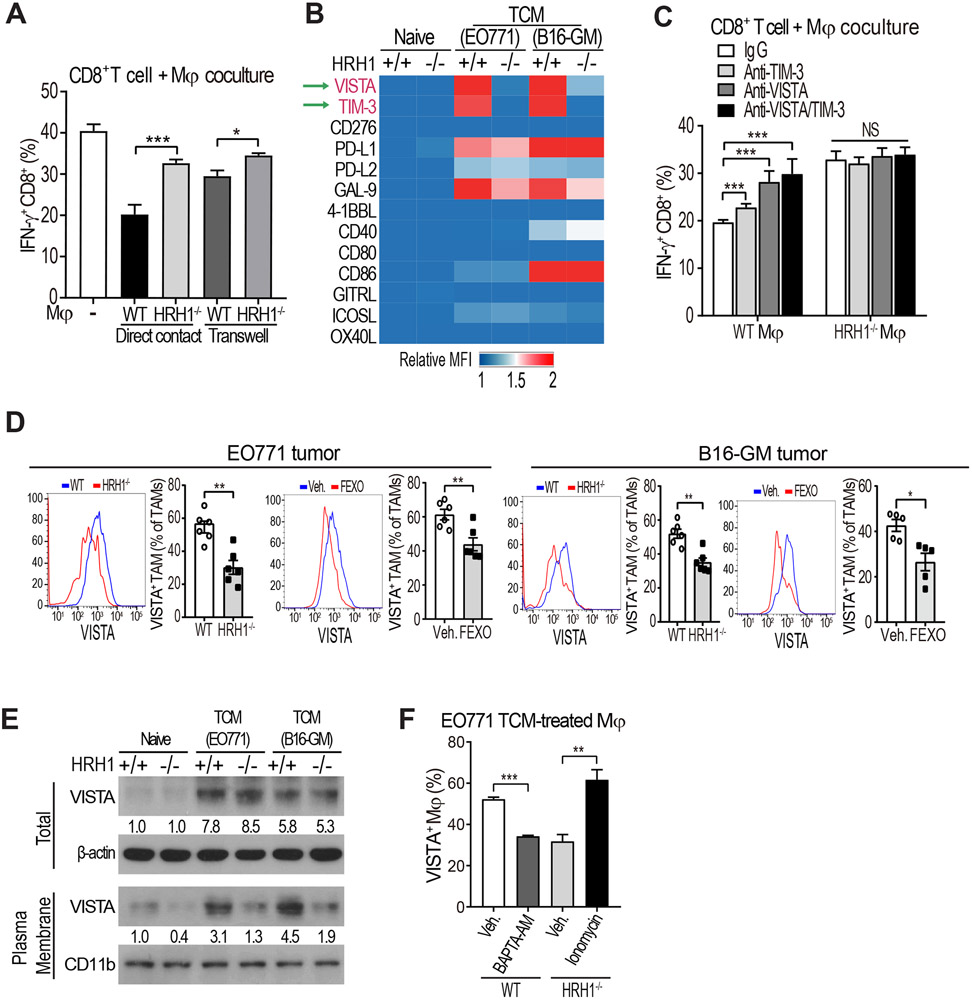
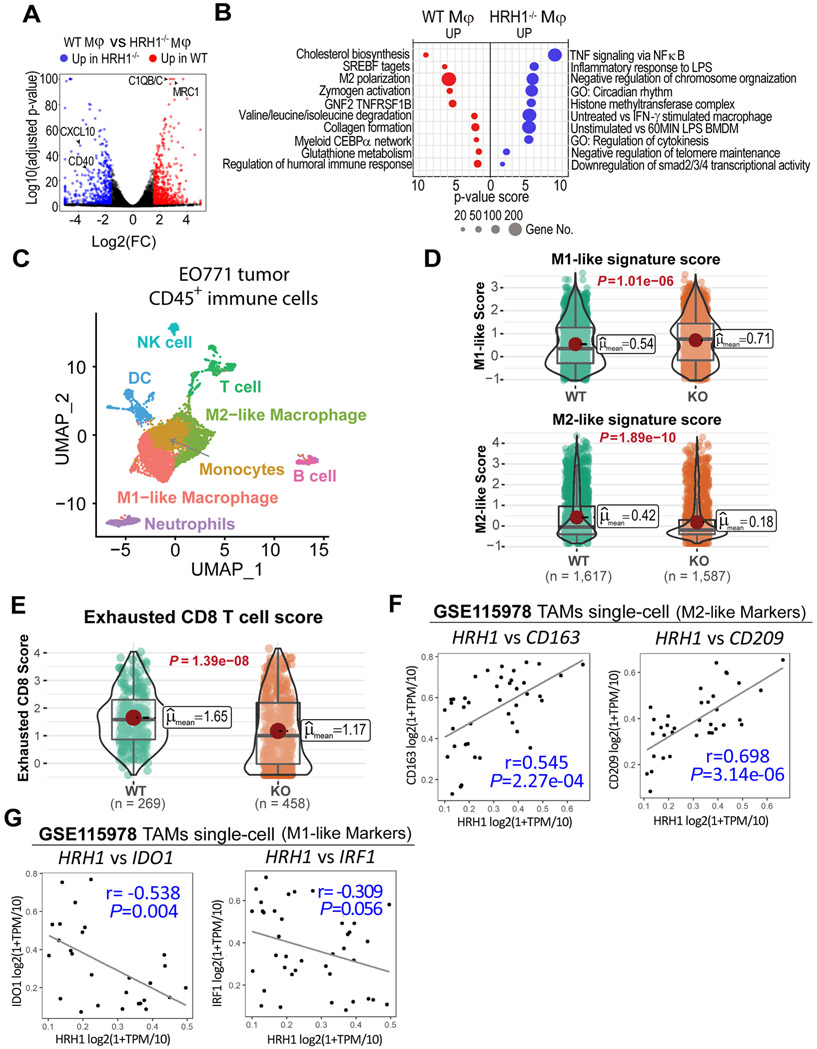
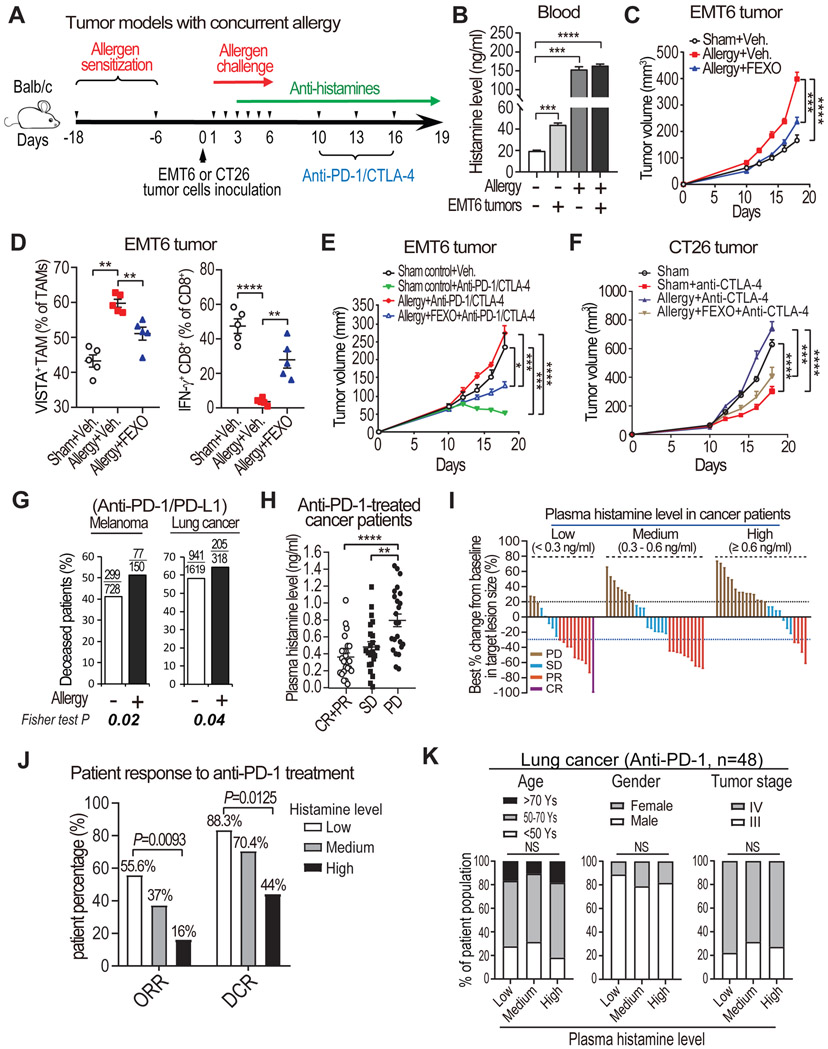
Reinvigoration of antitumor immunity remains an unmet challenge. Our retrospective analyses revealed that cancer patients who took antihistamines during immunotherapy treatment had significantly improved survival. We uncovered that histamine and histamine receptor H1 (HRH1) are frequently increased in the tumor microenvironment and induce T cell dysfunction. Mechanistically, HRH1-activated macrophages polarize toward an M2-like immunosuppressive phenotype with increased expression of the immune checkpoint VISTA, rendering T cells dysfunctional. HRH1 knockout or antihistamine treatment reverted macrophage immunosuppression, revitalized T cell cytotoxic function, and restored immunotherapy response. Allergy, via the histamine-HRH1 axis, facilitated tumor growth and induced immunotherapy resistance in mice and humans. Importantly, cancer patients with low plasma histamine levels had a more than tripled objective response rate to anti-PD-1 treatment compared with patients with high plasma histamine. Altogether, pre-existing allergy or high histamine levels in cancer patients can dampen immunotherapy responses and warrant prospectively exploring antihistamines as adjuvant agents for combinatorial immunotherapy.

Keywords: HRH1; T cell dysfunction; allergy; antihistamine; cancer immunotherapy; histamine; immune evasion; macrophage.


Conflict of interest statement

Declaration of interests The authors declare no competing interests.

Figures

Figure 1.
Figure 1.. Uptake of antihistamines correlated with better survival in ICB-treated patients and HRH1 expression is associated with T cell dysfunction
(A) Scatter plot of the real numbers of deceased melanoma patients who took various commonly-used medicines (40 different drugs as listed in Table S1) during ICB treatment versus their estimated deaths (at 39% death rate based on 336 deceased patients out of total 865 ICB-treated patients at MDACC). Each dot represents a group of patients who took one type of medicine along with ICB. (B) Percentages of deceased cancer patients taking H1-antihistamines during anti-PD-1/PD-L1 treatment versus those did not (Fisher exact test). (C) Percentages of deceased melanoma patients who took H1-antihistamines during anti-PD-1/PD-L1 treatment or chemotherapy compared with sex- or stage-matched melanoma patients who did not. (D) Kaplan-Meier overall survival analysis of cancer patients taking H1-antihistamines during anti-PD-1/PD-L1 treatment versus those who did not. (E) Percentages of deceased cancer patients taking H1-antihistamines during chemotherapy treatment versus those did not (Fisher exact test). (F) T cell dysfunction scores of HRH1-4 in indicated cancer types assessed by TIDE. T cell dysfunction score is defined as the z score of d/standard error (s.e.) following previous publication (Jiang et al., 2018). (G) Kaplan-Meier overall survival analysis for CTL+ TNBC patients based on HRH1 level detected in tumors. The numbers at risk are the stratified HRH1 level high and low patient numbers of those who remained alive and uncensored after a certain time period. (H) HRH1 mRNA expression in pre-treatment tumors of responder (n=15) versus non-responder (n=13) melanoma patients (t-test), and comparison of overall survival of melanoma patients who had high HRH1 vs. low HRH1 expressed in the tumors before anti-PD-1 treatment (GSE78220). Mean±SEM, *P<0.05. See also Figure S1, Tables S1 and S2.
Figure 2.
Figure 2.. Activated histamine-HRH1 axis in tumor microenvironment
(A) Relative HRH1 mRNA levels in immune cell subsets assessed by CIBERSORT. (B) Flow cytometry analysis of HRH1 expression on human peripheral blood monocytes (PBMC) - derived macrophages (n=3, one-way ANOVA). (C) Representative images and quantification of HRH1+ macrophages in human breast tissues (n=9) and TNBC tumors (n=32, t-test). Blue, DAPI; red, CD68; green, HRH1. Scale bar, 25 μm. (D) Percentage of CD68 or CD68+ cells (macrophages) in total HRH1+ cells in human TNBC tissues (n=32, t-test). (E) Flow cytometry analysis of HRH1 expression on mouse bone marrow-derived (BMDM) naïve macrophages (M0) and polarized macrophages (M1 and M2-like) (n=3, one-way ANOVA). (F) Mean florescent intensity (MFI) of HRH1 in indicated cell subsets of mouse mammary tumors (4T1 and EO771). Macrophages, CD45+CD11b+GrlF4/80+; neutrophils, CD45+CD11b+Grl+; lymphocytes, CD45+CD11b. (G) Flow cytometry analysis of HRH1 expression on resident macrophages (nMφ) from mammary fat pad (MFP) of BALB/c mice and TAMs (4T1 and EMT6 tumors) (n=5, one-way ANOVA). (H) Histamine levels in blood plasma from healthy subjects (n=20), patients with TNBC (n=50), colon cancer (n=28) detected by ELISA (one-way ANOVA). (I) Pearson correlation analysis of the relationship between serum histamine level and GZMB+ cell density (%) in cancer tissues from TNBC patients (n=50). Mean ± SEM, **P<0.01, ****P<0.0001. See also Figure S2.
Figure 3.
Figure 3.. Inhibiting HRH1 on macrophages enhances T cell anti-tumor immunity
(A) Flow cytometry analysis of M1-like (MHC II+) versus M2-like (CD206+) populations in bone marrow-derived macrophages (BMDMs) that were generated from wild-type (WT) or HRH1−/− mice and treated with vehicle or fexofenadine (FEXO) (10 μM) in the presence of EO771 tumor cell-conditioned medium (TCM) for 48 hours. (B) Analysis of IFN-γ+CD8+ T cells in splenocytes co-cultured with vehicle- or FEXO (10 μM)-treated WT or HRH1−/− BMDMs (TCM-educated). (C and D) Relative MHC II:CD206 MFI ratios of tumor-associated macrophages (TAMs) (C) and percentage of IFN-γ+CD8+ T cells (D) in EO771 tumors (left) or B16-GM tumors (right) growing in WT versus HRH1−/− mice, and vehicle-treated versus FEXO-treated WT mice (n=5-6, t-test). (E) EO771 (left) and B16-GM (right) tumor growth in WT versus HRH1−/− mice, and vehicle-treated versus FEXO-treated WT mice (n= 5-8 mice/group, two-way ANOVA). (F) B16-GM tumor growth with indicated treatment. CD8+ T cells were depleted by anti-CD8 antibodies (n=6-7 mice/group, two-way ANOVA). (G) Growth of B16-GM tumor cells co-implanted with WT or HRH1−/− BMDMs in HRH1−/− or WT recipient mice, respectively (n=6-9 mice/group, two-way ANOVA). (H) Percentages of IFN-γ+ and PRF1+ CD8+ T cells in primary tumors from WT and HRH1−/− mice transplanted with B16-GM tumor cells alone, or both tumor cells and BMDMs (HRH1−/− or WT respectively) (n=6, one-way ANOVA). (I) t-distributed stochastic neighbor embedding (tSNE) plot of tumor-infiltrating leukocytes overlaid with color-coded clusters in EO771 tumors from WT or HRH1−/− mice. Dotted ellipses highlight clusters with significant differences between two groups. Mean ± SEM, *P<0.05, **P<0.01, ***P<0.001. See also Figures S3, S4 and S5.
Figure 4.
Figure 4.. Histamine-HRH1 activation promotes VISTA membrane localization
(A) Percentages of IFN-γ+ CD8+ T cells co-cultured with EO771 TCM-treated WT or HRH1−/− BMDMs in direct contact or separately in transwells (n=6, t-test). (B) Heat-map depicting relative expression of co-stimulatory/inhibitory molecules on naïve or TCM-treated WT or HRH1−/− BMDMs measured by flow cytometry. The mean fluorescence intensity (MFI) of each molecule was normalized to the MFI of the naïve WT group. (C) Percentages of IFN-γ+ CD8+ T cells co-cultured with EO771 TCM-treated WT or HRH1−/− BMDMs pretreated with IgG, anti-TIM-3 (10 μg/ml) and/or anti-VISTA (10 μg/ml) antibodies (n=3-4, one-way ANOVA). (D) Flow cytometry analysis of VISTA+ TAMs (CD45+ CD11b+ F4/80+) from EO771 and B16-GM tumors growing in WT versus HRH1−/− mice, and vehicle-treated versus FEXO-treated WT mice (n=5-6, t-test). (E) Western blot analysis of total VISTA and membrane VISTA expression on naïve or TCM-treated WT or HRH1−/− BMDMs. β-actin and CD11b were used as loading controls. (F) Percentages of VISTA+ BMDMs after treatment with 10 μM BAPTA-AM (an intracellular calcium chelator) or 1 μg/ml ionomycin-Ca2+ (n=3, t-test). All in vitro experiments were performed at least twice. Mean ± SEM, *P<0.05, **P<0.01, ***P<0.001, NS: not significant. See also Figure S6.
Figure 5.
Figure 5.. HRH1 knockout reshapes the transcriptomic landscape of macrophages
(A) Volcano plots of log2 fold change (FC) and log10 adjusted P -value of differentially expressed genes between TCM-treated WT and HRH1−/− macrophages. Red dots: genes up-regulated in WT macrophages; Blue dots: genes up-regulated in HRH1−/− macrophages. (B) The pathway enrichment map of differentially expressed genes between WT and HRH1−/− macrophages. (C) Dimensionality reduction by UMAP using all the single cells reveals the fine structure of CD45+ immune cells in mice. Manually inspected automatic annotation of cell identities are labeled in colors as their corresponding cell populations. (D) Violin plot showing the expression-based score of M1-like (top) and M2-like macrophage (bottom), with their mean scores and P values labeled. The horizontal lines represent 25th percentile, median and 75th percentile of the scores. Significance levels are computed using the nonparametric Games-Howell Post-Hoc Test. (E) Violin plot showing the expression-based score of exhausted CD8 T cells with their mean scores and P values labeled. Significance levels are computed using the nonparametric Games-Howell Post-Hoc Test. (F) Scatter-plot results from the Pearson's correlation analysis of HRH1 and M2-like macrophage markers CD163 (left) and CD209 (right) at single-cell level in TAMs of human melanomas (GSE115978). (G) Scatter-plot results from the Pearson's correlation analysis of HRH1 and M1-like macrophage markers IDO1 (left) and IRF1 (right) at single-cell level in TAMs of human melanomas (GSE115978). See also Figure S6.
Figure 6.
Figure 6.. HRH1 inhibition enhances ICB therapeutic efficacy
(A) EO771 tumor growth and survival analysis of vehicle- or FEXO-treated WT and PD-L1−/− mice. n=15-23 mice/group for tumor volume analysis, n=9 mice/group for survival analysis, two-way ANOVA for tumor volume comparison, log-rank test for survival comparison. (B) Flow cytometry analysis of VISTA+ TAMs and IFN-γ+ CD8+ T cells in EO771 tumors collected from WT and HRH1−/− mice receiving IgG or anti-PD-1 antibody treatment (n=6, one-way ANOVA). (C) Primary tumor growth (left) and survival analysis (right) of CT26 tumor-bearing WT mice treated with FEXO alone, anti-CTLA-4 alone, or FEXO+anti-CTLA-4. n=9-10 mice/group for tumor volume and survival analysis. (D and E) Tumor growth (D) and survival analysis (E) of B16-GM tumor-bearing WT mice with the indicated treatment (n=6-10 mice/group). (F) Flow cytometry analysis of VISTA+ TAMs and IFN-γ+ CD8+ T cells in primary tumor tissues from B16-GM-bearing mice treated with indicated regimens (n=5, one-way ANOVA). (G) Flow cytometry analysis of MHCII:CD206 ratios of TAMs and IFN-γ+ CD8+ T cells in B16-GM primary tumor tissues from mice treated with indicated regimens (n=6, one-way ANOVA). Mean ± SEM, two-way ANOVA for tumor volume comparison, log-rank test for survival comparison. *P<0.05, **P<0.01, ***P<0.001, ****P<0.0001. See also Figure S7.
Figure 7.
Figure 7.. HRH1 blockade rescues allergy-induced immunotherapy resistance
(A) Experimental schematics of EMT6 tumor model with concurrent allergy. (B) Serum histamine levels detected by ELISA in age-matched healthy mice, allergic mice, and tumor-bearing mice (10 days after EMT6 tumor cell inoculation) with or without induced allergy (n=6, t-test). (C) EMT6 tumor growth in sham control group, allergy group, and allergy plus FEXO treatment group (n=6 mice per group). (D) Flow cytometry analysis of VISTA+ TAMs and IFN-γ+ CD8+ T cells in EMT6 tumor tissues from sham control group, allergy induction group, and allergy plus FEXO treatment group (n=5, one-way ANOVA). (E) EMT6 tumor growth in mice with or without concurrent allergic disease, treated with vehicle, ICB, or ICB+FEXO (n=6 mice per group). (F) CT26 tumor growth in mice with or without concurrent allergic disease, treated with indicated therapies (n=7 mice per group). (G) Comparison of deceased patient percentages according to patient allergy status before receiving anti-PD-1/PD-L1 treatment in melanoma and lung cancer patients. (H) Comparison of plasma histamine levels in pre-treatment blood collected from cancer patient groups with different responses to anti-PD-1 treatment (one-way ANOVA). CR: complete response (100% remission), PR: partial response (≥30% remission), SD: stable disease (<30% remission to <20% increase of tumor size), PD: progressive disease (≥20% increase). (I) A waterfall plot depicting the responses to anti-PD-1 treatment in cancer patients with low levels (<0.3 ng/ml), medium levels (>0.3 ng/ml to <0.6 ng/ml), and high levels (>0.6 ng/ml) of plasma histamine. (J) Assessment of the objective response rate (ORR) and disease control rate (DCR) among cancer patients with different plasma histamine levels (low, medium, and high) (Fisher exact test). (K) The distributions of age, sex, and tumor stage among anti-PD-1 treated lung cancer patients (n=48) with indicated histamine level (Fisher exact test). Mean ± SEM, two-way ANOVA for tumor volume comparison. *P<0.05, **P<0.01, ***P<0.001, ****P<0.0001, NS, no significant. See also Figure S7 and Tables S3-S6.

Comment in

References

    1. Alquicira-Hernandez J, Sathe A, Ji HP, Nguyen Q, and Powell JE (2019). scPred: accurate supervised method for cell-type classification from single-cell RNA-seq data. Genome Biol 20, 264. - PMC - PubMed
    1. Ashina K, Tsubosaka Y, Nakamura T, Omori K, Kobayashi K, Hori M, Ozaki H, and Murata T (2015). Histamine Induces Vascular Hyperpermeability by Increasing Blood Flow and Endothelial Barrier Disruption In Vivo. PLoS One 10, e0132367. - PMC - PubMed
    1. Blando J, Sharma A, Higa MG, Zhao H, Vence L, Yadav SS, Kim J, Sepulveda AM, Sharp M, Maitra A, et al. (2019). Comparison of immune infiltrates in melanoma and pancreatic cancer highlights VISTA as a potential target in pancreatic cancer. Proc Natl Acad Sci U S A 116, 1692–1697. - PMC - PubMed
    1. Chen L, Gibbons DL, Goswami S, Cortez MA, Ahn YH, Byers LA, Zhang X, Yi X, Dwyer D, Lin W, et al. (2014). Metastasis is regulated via microRNA-200/ZEB1 axis control of tumour cell PD-L1 expression and intratumoral immunosuppression. Nat Commun 5, 5241. - PMC - PubMed
    1. De Henau O, Rausch M, Winkler D, Campesato LF, Liu C, Cymerman DH, Budhu S, Ghosh A, Pink M, Tchaicha J, et al. (2016). Overcoming resistance to checkpoint blockade therapy by targeting PI3Kgamma in myeloid cells. Nature 539, 443–447. - PMC - PubMed

Publication types

MeSH terms