. 2021 Dec 8;29(12):1788-1801.e6.
doi: 10.1016/j.chom.2021.11.005. Epub 2021 Nov 13.

Nucleocapsid mutations R203K/G204R increase the infectivity, fitness, and virulence of SARS-CoV-2

Affiliations

Nucleocapsid mutations R203K/G204R increase the infectivity, fitness, and virulence of SARS-CoV-2

Haibo Wu et al. Cell Host Microbe. .

Abstract

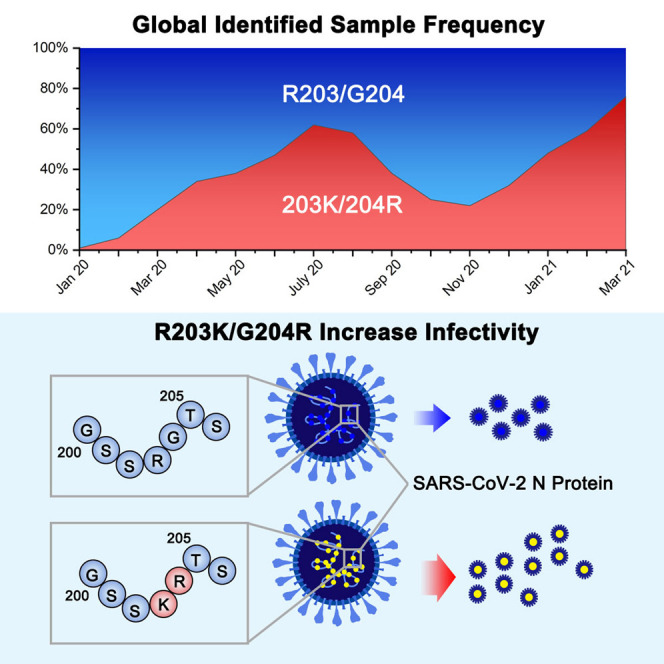
Previous work found that the co-occurring mutations R203K/G204R on the SARS-CoV-2 nucleocapsid (N) protein are increasing in frequency among emerging variants of concern or interest. Through a combination of in silico analyses, this study demonstrates that R203K/G204R are adaptive, while large-scale phylogenetic analyses indicate that R203K/G204R associate with the emergence of the high-transmissibility SARS-CoV-2 lineage B.1.1.7. Competition experiments suggest that the 203K/204R variants possess a replication advantage over the preceding R203/G204 variants, possibly related to ribonucleocapsid (RNP) assembly. Moreover, the 203K/204R virus shows increased infectivity in human lung cells and hamsters. Accordingly, we observe a positive association between increased COVID-19 severity and sample frequency of 203K/204R. Our work suggests that the 203K/204R mutations contribute to the increased transmission and virulence of select SARS-CoV-2 variants. In addition to mutations in the spike protein, mutations in the nucleocapsid protein are important for viral spreading during the pandemic.

Keywords: COVID-19; R203K/G204R; SARS-CoV-2; fatality; fitness; infectivity; mutation; nucleocapsid; virulence.


Conflict of interest statement

Declaration of interests The authors declare no competing interests.

Figures

None
Graphical abstract
Figure 1
Figure 1
Graphical overview of virology experiments to evaluate the impact of the R203K/G204R mutations on the infectivity and fitness of SARS-CoV-2 The study showed that the R203K/G204R substitutions result in increased virus infectivity and fitness in lung epithelial cells (A), a human airway tissue culture model (B), and the hamster upper airway (C). In addition, 203K/204R showed higher susceptibility when analyzed against serum samples from R203/G204 virus-infected hamsters (D).
Figure 2
Figure 2
Rapid spread of R203K/G204R (A) Heatmap showing global IF changes represented by a continuous color gradient from white (0%) to red (100%). Y represents LGs/mutations with an IF > 10% in one month. (B) Global IF tracks of the top three mutants (614G, 510Y and 203K/204R) with the highest IFs recorded to date. The time intervals in which the IFs of 203K/204R increased (I1), decreased (D), and increased for the second time (I2) are annotated at the top. (C) IF changes in different countries over months. The continents of the countries are differentiated by color. An orange dotted line connecting the medians by month was drawn to make the trends discernible. More detailed information is shown in Figure S3 and in the folder “IF in Countries” in Data S1. (D) IFs of 203K/204R (orange) and R203K/G204 (gray) among continents.
Figure 3
Figure 3
IF changes and the phylogenetic distribution of 8 lineages Changes in the IF of 8 lineages including A222V (LG_4), N510Y (LG_5), and R203K/G204R (LG_3) and the distribution of lineages in the phylogenetic tree of all strains (H). A to F are the percentage (IF) accumulated area maps of lineages worldwide and in five countries. In B to F, the IFs determined from an insufficient sample size (< 200) are not shown. Lineages are differentiated by color. The legend describing the lineages is in the center. The third column of the legend highlights the mutations carried by each lineage. “Original” denotes the coexistence of the original allele (A222, N501, and R203/G204). In (A) and (B), Fisher’s exact tests were performed on the fractions of three pairs of lineages in the beginning and end months of the three time intervals, respectively (ANR versus ANK in I1, ANK versus VNR in D, and VNR versus AYR in I2). In (C) to (E), similar statistics were performed on the fractions of ANR and ANK in the beginning and the end of the months bracketed. In (E), Fisher’s exact test was performed for ANR+ANK versus AYR in the beginning and the end of the months bracketed. In (G), there are exemplary sub-figures showing the fitted trend of the fraction change of ANK in ANR+ANK in multiple geographic levels. The time interval is I1. The red folded line is the maximum likelihood estimate with a non-decreasing constraint. The dot size represents the number of sequences on that day. In (H), arrows point to the possible positions of the arising of ANK (blue arrows) and AYK (green arrows).
Figure 4
Figure 4
Evidence showing the adaptation of R203K/G204R (A) Comparison of the CLR m/t per month in the UK between R203/G204 (red) and 203K/204R variants (dark blue). An orange dotted line denotes the top 5% CLR cutoff. (B) A sliding window view showing a CLR peak exceeding the threshold (orange dotted line). This plot is a detailed view of the positive CLR m/t in July in the UK, as shown in (A). CLR’ is a transformed CLR value (CLR’ = CLR/t). The transformation is to diminish the background difference effects. (C) Comparison of the growth rates simulated in the logistic growth model between R203/G204 (red) and 203K/204R viruses (blue). (D) Fitted curves of the growth rates from the phylodynamic susceptible-exposed-infectious-recovered (SEIR) model. Only genetic data are used. (E and F) Hamsters were inoculated with a 1:1 mixture of the R203/G204 and 203K/204R viruses (104 PFU each). Nasal washes, trachea and lungs were collected on days 4 (E) and 7 (F) after infection. The relative amounts of R203/G204 and 203K/204R RNA were assessed by RT-PCR and Sanger sequencing. Log10 scale is used for the y axis. Data are presented as the mean ± SEM. Dots represent individual hamsters (n = 6). (E) and (F) show that the 203K/204R virus is dominant to the R203/G204 virus in hamsters. (G–I) Competition assay. Mixtures of R203/G204 and 203K/204R viruses with initial ratios of 1:1 (G), 3:1 (H), or 9:1 (I) were inoculated into human airway tissue cultures at a total MOI of 5. Virus ratios after competition were measured by RT-PCR and Sanger sequencing. Log10 scale is used for the y axis. All data are represented as the mean ± SEM. Dots represent individual hamsters (n = 6). p < 0.05, ∗∗p < 0.01. Abbreviation: n.s., nonsignificant.
Figure 5
Figure 5
Effects of 203K/204R on viral replication and infectivity (A–F) Viral replication and viral sgRNA of R203/G204 and 203K/204R viruses produced from Vero E6 (A–C) and Calu-3 (D–F) cell cultures. Cells were infected at a MOI of 0.01. Genomic RNA levels (A) and (D) and infectious viral titers (B) and (E) in the culture medium were determined by plaque assays and qRT-PCR, respectively. The E sgRNA loads (C) and (F) were performed to indicate virion infectivity. Data are represented as mean ± SEM. p < 0.05, ∗∗p < 0.01. (G–I) Viral replication and viral sgRNA of R203/G204 and 203K/204R viruses. R203/G204 and 203K/204R viruses were inoculated into primary human airway tissues at an MOI of 5. After incubation for 2 h, the cultures were washed with PBS and maintained for 5 days. Genomic RNA levels (G) and infectious viral titers (H) in the culture medium were determined by plaque assays and qRT-PCR, respectively. The E sgRNA loads (I) were calculated to indicate virion infectivity. (G–I) show that the R203K/G204R substitutions enhance SARS-CoV-2 replication in primary human airway tissues. (J–M) Infectivity of R203/G204 and 203K/204R viruses produced in hamsters. Three- to four-week-old hamsters were infected intranasally with 2 × 104 PFU of the R203/G204 or 203K/204R virus or PBS (mock). All data came from a single experiment. Weight loss (J) was monitored for 7 dpi. Data are presented as mean ± SEM; n = 12 (all cohorts) at days 0–4; n = 6 (all cohorts) at days 5–7. Weight loss was analyzed by two-factor analysis of variance (ANOVA) with Tukey’s post hoc test. Amounts of viral genomes (K) and infectious titers (L) were quantified in nasal wash, trachea, and lung samples on the 4th dpi. Dots represent individual hamsters (n = 6). The E sgRNA loads (M) at 4 dpi were calculated as a measurement of infectivity. Dots represent individual hamsters (n = 6). Data are presented as the mean ± SEM. ∗∗p < 0.01.
Figure 6
Figure 6
Effects of R203K/G204R on the severity of disease (A and B) Severity of infections caused by R203/G204 and 203K/204R. Haemotoxylin and eosin (H&E) staining of lung sections from R203/G204 and 203K/204R virus-infected hamsters collected at 4 dpi. The lower photographs are higher magnification images of the regions denoted by rectangles in the upper photographs. The upper panel shows inflammatory damage with blood vessel congestion. The lower panel shows bronchioles with aggregation of inflammatory cells (arrow) and surrounding alveolar wall infiltration (arrowhead). Scale bar, 100 μm. (C) Histopathology score of lung sections. Lung lobes were scored individually using the following scoring system: 0, no pathological change; 1, affected area (£10%); 2, affected area (> 10% and £30%); 3, affected area (> 30% and £50%); and 4, affected area (> 50%). We obtained 5 slices from each hamster and the scores of lung slices were added to determine the total pathology score per animal. Dots represent individual hamsters (n = 6). (D–G) Prediction of the clinical outcomes of ANR (R203/G204) and ANK (203K/204R). Four pairs of colors denote four pairs of opposite patient statuses. Collection sites are listed at the top of the figures. The y axis shows the ratios between lineages with opposite patient statuses. Lineage numbers are provided. We tested the significance of the change in the ratio by the chi-square test. (H–J) Correlation analysis results between mutant IFs and CFRs. (H) Correlation analysis between the ratios of mutants (x axis) and the median CFRs of COVID-19 among months and in different countries (y axis). The p value was calculated using Spearman’s test. (I) Scatter map showing the distribution of the IF-CFR correlations (y axis) and the p values (x axis) in different countries. A vertical orange dotted line denotes the 0.05 p value cutoff. (J) A specific example showing the correlation of mutant IFs and CFRs in a single country, Italy. Continuously changing colors denote the months of the IF-CFR pairs.
Figure 7
Figure 7
Tentative model of the SARS-CoV-2 nucleocapsid (A) Docking of the crystal structures of the SARS-CoV-2 nucleocapsid protein NTD monomer (PDB ID: 6M3M) and CTD dimer (PDB ID: 6WZQ) into the 3D density map of the MHV nucleocapsid. The NTD is colored red. The CTD dimer is colored green. The inferred linker region is highlighted in blue. The theoretical pI of each region is shown in (B). The electrostatic surface potential corresponding to (A) is shown in (C). (D) Four nucleocapsid protein dimer packages in an asymmetrical unit of the nucleocapsid. CTD dimers are colored blue, yellow, magenta, and green, respectively. A density map of one asymmetry subunit is shown as a gray, semitransparent surface with the corresponding fitted ribbon models colored green (CTDs) and red (NTDs). The NTDs of the other three nucleocapsid protein dimers are colored gray. Based on the model proposed in (C) and (D), we built a tentative model of the nucleocapsid (E). In (D) and (E), the positively charged region on the surface is colored blue, as shown in the scale bar, −10 to 10 kcal/(mol·e-). The possible RNA binding grooves are indicated by orange lines.

References

    1. Balaban M., Moshiri N., Mai U., Jia X., Mirarab S. TreeCluster: Clustering biological sequences using phylogenetic trees. PLoS ONE. 2019;14:e0221068. - PMC - PubMed
    1. Biswas S.K., Mudi S.R. Spike protein D614G and RdRp P323L: the SARS-CoV-2 mutations associated with severity of COVID-19. Genomics Inform. 2020;18:e44. - PMC - PubMed
    1. Bouckaert R., Vaughan T.G., Barido-Sottani J., Duchêne S., Fourment M., Gavryushkina A., Heled J., Jones G., Kühnert D., De Maio N., et al. BEAST 2.5: An advanced software platform for Bayesian evolutionary analysis. PLoS Comput. Biol. 2019;15:e1006650. - PMC - PubMed
    1. C Caserta L., Mitchell P.K., Plocharczyk E., Diel D.G. Identification of a SARS-CoV-2 Lineage B1.1.7 Virus in New York following Return Travel from the United Kingdom. Microbiol Resour Announc. 2021;10:e00097-e21. - PMC - PubMed
    1. Castel G., Razzauti M., Jousselin E., Kergoat G.J., Cosson J.F. Changes in diversification patterns and signatures of selection during the evolution of murinae-associated hantaviruses. Viruses. 2014;6:1112–1134. - PMC - PubMed

Publication types

MeSH terms

Substances

Supplementary concepts