. 2022;13(3):759-788.
doi: 10.1016/j.jcmgh.2021.11.007. Epub 2021 Nov 23.

TM6SF2/PNPLA3/MBOAT7 Loss-of-Function Genetic Variants Impact on NAFLD Development and Progression Both in Patients and in In Vitro Models

Affiliations

TM6SF2/PNPLA3/MBOAT7 Loss-of-Function Genetic Variants Impact on NAFLD Development and Progression Both in Patients and in In Vitro Models

Miriam Longo et al. Cell Mol Gastroenterol Hepatol. 2022.

Abstract

Background & aims: The I148M Patatin-like Phospholipase Domain-containing 3 (PNPLA3), the rs641738 in the Membrane bound O-acyltransferase domain containing 7-transmembrane channel-like 4 (MBOAT7-TMC4) locus, and the E167K Transmembrane 6 Superfamily Member 2 (TM6SF2) polymorphisms represent the main predisposing factors to nonalcoholic fatty liver disease (NAFLD) development and progression. We previously generated a full knockout of MBOAT7 in HepG2 cells (MBOAT7-/-), homozygous for I148M PNPLA3. Therefore, we aimed to investigate the synergic impact of the 3 at-risk variants on liver injury and hepatocellular carcinoma (HCC) in a large cohort of NAFLD patients, and create in vitro models of genetic NAFLD by silencing TM6SF2 in both HepG2 and MBOAT7-/- cells.

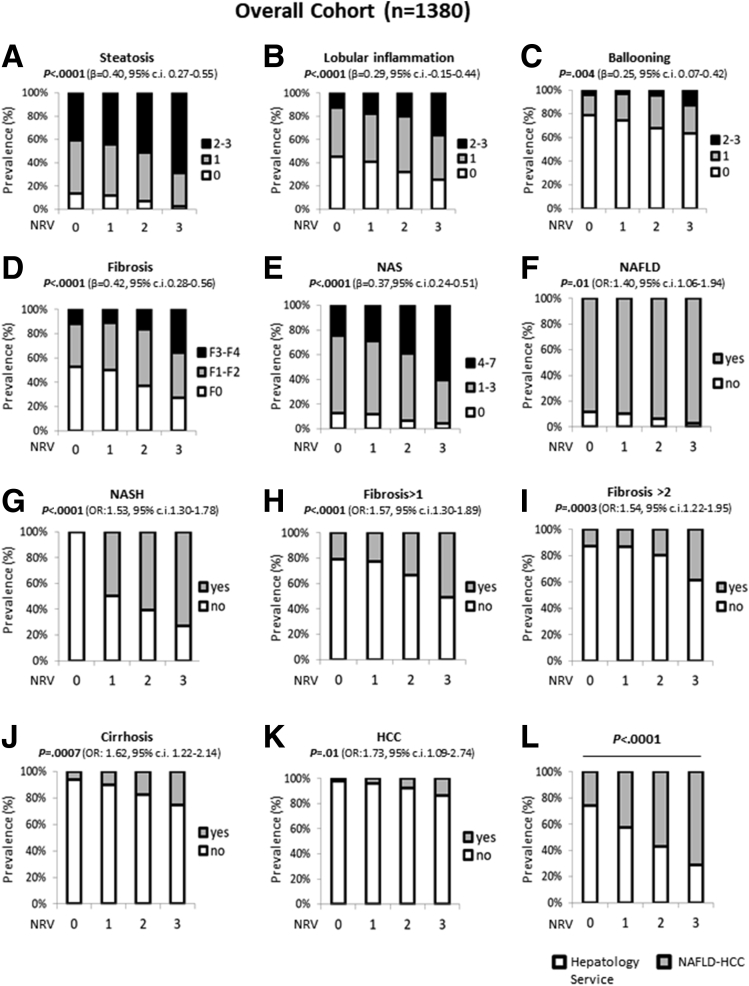
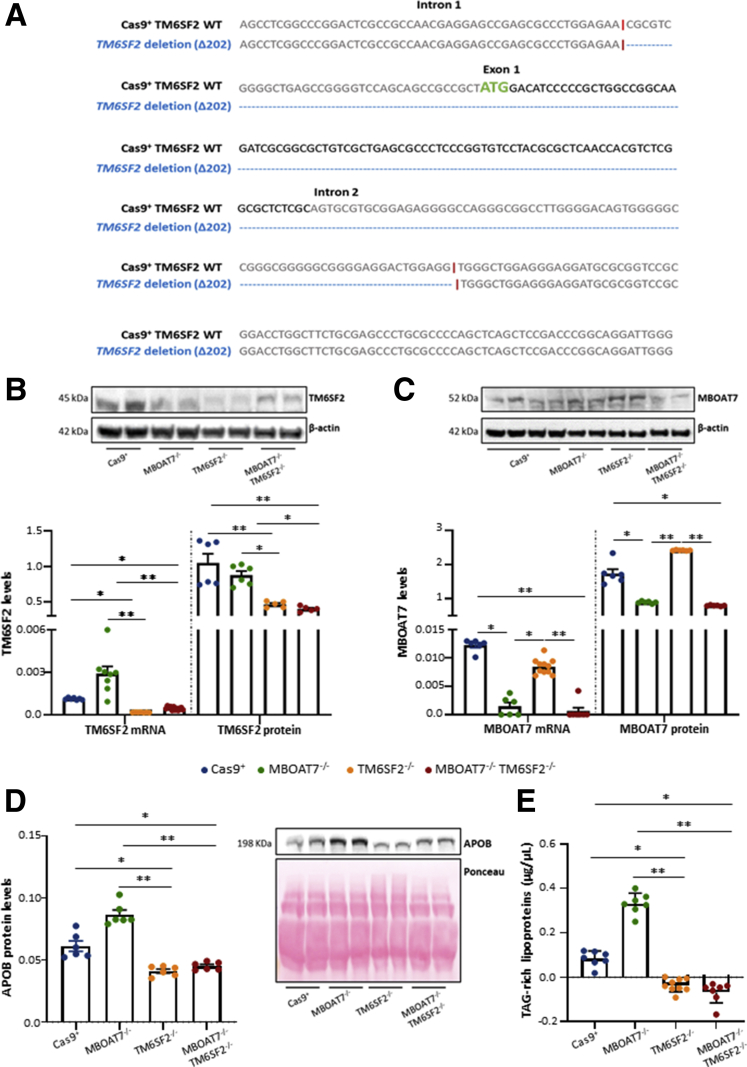
Methods: NAFLD patients (n = 1380), of whom 121 had HCC, were stratified with a semiquantitative score ranging from 0 to 3 according to the number of PNPLA3, TM6SF2, and MBOAT7 at-risk variants. TM6SF2 was silenced in HepG2 (TM6SF2-/-) and MBOAT7-/- (MBOAT7-/-TM6SF2-/-) through Clustered regularly interspaced short palindromic repeats and CRISPR-associated protein 9 (CRISPR/Cas9).

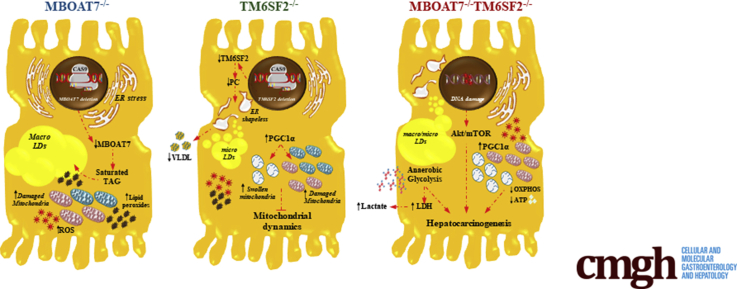
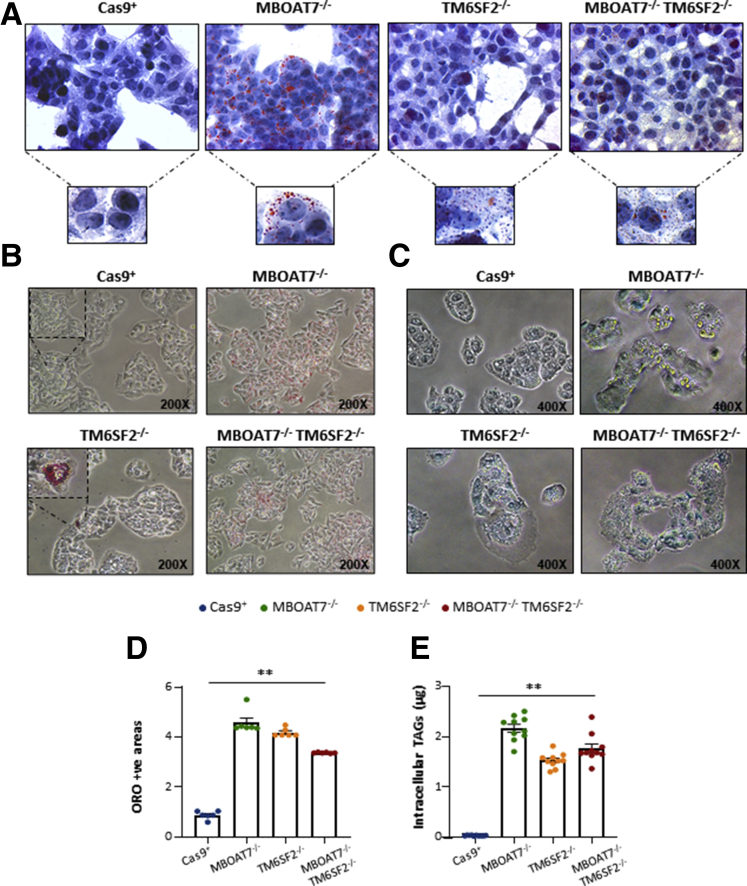
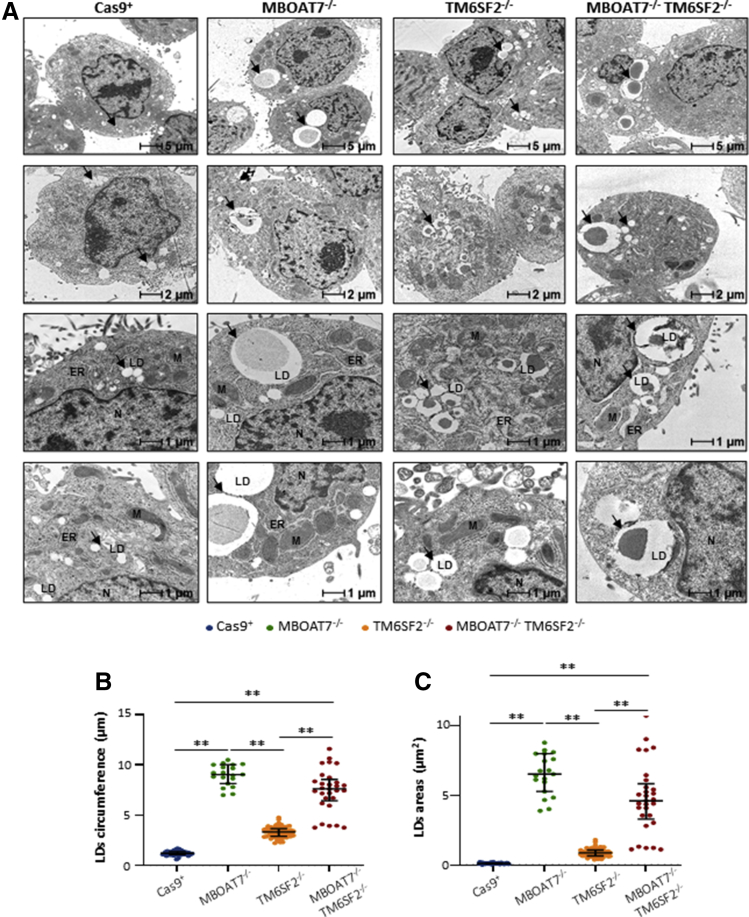
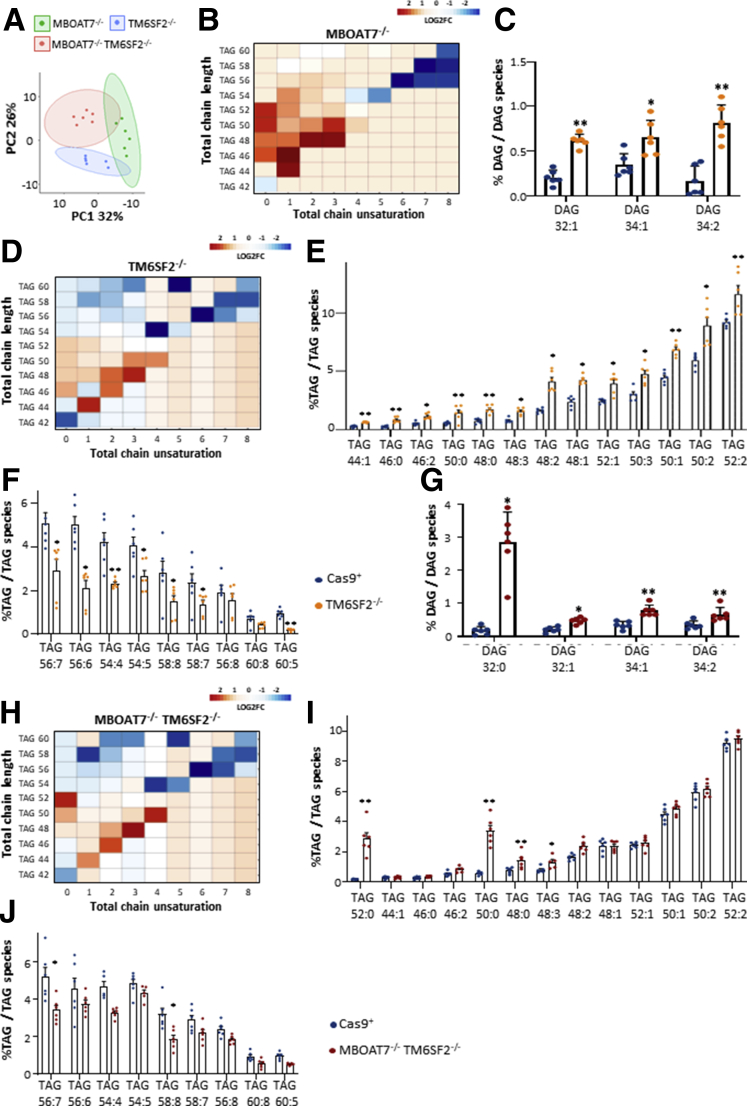
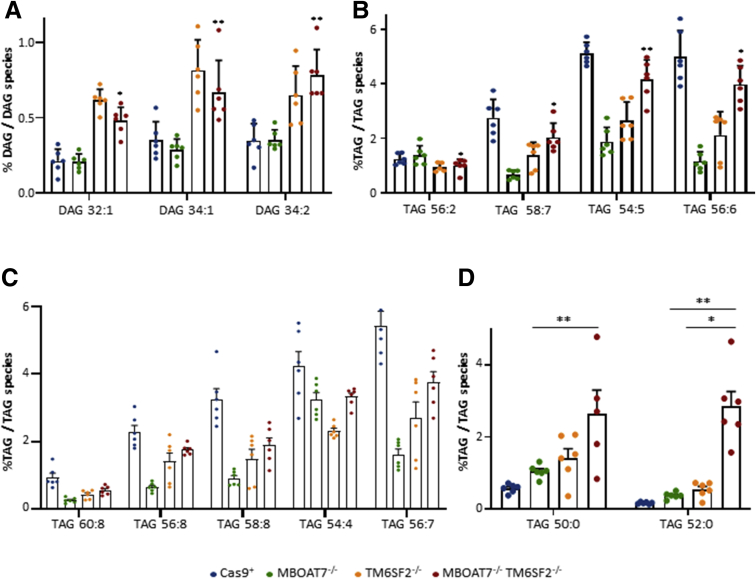
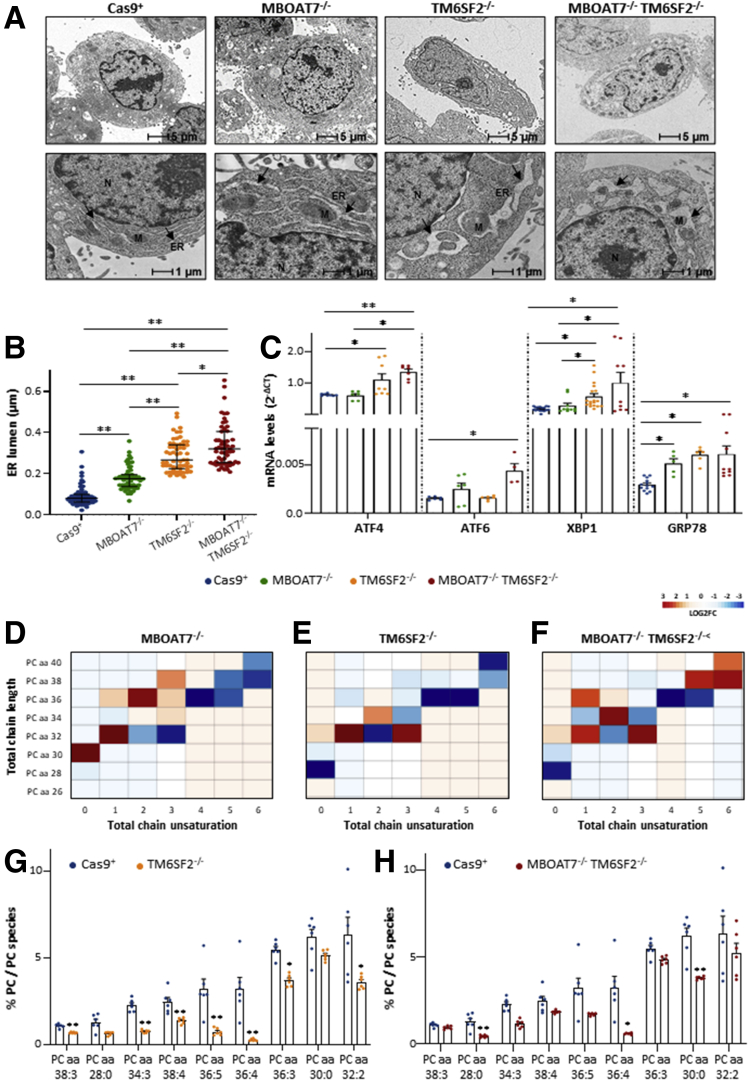
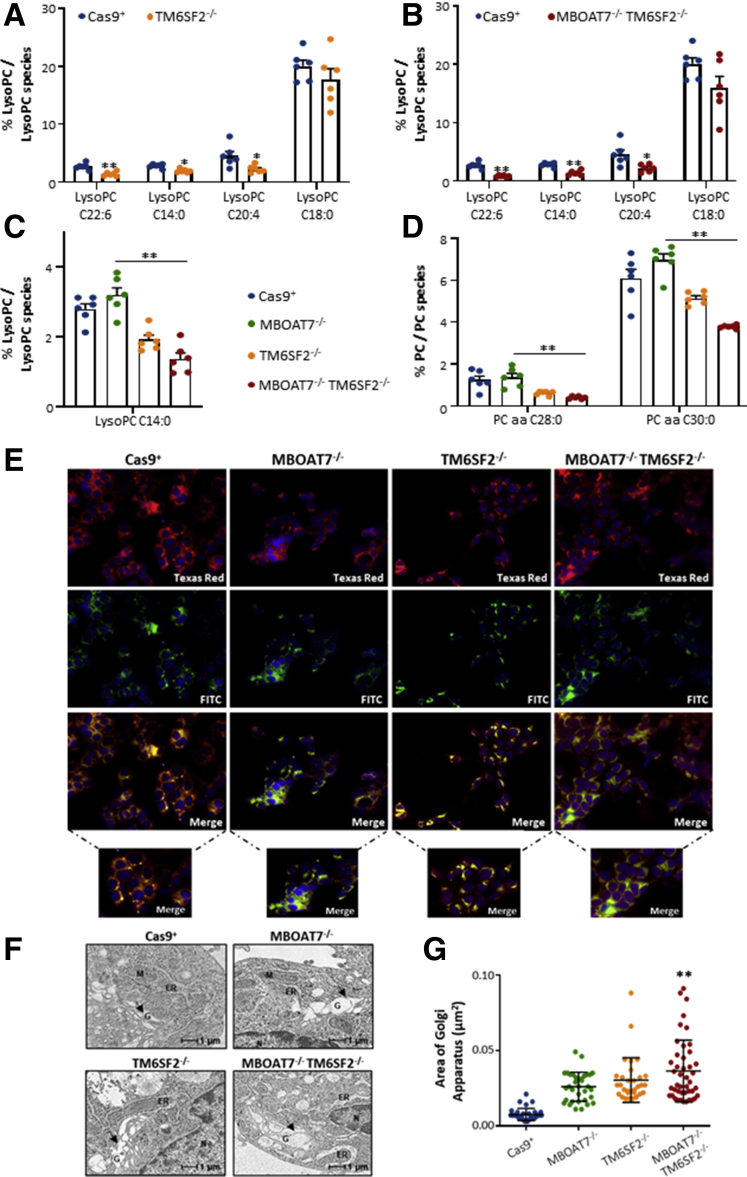
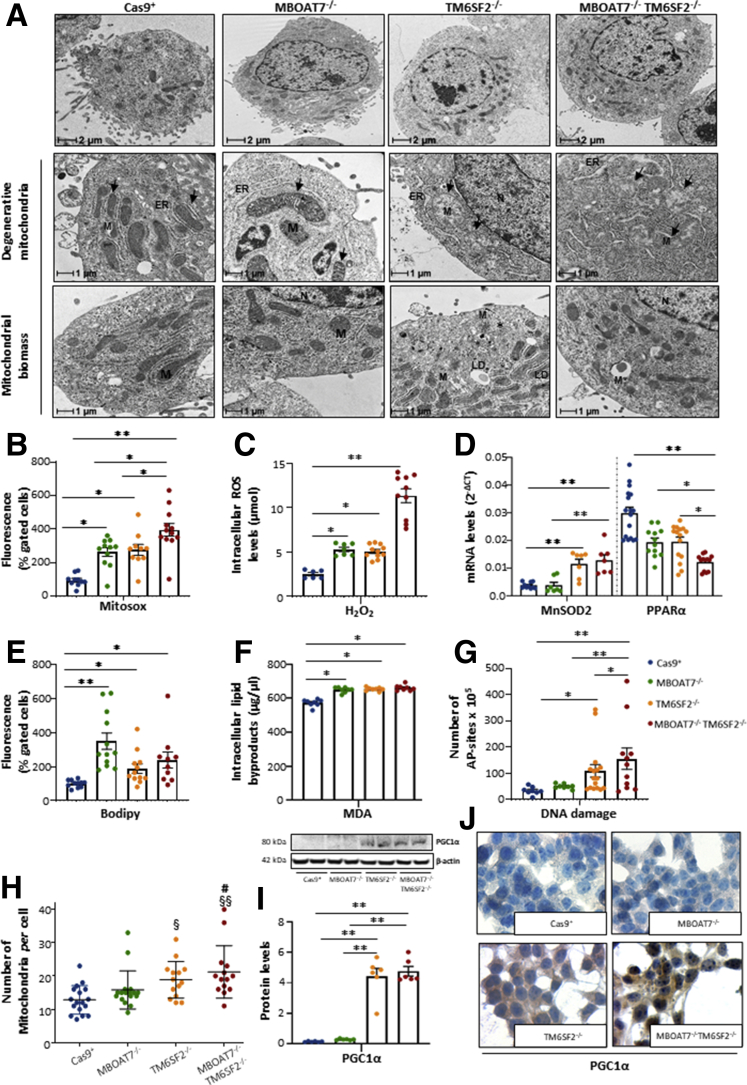
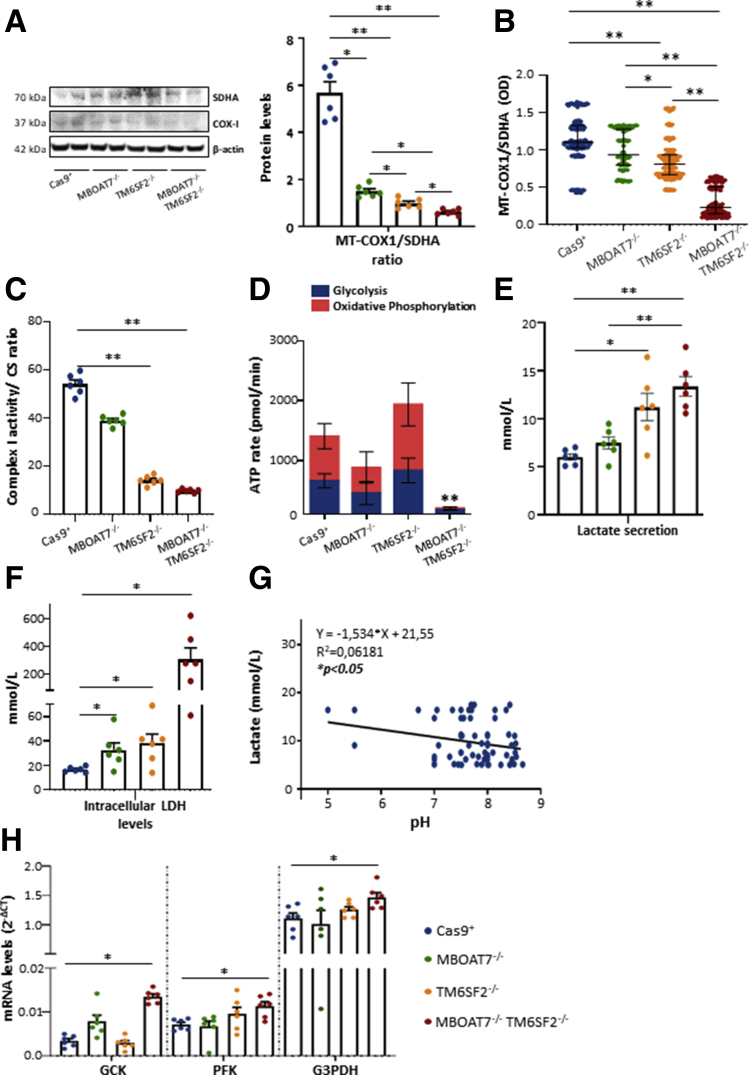
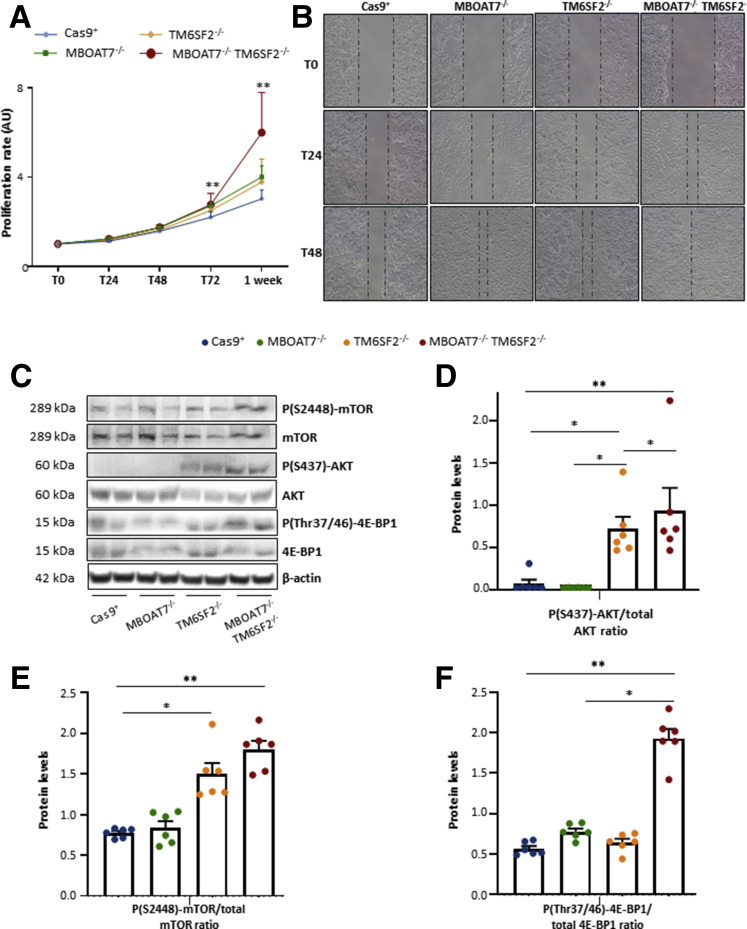
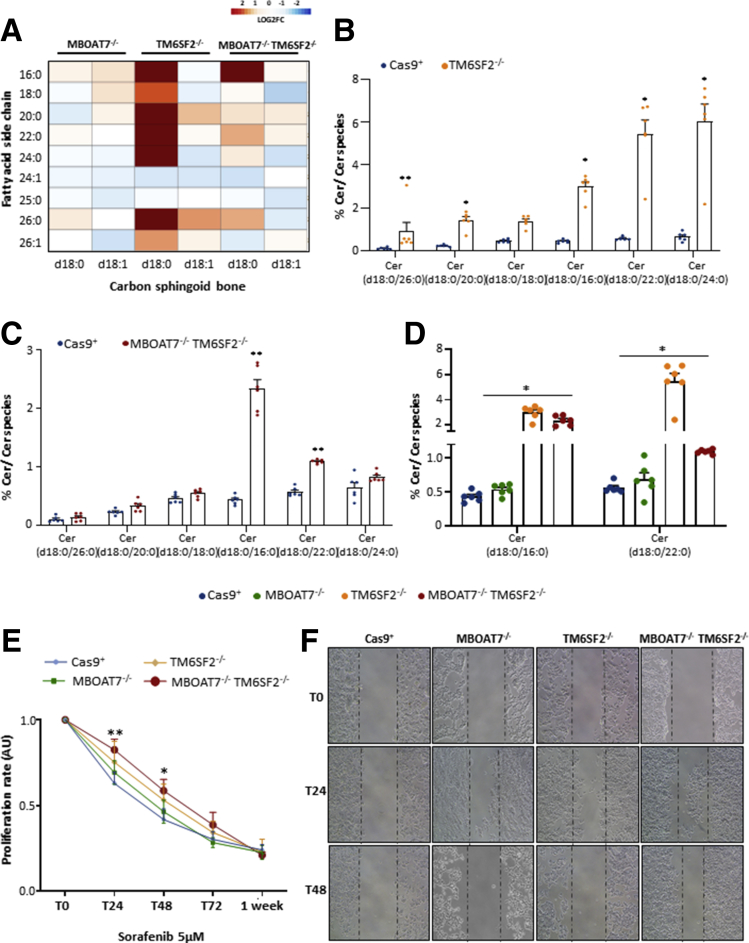
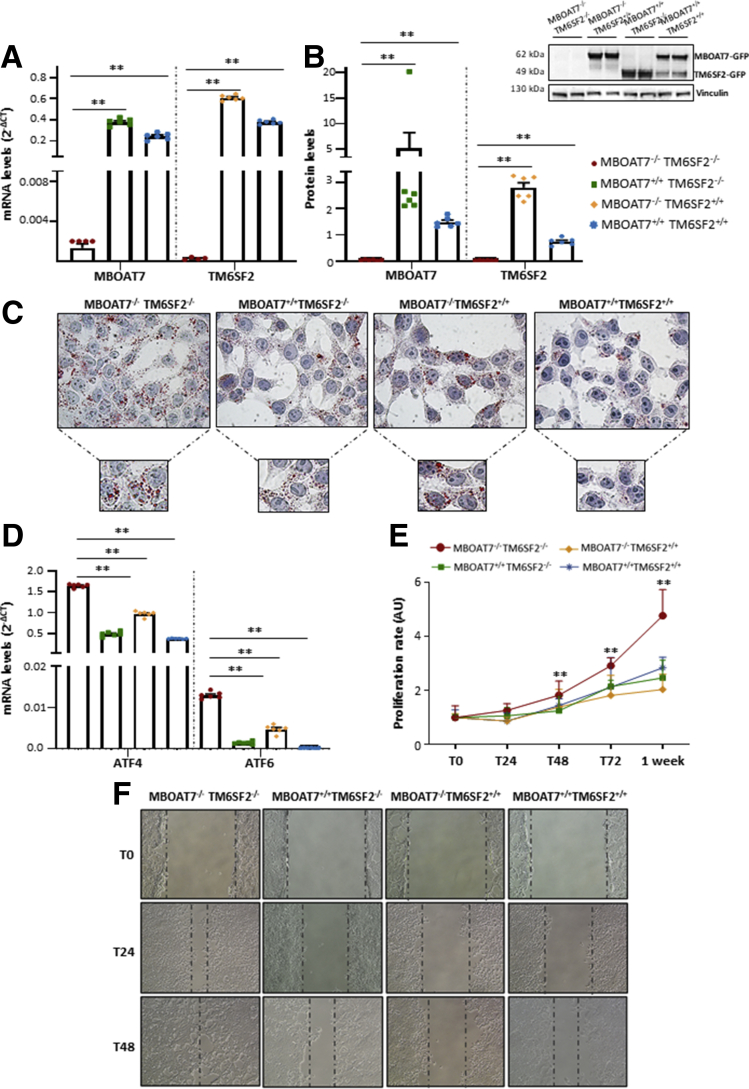
Results: In NAFLD patients, the additive weight of these mutations was associated with liver disease severity and an increased risk of developing HCC. In HepG2 cells, TM6SF2 silencing altered lipid composition and induced the accumulation of microvesicular lipid droplets (LDs), whereas the MBOAT7-/-TM6SF2-/- cells showed a mixed microvesicular/macrovesicular pattern of LDs. TM6SF2 deletion strongly affected endoplasmic reticulum and mitochondria ultrastructures, thus increasing endoplasmic reticulum/oxidative stress. The mitochondrial number was increased in both TM6SF2-/- and MBOAT7-/-TM6SF2-/- models, suggesting an unbalancing in mitochondrial dynamics, and the silencing of both MBOAT7 and TM6SF2 impaired mitochondrial activity with a shift toward anaerobic glycolysis. MBOAT7-/-TM6SF2-/- cells also showed the highest proliferation rate. Finally, the re-overexpression of MBOAT7 and/or TM6SF2 reversed the metabolic and tumorigenic features observed in the compound knockout model.

Conclusions: The co-presence of the 3 at-risk variants impacts the NAFLD course in both patients and experimental models, affecting LD accumulation, mitochondrial functionality, and metabolic reprogramming toward HCC.

Keywords: ER Stress; HCC; Mitochondrial Dynamics; NAFLD; TM6SF2.


Figures

None
Graphical abstract
Figure 1
Figure 1
The co-presence of the PNPLA3 rs738409, MBOAT 7 rs641738, and TM6SF2 rs58542926 variants correlated with NAFLD severity and HCC risk. (A–E) At ordinal regression analysis adjusted for age, sex, BMI, and T2D, the co-presence of I148M PNPLA3, MBOAT7 rs641738, and E167K TM6SF2 SNPs was associated with steatosis, lobular inflammation, ballooning, fibrosis, and NAFLD activity score (NAS). (F–I) At nominal logistic regression analysis adjusted for age, sex, BMI, and T2D, the co-presence of 3 SNPs increased the risk of developing NAFLD, NASH, fibrosis score > 1, and fibrosis score > 2. (J and K) The increasing number of at-risk variants correlated with cirrhosis at nominal logistic regression analysis adjusted for age, sex, BMI, and T2D and with HCC after further adjustment for the presence of fibrosis. (L) The co-presence of the 3 SNPs was enriched significantly in the NAFLD-HCC cohort vs the Hepatology Service cohort (P < .0001). 0, indicates the absence of risk variants; 1–3 indicate the total number of risk variants (NRVs) carried.
Figure 2
Figure 2
CRISPR/Cas9-mediated TM6SF2 ablation in HepG2 cells. (A) Schematic representation of the TM6SF2 sequence (gene ID: 53345; referred to as transcript variant 1: NM_001001524.3) highlighted the same clonal Cas9-induced indel mutations in both TM6SF2-/- and MBOAT7-/-TM6SF2-/- clones (blue) of 202 nucleotides (Δ202). The Cas9 cutting site is indicated by the symbol “|” (red), and the transcription start site (ATG) of the protein coding sequence (NP_001001524.2) is shown in green. (B) mRNA and protein expression of TM6SF2 was evaluated through reverse-transcription quantitative PCR and Western blot, respectively. TM6SF2 reduction was detected in TM6SF2-/- and MBOAT7-/-TM6SF2-/- cells. (C) MBOAT7 mRNA and protein levels were lower in MBOAT7-/- and MBOAT7-/-TM6SF2-/- cells compared with Cas9+ and TM6SF2-/- cells. (D) ApoB protein was assessed in cell supernatants by Western blot and normalized to the entire lane of the Ponceau stain. Either TM6SF2-/- or MBOAT7-/-TM6SF2-/- showed low ApoB levels. (E) TAG-rich lipoprotein secretion was measured in cell supernatants and normalized to levels of total cholesterol by using the Cholesterol Colorimetric Assay Kit–HDL and LDL/VLDL (Abcam). Both TM6SF2-/- and MBOAT7-/-TM6SF2-/- dampened TAG-rich lipoprotein release. Data were normalized to the β-actin housekeeping gene for reverse-transcription quantitative PCR and Western blot and they are expressed as means and SE. At least 3 independent experiments were conducted. Adjusted ∗P < .05 and ∗∗P < .01 vs Cas9+ and/or vs MBOAT7-/-. WT, wild-type.
Figure 3
Figure 3
TM6SF2 deletion induced spontaneous LD accumulation. (A and B) Spontaneous development of LDs in TM6SF2-/- and MBOAT7-/-TM6SF2-/- cells assessed by ORO staining (magnification, 630× and 200×, respectively). (C) Alkaline phosphatase (ALP) stained the LD surface in MBOAT7-/-, TM6SF2-/-, and MBOAT7-/-TM6SF2-/- clones, highlighting in yellow the differences in LD size for each condition. (D) ORO positive (+ve) areas were quantified by ImageJ in 10 random nonoverlapping micrographs per condition by calculating the percentage of pixels above the threshold value in respect to total pixels per area. (E) Measurement of TAG content in cell lysates. Data are expressed as means and SE. At least 3 independent experiments were conducted. Adjusted ∗∗P < .01 vs Cas9+.
Figure 4
Figure 4
TM6SF2 deficiency promotes small LD budding in hepatocytes. (A) Representative TEM images of LDs obtained by ultrathin 70-nm sections of hepatocytes. Black arrows indicate LDs. (B and C) The average of LDs’ circumference and area was calculated from 10 random non-overlapping micrographs (scalebar: 1 μm) by ImageJ. At least 3 independent experiments were conducted. Data are expressed as median and interquartile range. Adjusted ∗P < .05 and ∗∗P < .01 vs Cas9+, vs MBOAT7-/-, and vs TM6SF2-/-. ER, endoplasmic reticulum; M, mitochondria; N, nucleus.
Figure 5
Figure 5
The impact of TM6SF2 deletion on LD composition. (A) PCA of the lipidomic profile of MBOAT7-/-, TM6SF2-/-, and MBOAT7-/-TM6SF2-/- models. (B) Heatmap of TAG species was generated by calculating the log2 fold change (log2FC) ratio between MBOAT7-/-/Cas9+ quantification. (C) Relatively enriched DAGs in TM6SF2-/- vs Cas9+. (D) Heatmaps of TAGs were generated by calculating the log2FC ratio between TM6SF2-/-/Cas9+. (E and F) Relative abundance of saturated/monounsaturated and polyunsaturated TAGs in TM6SF2-/- vs Cas9+. (G) Enrichment of DAG species in MBOAT7-/-TM6SF2-/- cells compared with Cas9+ cells. (H) Heatmaps of TAGs were generated by calculating the log2FC ratio between MBOAT7-/-TM6SF2-/-/Cas9+ quantification. (I and J) Relative abundance of saturated/monounsaturated and polyunsaturated TAGs in MBOAT7-/-TM6SF2-/- cells vs Cas9+. For heatmaps, red and blue boxes indicate overexpression or repression, respectively. For bar graphs, data are expressed as the percentage means and SE of DAG or TAG species compared with the total DAGs or TAGs. Adjusted ∗P < .05 or ∗∗P < .01 vs Cas9+.
Figure 6
Figure 6
The contribution of TM6SF2 or MBOAT7 deletion on lipid composition in the compound knockout model. (A) Relative enriched DAGs in MBOAT7-/-TM6SF2-/- cells compared with MBOAT7-/-. (B–D) Relative abundance of saturated/monounsaturated and polyunsaturated TAGs in MBOAT7-/-TM6SF2-/- cells vs MBOAT7-/- and TM6SF2-/-. Data are expressed as the percentage means and SE of DAG or TAG species compared with the total DAGs or TAGs. Adjusted ∗P < .05 or ∗∗P < .01 vs MBOAT7-/- or TM6SF2-/-.
Figure 7
Figure 7
TM6SF2 silencing affects ER stress, morphology, and ER membrane fluidity. (A) Representative TEM images of ER cisternae obtained by ultrathin 70-nm sections of hepatocytes. Black arrows indicate ER tubules. (B) ER width was obtained by taking at least 3 measurements per ER lumen (n = 15 nonoverlapping micrographs for each condition, scalebar: 1 μm). (C) The expression of ATF4/6, XBP1 GRP78 was evaluated by reverse-transcription quantitative PCR and normalized to the β-actin housekeeping gene. (D–F) Heatmaps of PCs were generated by calculating the log2 fold change ratio between MBOAT7-/-/Cas9+, TM6SF2-/-/Cas9+, and MBOAT7-/-TM6SF2-/-/Cas9+ quantification. Red and blue boxes indicate overexpression or repression, respectively. (G and H) Relative enriched PCs in TM6SF2-/- and MBOAT7-/-TM6SF2-/- cells vs control. For reverse-transcription quantitative PCR, data are expressed as means and SE. For lipidomic analysis, data are expressed as the percentage means of PC species and SE compared with the total PC species. At least 3 independent experiments were conducted. Adjusted ∗P < .05 or ∗∗P < .01 vs Cas9+ and/or vs MBOAT7-/-. M, mitochondria; N, nucleus.
Figure 8
Figure 8
Changes in ER–Golgi morphology upon MBOAT7 and/or TM6SF2 silencing. (A and B) Relative enrichment of lyso-PCs in TM6SF2-/- and MBOAT7-/-TM6SF2-/- cells vs Cas9+. (C and D) Relative enrichment of lyso-PC and PC species in MBOAT7-/-TM6SF2-/- cells vs MBOAT7-/-. (E) Representative cyto-staining of ER (Texas Red, red) and Golgi (fluorescein isothiocyanate [FITC], green) structures showing differences in ER–Golgi bodies (orange-yellow) in MBOAT7-/-, TM6SF2-/-, and MBOAT7-/-TM6SF2-/- models. Nuclei were stained with 4′,6-diamidino-2-phenylindole (DAPI) (blue). (F) Representative TEM images of Golgi architecture obtained by ultrathin 70-nm sections of hepatocytes. Black arrows indicate Golgi (G) compartments. (G) The area of Golgi bodies was obtained by taking at least 3 measurements per Golgi lumen and compared with Cas9+ Golgi width (n = 10 nonoverlapping micrographs for each condition, scalebar: 1 μm). For lipidomic analysis, data are expressed as the percentage means of lyso-PC or PC species and SE compared with the total lyso-PC or PC species. Data are expressed as median and interquartile range for Golgi area. Adjusted ∗P < .05 or ∗∗P < .01 vs Cas9+ and/or vs MBOAT7-/-. M, mitochondria; N, nucleus.
Figure 9
Figure 9
Alterations of mitochondrial degeneration and renewal in TM6SF2 knockout models. (A) Representative TEM images of degenerative mitochondria (M) and mitochondrial biomass obtained by ultrathin 70-nm sections of hepatocytes are indicated by black arrows. (B) ROS content was measured in live cells through MitoSOX Red reagent. (C) The H2O2 levels were measured in cell lysates through DCF ROS/RNS Colorimetric Assay Kit (Abcam). (D) The MnSOD2 and PPARα mRNA expression was assessed by reverse-transcription quantitative PCR and normalized to the β-actin housekeeping gene. (E) Lipid peroxides were quantified in live cells by BODIPY 581/591 C11. (F) The malondialdehyde (MDA) secretion was colorimetrically measured in cell supernatants following the manufacturer’s instructions. (G) Number of apurinic/apyrimidinic (AP) sites was obtained by isolating total DNA from each model. (H) The number of mitochondria per cell was counted from 15 random nonoverlapping micrographs (§P < .05 and §§P < .01 vs Cas9+; #P < .05 vs MBOAT7-/-; scalebar: 2 μm). (I) PGC1α protein levels were assessed by Western blot and normalized to β-actin. (J) Cytoplasmatic and nuclear localization of PGC1α protein was assessed in in vitro models. For the box plot, data are expressed as means and SE. Adjusted ∗P < .05 and ∗∗P < .01 vs Cas9+ and/or vs MBOAT7-/-.
Figure 10
Figure 10
TM6SF2 silencing affectsoxydative phopshorylation (OXPHOS)and when combined with MBOAT7 deletion switches up to metabolic reprogramming. (A) MT-COX1 levels were evaluated by Western blot and normalized to SDHA. (B) MT-COX1 protein expression was measured by enzyme-linked immunosorbent assay (λ = 600 nm) and normalized to SDHA levels (λ = 405 nm). (C) Complex I enzymatic activity was evaluated biochemically and normalized to citrate synthase (CS). (D) The total ATP rate was obtained by Seahorse XF Analyzers in live cells. (E and F) Biochemical measurements of lactate (mmol/L) and LDH (mmol/L) were assessed in cell supernatants and lysates, respectively. (G) Inverse correlation between secreted lactate levels and pH values. (H) The mRNA levels of Glucokinase (GCK), Phosphofructokinase (PFK), and Glyceraldehyde-3-phosphate dehydrogenase (G3PDH) were evaluated by reverse-transcription quantitative PCR and normalized to the β-actin housekeeping gene. At least 3 independent experiments were conducted. For the box plot, data are expressed as means and SE. Adjusted ∗P < .05 and ∗∗P < .01 vs Cas9+ and/or vs MBOAT7-/-.
Figure 11
Figure 11
TM6SF2lackingpromotes cell survival and carcinogenesis. (A) Cell growth was assessed through MTS assay for 24, 48, 72 hours and 1 week (λ = 490 nm). Data are expressed as fold increase vs control. (B) Representative images of wound healing assay were acquired at 0, 24, 48 hours (magnification, 100×). The dotted lines indicate the scratch width. (C) Phosphorylation of Akt at serine 437 residue (P[S437]-Akt), mTOR at serine 2448 residue (p[S2448]-mTOR), phosphorylation of 4E-BP1 at threonine 37/46 residues P[Thr37/46]-4E-BP1, and total Akt, mTOR, and 4E-BP1 were evaluated by Western blot. (D–F) Quantification of P(S437)-Akt/total Akt, p(S2448)-mTOR/total mTOR, and P(Thr37/46)-4E-BP1/total 4E-BP1 ratios were measured through ImageJ software and normalized to the β-actin housekeeping gene. At least 3 independent experiments were conducted. For bar graphs, data are expressed as means and SE. Adjusted ∗P < .05 and ∗∗P < .01 vs Cas9+ and/or vs MBOAT7-/-. AU, arbitrary unit.
Figure 12
Figure 12
TM6SF2 silencing dramatically increases dihydroceramides and confers sorafenib resistance. (A) Heatmap of dihydro-Cers was generated by calculating the log2 fold change (log2FC) ratio between MBOAT7-/-/Cas9+, TM6SF2-/-/Cas9+, and MBOAT7-/-TM6SF2-/-/Cas9+ quantification. Red and blue boxes indicate overexpression or repression, respectively. (B and C) Relative abundance of dihydro-Cers in TM6SF2-/- and MBOAT7-/-TM6SF2-/- cells vs Cas9+. (D) Relative abundance of dihydro-Cers in MBOAT7-/-TM6SF2-/- cells vs MBOAT7-/-. (E) Cells were exposed to sorafenib (5 μmol/L) and cell growth was monitored through MTS assay for 0, 24, 48, 72 hours and 1 week. MBOAT7-/-TM6SF2-/- cells showed a significant resistance to sorafenib cytotoxicity at 24 and 48 hours. MTS absorbance (λ = 490 nm) was recorded at 0, 24, 48, 72 hours and 1 week. (F) Representative images of wound healing assay were acquired at 0, 24 and 48 hours (magnification, 100×) upon sorafenib (5 μmol/L) administration. The dotted lines indicate the scratch width. At least 3 independent experiments were conducted. For lipidomic analysis, data are expressed as the percentage means of dihydro-Cer species and SE compared with the total Cer species. For bar graphs, data are expressed as means and SE. Adjusted ∗P < .05 and ∗∗P < .01 vs Cas9+ or vs MBOAT7-/-. AU, arbitrary unit.
Figure 13
Figure 13
Recovery of metabolic and carcinogenic anomalies upon MBOAT7 and/or TM6SF2 overexpression. (A and B) The mRNA expression of MBOAT7 and TM6SF2 was evaluated by reverse-transcription quantitative PCR and normalized to the β-actin housekeeping gene. The protein levels of MBOAT7 and TM6SF2 tagged with GFP (MBOAT7-GFP and TM6SF2-GFP) were assessed by Western blot and normalized to the vinculin housekeeping gene. (C) LD accumulation was assessed in MBOAT7-/-TM6SF2-/-, MBOAT7+/+TM6SF2-/-, MBOAT7-/-TM6SF2+/+, and MBOAT7+/+TM6SF2+/+ by ORO staining (magnification, 630×). (D) The expression of ATF4 and ATF6 was evaluated by reverse-transcription quantitative PCR and normalized to the β-actin housekeeping gene. (E) The proliferation rate was examined through MTS assay for 0, 24, 48, 72 hours and 1 week (λ = 490 nm). (F) Representative images of wound healing assay were acquired at 0, 24 and 48 hours (magnification, 100×). The dotted lines indicate the scratch width. At least 3 independent experiments were conducted. For bar graphs, data are expressed as means and SE. Adjusted ∗P < .05 and ∗∗P < .01 vs MBOAT7-/-TM6SF2-/-.

References

    1. Younossi Z.M. Non-alcoholic fatty liver disease - a global public health perspective. J Hepatol. 2019;70:531–544. - PubMed
    1. Day C.P. From fat to inflammation. Gastroenterology. 2006;130:207–210. - PubMed
    1. Byrne C.D., Targher G. NAFLD: a multisystem disease. J Hepatol. 2015;62(Suppl):S47–S64. - PubMed
    1. Dongiovanni P., Romeo S., Valenti L. Genetic factors in the pathogenesis of nonalcoholic fatty liver and steatohepatitis. Biomed Res Int. 2015;2015:460190. - PMC - PubMed
    1. Kozlitina J., Smagris E., Stender S., Nordestgaard B.G., Zhou H.H., Tybjaerg-Hansen A., Vogt T.F., Hobbs H.H., Cohen J.C. Exome-wide association study identifies a TM6SF2 variant that confers susceptibility to nonalcoholic fatty liver disease. Nat Genet. 2014;46:352–356. - PMC - PubMed

Publication types

MeSH terms