. 2022 Feb;602(7896):300-306.
doi: 10.1038/s41586-021-04266-9. Epub 2021 Nov 25.

Enhanced fusogenicity and pathogenicity of SARS-CoV-2 Delta P681R mutation

Collaborators, Affiliations

Enhanced fusogenicity and pathogenicity of SARS-CoV-2 Delta P681R mutation

Akatsuki Saito et al. Nature. 2022 Feb.

Abstract

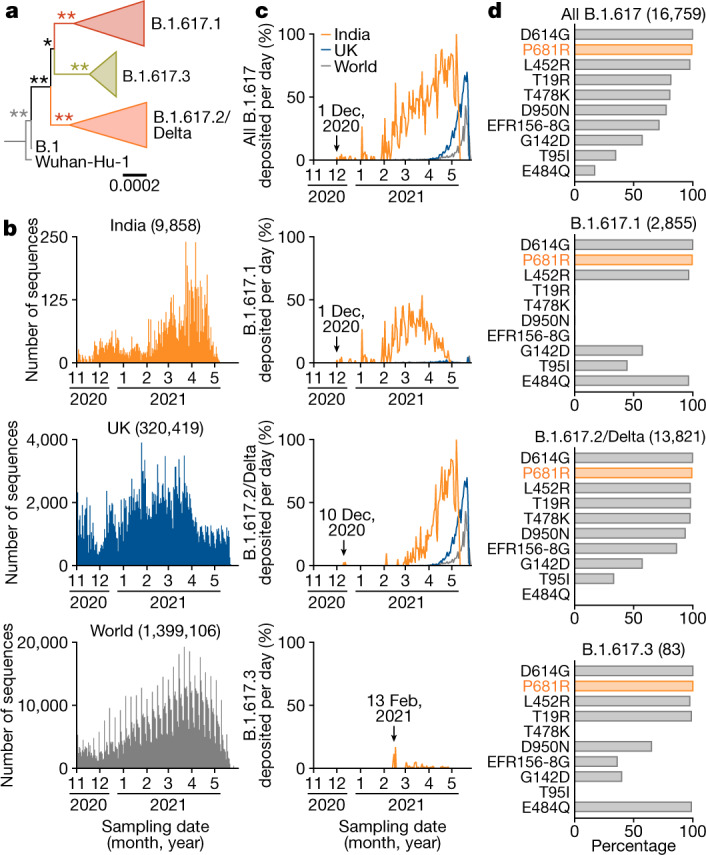
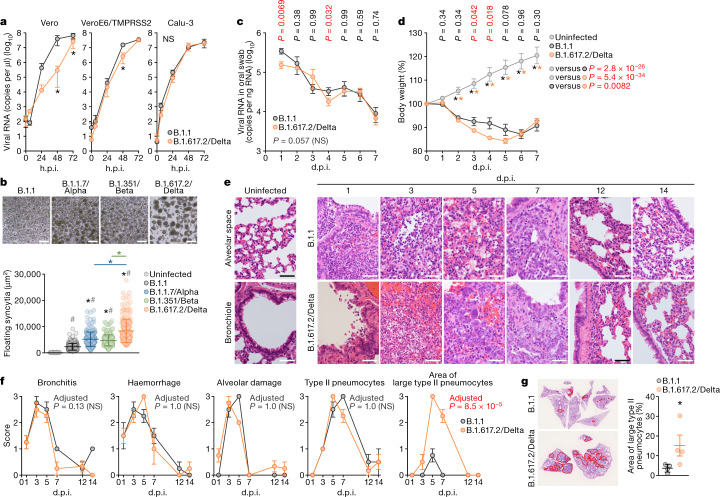
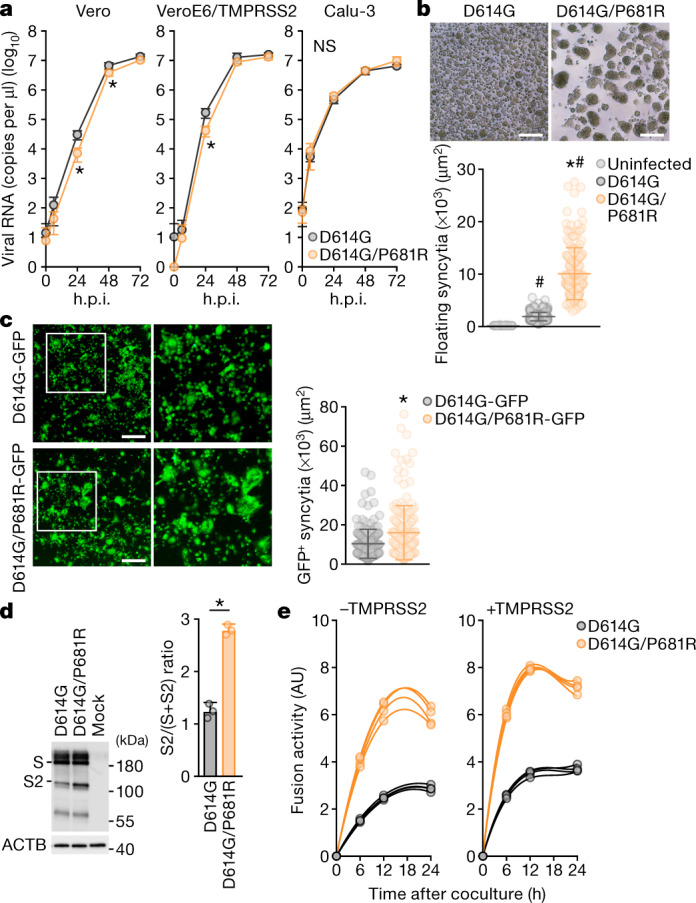
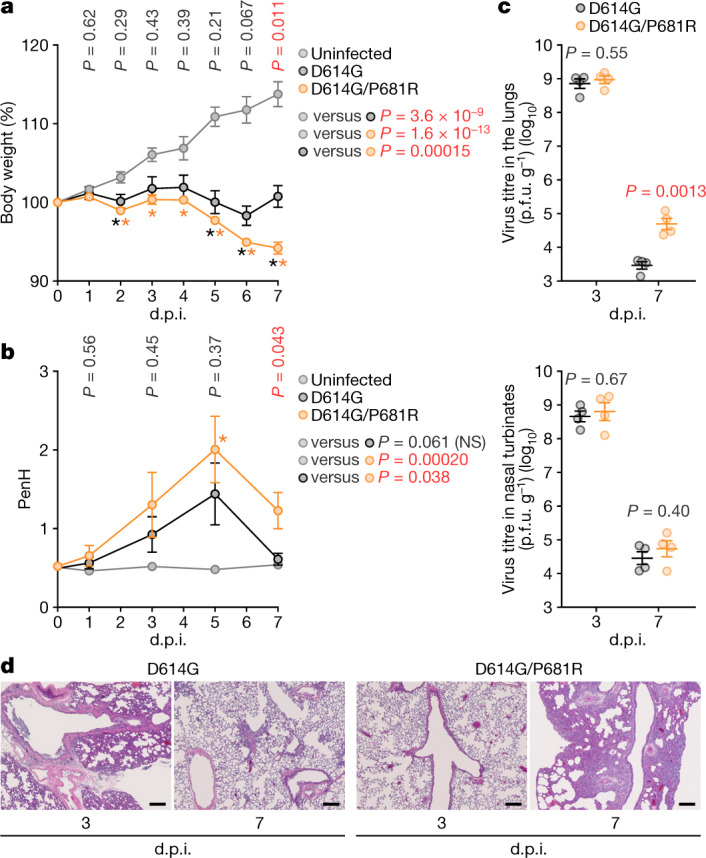
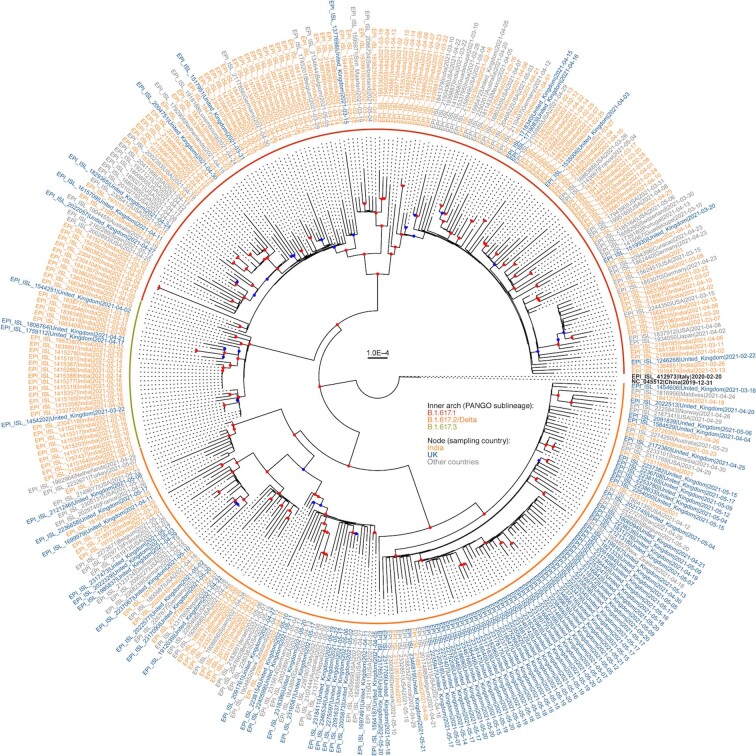
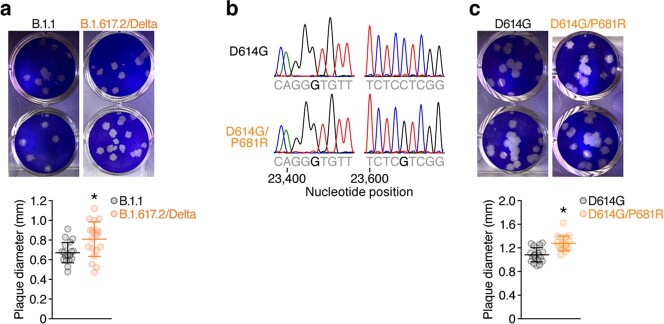
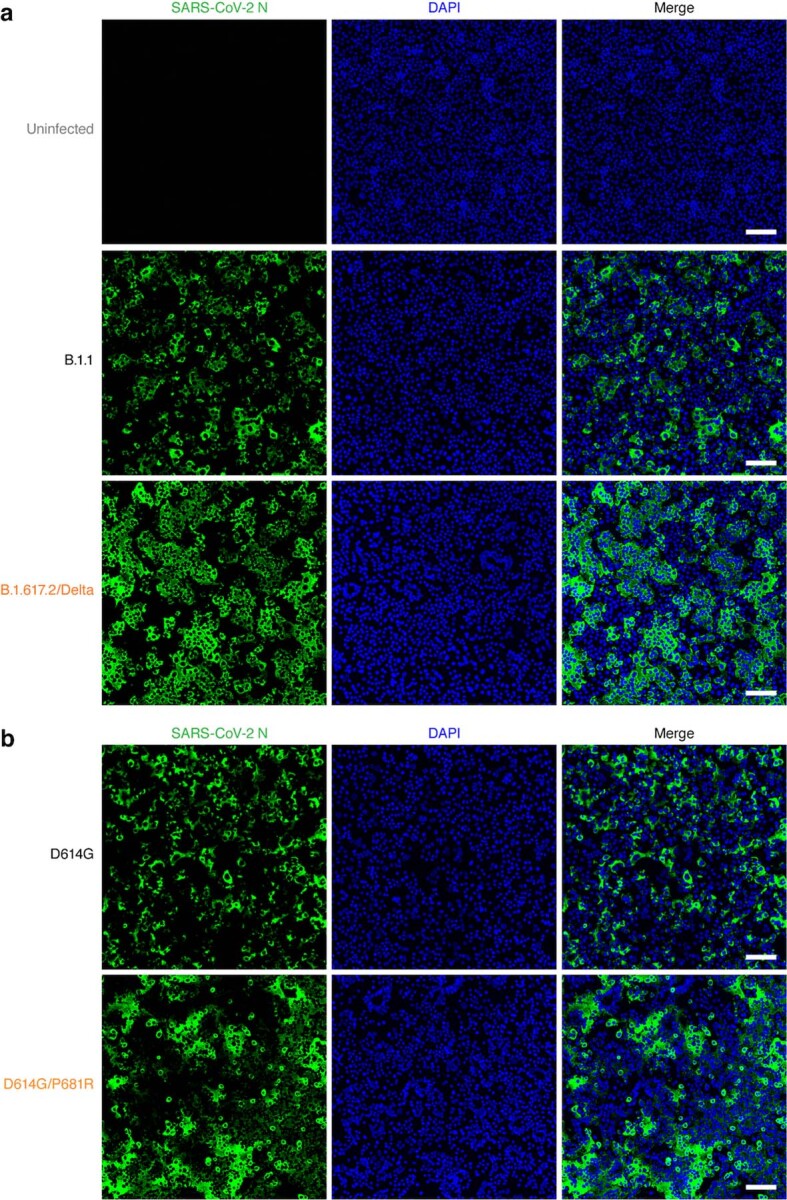
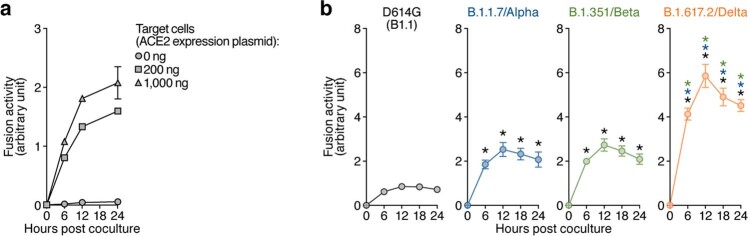
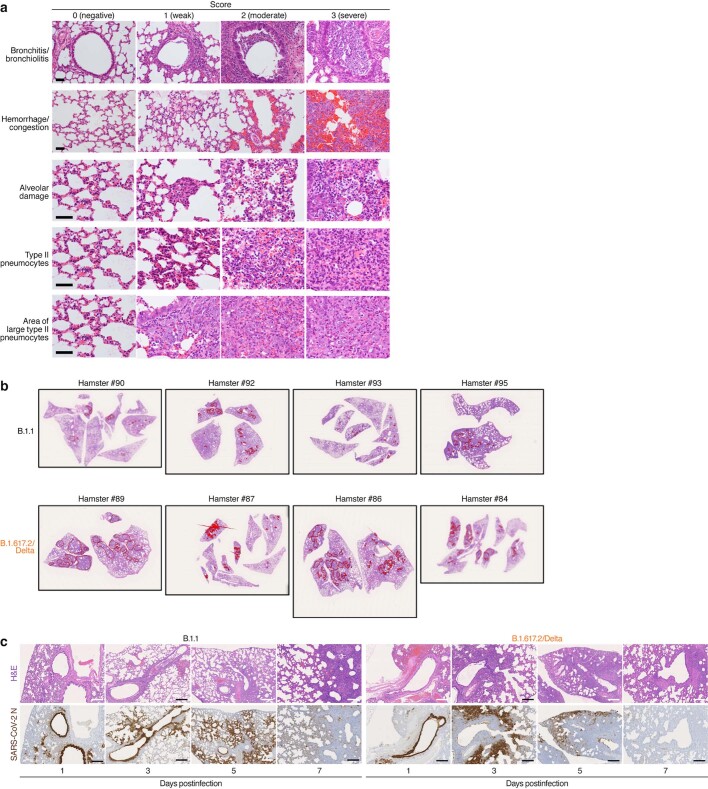
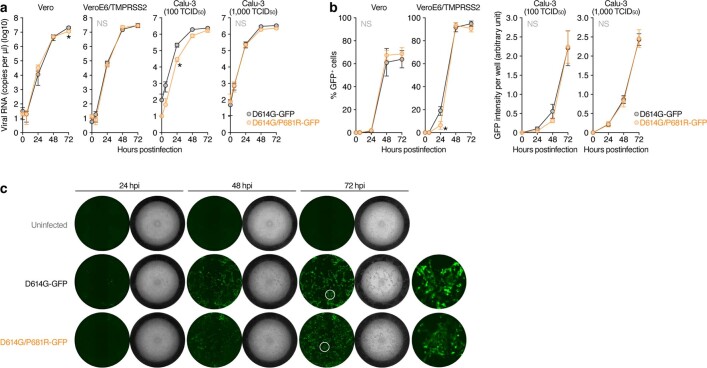
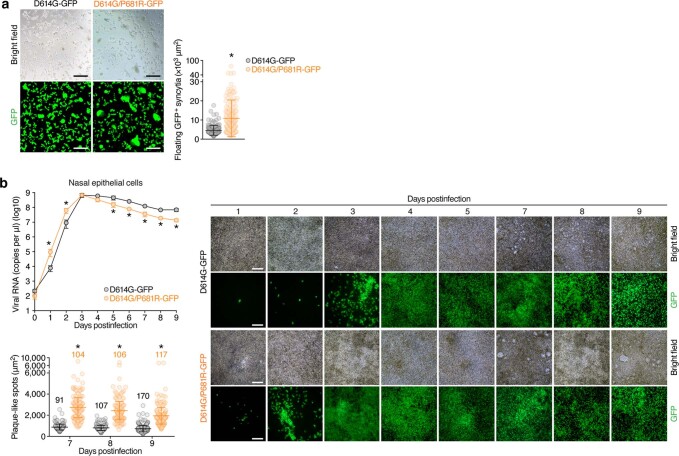
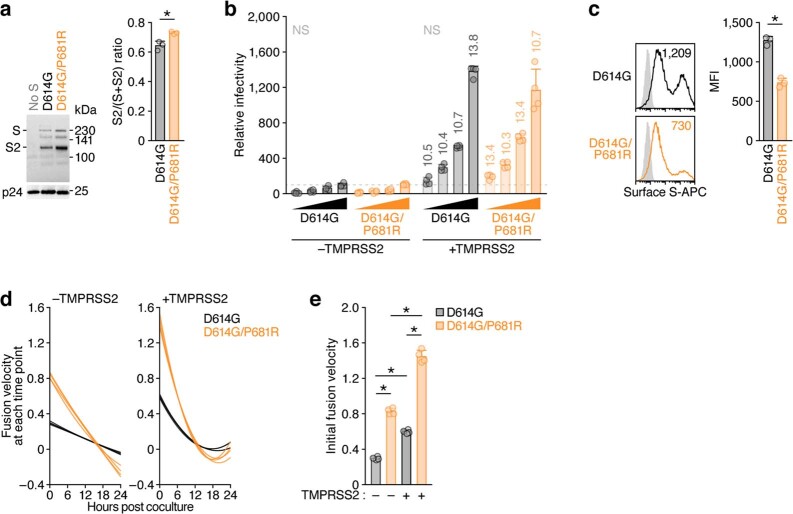
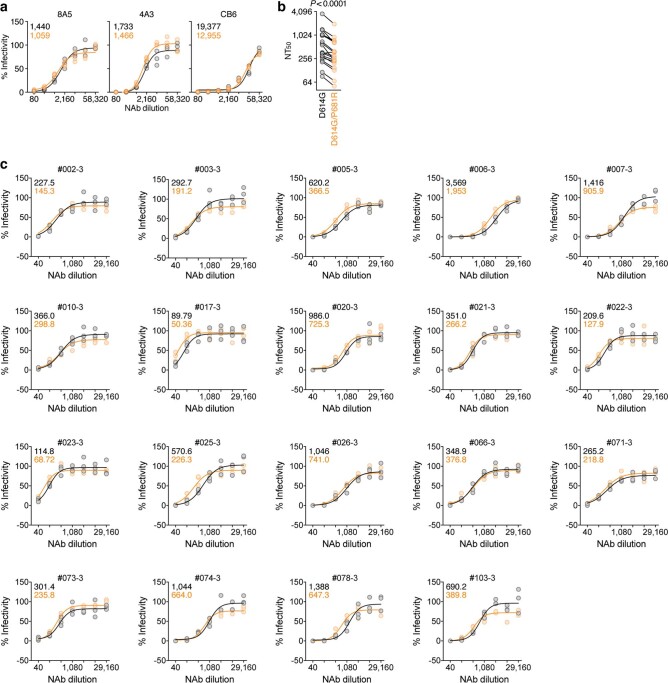
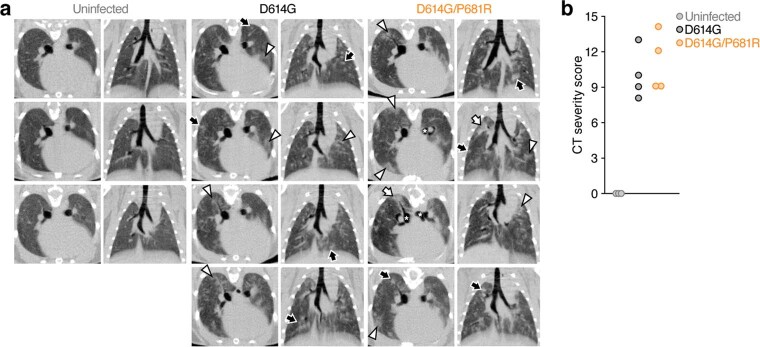
During the current coronavirus disease 2019 (COVID-19) pandemic, a variety of mutations have accumulated in the viral genome of severe acute respiratory syndrome coronavirus 2 (SARS-CoV-2) and, at the time of writing, four variants of concern are considered to be potentially hazardous to human society1. The recently emerged B.1.617.2/Delta variant of concern is closely associated with the COVID-19 surge that occurred in India in the spring of 2021 (ref. 2). However, the virological properties of B.1.617.2/Delta remain unclear. Here we show that the B.1.617.2/Delta variant is highly fusogenic and notably more pathogenic than prototypic SARS-CoV-2 in infected hamsters. The P681R mutation in the spike protein, which is highly conserved in this lineage, facilitates cleavage of the spike protein and enhances viral fusogenicity. Moreover, we demonstrate that the P681R-bearing virus exhibits higher pathogenicity compared with its parental virus. Our data suggest that the P681R mutation is a hallmark of the virological phenotype of the B.1.617.2/Delta variant and is associated with enhanced pathogenicity.


Conflict of interest statement

The authors declare no competing interests.

Figures

Fig. 1
Fig. 1. Molecular phylogenetics and epidemic dynamics of the B.1.617 lineage pandemic.
a, Phylogenetic tree of the B.1.617 lineage. Scale bar, 0.0002 substitutions per site. Bootstrap values are indicated by asterisks; **100%, *>70%. The uncollapsed tree is shown in Extended Data Fig. 1. b, c, Epidemic dynamics of the B.1.617 lineage. b, The number of sequences deposited in GISAID per day for India (top), the UK (middle) and the world (bottom). c, The percentages of each lineage deposited per day from India (orange), the UK (blue) and the world (grey). The date on which each variant was first identified is indicated. The raw data are summarized in Supplementary Table 1. d, The proportion of amino acid replacements in the B.1.617 lineage. The top 10 replacements conserved in the S protein of B.1.617 and its sublineages are summarized. The numbers in parentheses indicate the number of sequences included in each panel. The raw data are summarized in Supplementary Table 2.
Fig. 2
Fig. 2. Virological features of the B.1.617.2/Delta variant in vitro and in vivo.
a, Growth kinetics of B.1.617.2/Delta variant. A B.1.617.2/Delta and a D614G-bearing B.1.1 were inoculated in cells, and the copy number of viral RNA in the supernatant was quantified using RT–qPCR. Assays were performed in quadruplicate. b, Syncytium formation. Top, representative bright-field images of VeroE6/TMPRSS2 cells at 72 h.p.i. Scale bars, 100 μm. Bottom, the size distributions of floating syncytia in the cultures infected with B.1.1 (n = 215), B.1.1.7/Alpha (n = 199), B.1.351/Beta (n = 249) and B.1.617.2/Delta (n = 216). The size distribution of the floating uninfected cell culture (n = 177) is also shown as a negative control. cg, Infection of Syrian hamsters with the B.1.617.2/Delta variant. Syrian hamsters were intranasally inoculated with B.1.1 (n = 6) and B.1.617.2/Delta (n = 12). Four hamsters of the same age were mock infected. The amount of viral RNA in the oral swab (c) and body weight (d) were measured. e, Haematoxylin and eosin (H&E) staining of the lungs of infected hamsters. Uninfected lung alveolar space and bronchioles are shown (left). Scale bars, 50 μm. f, Histopathological scoring of lung lesions. Representative pathological features are shown in Extended Data Fig. 5a. g, The area with large type II pneumocytes in the lungs of B.1.1-infected (n = 4) and B.1.617.2/Delta-infected (n = 4) hamsters at 5 d.p.i. The area was measured on the photographs (left) and summarized (right, each dot indicates the result from respective hamster). Raw data are shown in Extended Data Fig. 5b. Data are mean ± s.d. (a, b) or mean ± s.e.m. (d, f, g). In a, b, g, statistically significant differences versus B.1.1, B.1.1.7/Alpha and B.1.351/Beta (*P < 0.05) and uninfected culture (#P < 0.05) were determined using two-sided, unpaired Student’s t-tests (a, g) or Mann–Whitney U-tests (b). In c, d, f, statistically significant differences between B.1.1 and B.1.617.2/Delta were determined by multiple regression and P values (c, d), and family-wise error rates calculated using the Holm method (f) are indicated in the figure. Statistically significant differences at each timepoint were also determined using two-sided unpaired Student’s t-tests without adjustment for multiple comparisons (c, d), and those versus uninfected hamsters (*P < 0.05) are indicated by asterisks. The P value of the comparison between B.1.1 and B.1.617.2/Delta at each d.p.i. is indicated in the figure. NS, not significant. Source data
Fig. 3
Fig. 3. Virological features of the P681R-containing virus in vitro.
a, The growth kinetics of artificially generated viruses. The D614G and D614G/P681R mutant viruses were generated by reverse genetics. These viruses (100 tissue culture infectious dose (TCID50)) were inoculated into Vero cells and VeroE6/TMPRSS2 cells, and the copy number of viral RNA in the culture supernatant was quantified using RT–qPCR. The growth curves of the inoculated viruses are shown. Assays were performed in quadruplicate. b, c, Syncytium formation. b, Floating syncytia in VeroE6/TMPRSS2 cells infected with the D614G and D614G/P681R mutant viruses at 72 h.p.i. (top). Scale bars, 200 μm. Bottom, the size distributions of floating syncytia in D614G-infected (n = 228) and D614G/P681R-infected (n = 164) cultures. c, Adherent syncytia in VeroE6/TMPRSS2 cells infected with GFP-expressing D614G- and D614G/P681R-mutant viruses at 24 h.p.i. Higher-magnification views of the regions indicated by with squares are shown in the right images. Scale bars, 200 μm. The size distributions of adherent GFP+ syncytia in the D614G-infected (n = 111) and D614G/P681R-infected (n = 126) cultures. d, Western blot analysis of S-expressing cells. Left, representative blots of SARS-CoV-2 full-length S and cleaved S2 proteins as well as ACTB as an internal control. Assays were performed in triplicate. Data are mean ± s.d. Right, the ratio of S2 to the full-length S plus S2 proteins in the S-expressing cells. e, SARS-CoV-2 S-based fusion assay. Effector cells (S-expressing cells) and target cells (ACE2-expressing cells or ACE2/TMPRSS2-expressing cells) were prepared, and the fusion activity was measured as described in the Methods. Assays were performed in quadruplicate, and fusion activity (arbitrary units) is shown. Data are mean ± s.d. Statistically significant differences versus D614G (*P < 0.05) and uninfected culture (#P < 0.05) were determined using two-sided unpaired Student’s t-tests (a, d) or Mann–Whitney U-tests (b, c).
Fig. 4
Fig. 4. Enhanced pathogenicity by the P681R mutation in hamsters.
Syrian hamsters were intranasally inoculated with the D614G and D614G/P681R viruses. a, Body weight changes in hamsters after viral infection. Body weights of virus-infected (n = 4 each) and uninfected (n = 3) hamsters were monitored daily for 7 days. b, Pulmonary function analysis in infected hamsters. Enhanced pause (PenH), which is a surrogate marker for bronchoconstriction or airway obstruction, was measured using whole-body plethysmography. c, Virus replication in infected hamsters. Four hamsters per group were euthanized at 3 d.p.i. and 7 d.p.i. for virus titration. Virus titres in the lungs (top) and nasal turbinates (bottom) were determined by plaque assay using VeroE6/TMPRSS2 cells. The points indicate data from individual Syrian hamsters. p.f.u., plaque-forming units. d, Histopathological examination of the lungs of infected Syrian hamsters. Representative pathological images of D614G- and D614G/P681R-infected lungs at 3 d.p.i. and 7 d.p.i. Scale bars, 200 μm. Data are mean ± s.e.m. In a, b, statistically significant differences were determined by multiple regression and P values are indicated in the figure. Statistically significant difference at each timepoint was also determined using two-sided unpaired Student’s t-tests without adjustment for multiple comparisons, and those versus uninfected hamsters (*P < 0.05) are indicated by asterisks. The P value of the comparison between D614G and D614G/P681R at each d.p.i. is indicated in the figure. Source data
Extended Data Fig. 1
Extended Data Fig. 1. A maximum-likelihood-based phylogenetic tree of 334 representative SARS-CoV-2 sequences belonging to the B.1.617 lineage.
GISAID ID, country of exposure, and sampling date were noted in each terminal node. The country isolated (India, the UK, or other countries) and the PANGO sublineage are indicated by the text colour, as indicated in the figure. Coloured circles on the branch are shown on internal nodes for which the bootstrap value was ≥ 80 (red) or ≥ 50 (blue) (n = 1,000).
Extended Data Fig. 2
Extended Data Fig. 2. Plaques of SARS-CoV-2-infected VeroE6/TMPRSS2 cells.
a, A plaque assay was performed using VeroE6/TMPRSS2 cells as described in Method. Representative figures (top) and the summary of the size of plaques (n = 20 for each virus) are shown. Each dot indicates the diameter of the respective plaque. b, Chromatograms of nucleotide positions 23,399-23,407 (left) and 23,600-23,608 (right) of parental SARS-CoV-2 (strain WK-521, PANGO lineage A; GISAID ID: EPI_ISL_408667) and the D614G (A23403G in nucleotide) and P681R (C23604G in nucleotide) mutations. c, A plaque assay was performed using VeroE6/TMPRSS2 cells as described in Method. Representative figures (top) and the summary of the size of plaques (n = 20 for each virus) are shown. Each dot indicates the diameter of the respective plaque. Data are mean ± S.D (a, c). Statistically significant differences between B.1.1 and B.1.617.2/Delta (a, *P < 0.05) and between D614G and D614G/P681R (c, *P < 0.05) were determined by two-sided Mann-Whitney U test.
Extended Data Fig. 3
Extended Data Fig. 3. Immunofluorescence staining of SARS-CoV-2-infected VeroE6/TMPRSS2 cells.
VeroE6/TMPRSS2 cells were infected with the B.1.1 or B.1.617.2/Delta (a) or artificially generated D614G or D614G/P681R (b) viruses [multiplicity of infection (MOI) 0.01]. The cells were stained with anti-SARS-CoV-2 nucleocapsid (N) (green) and DAPI (blue). Representative images taken at 24 h.p.i. Bars, 50 μm.
Extended Data Fig. 4
Extended Data Fig. 4. SARS-CoV-2 S-based fusion assay.
a, Dependence of human ACE2 expression on the target cells for the SARS-CoV-2 S-based fusion assay. Target cells were prepared by transfecting the indicated amounts of human ACE2 expression plasmid, while Effector cells were prepared by transfecting SARS-CoV-2 S D614G expression plasmid. The fusion activity was measured as described in Methods. Assays were performed in quadruplicate, and fusion activity (arbitrary units) is shown. b, Fusogenic activity of the S proteins of VOCs. Effector cells (S-expressing cells) and target cells (ACE2-expressing cells) were prepared, and the fusion activity was measured as described in Methods. Note that the S protein sequence of “D614G” is identical to that of B.1.1 isolate. Assays were performed in quadruplicate, and fusion activity (arbitrary units) is shown. Data are mean ± S.D. In b, statistically significant differences (*P < 0.05) versus the D614G (black), B.1.1.7/Alpha (blue) or B.1.351/Beta (green) were determined by two-sided Student’s t test.
Extended Data Fig. 5
Extended Data Fig. 5. Histopathological features of lung lesions.
a, Representative pathological features of lung including bronchitis/bronchiolitis, haemorrhage/congestion, alveolar damage with apoptosis and macrophage infiltration, presence of type II pneumocytes, and presence of the area of large type II pneumocytes are shown. 0 (negative), 1 (weak), 2 (moderate), and 3 (severe). Bars, 50 μm. b, Morphometrical analysis of the area of large type II pneumocytes. The area of the large type II pneumocytes with the nuclear diameter more than 8 μm in the lung specimens at 5 d.p.i. was measured, and the percentage of this area in the whole lung tissue area was calculated. Representative photographs of the lung tissue specimens with B.1.1 isolate (top) and B.1.617.2/Delta isolate (bottom) infections are shown. Red line indicates the area with the presence of large type II pneumocytes. Note that the most left panels (hamsters #89 and 90) are identical to the panels shown in Fig. 2g. c, IHC of the viral N proteins in the lung of infected hamsters. Representative IHC panels of the viral N proteins in the lung of hamsters infected with D614G-bearing B.1.1 isolate (left) and B.1.617.2/Delta isolates (right) are shown. Serial sections were used for H&E staining (top) and IHC (bottom). Bars, 250 μm (1, 3, and 7 d.p.i.) or 500 μm (5 d.p.i.).
Extended Data Fig. 6
Extended Data Fig. 6. Growth kinetics of artificially generated GFP-expressing viruses.
The GFP-expressing D614G and D614G/P681R mutant viruses were generated by reverse genetics. These viruses (100 TCID50 for Vero and VeroE6/TMPRSS2 cells, 100 or 1,000 TCID50 for Calu-3 cells) were inoculated into cells. The viral RNA copy number of in the culture supernatant (a) and the level of GFP-positive cells (the percentage of GFP-positive cells for Vero and VeroE6/TMPRSS2 cells; the GFP intensity per well for Calu-3 cells) (b) are shown. Data are mean ± S.D. (c) Representative images of Calu-3 cells infected with GFP-expressing viruses (100 TCID50). Areas enclosed with circles are enlarged in the right panels. Assays were performed in quadruplicate. Statistically significant differences (*P < 0.05) versus the D614G virus were determined by two-sided Student’s t test. NS, no statistical significance.
Extended Data Fig. 7
Extended Data Fig. 7. Syncytium formation in VeroE6/TMPRSS2 cells infected with GFP-expressing viruses.
a, (Left) Floating syncytia in VeroE6/TMPRSS2 cells infected with GFP-expressing D614G and D614G/P681R mutant viruses (100 TCID50) at 72 h.p.i. Bars, 100 μm. (Right) The size distributions of adherent GFP+ syncytia in the D614G mutant-infected (n = 147) and the D614G/P681R mutant-infected (n = 171) cultures. b, The GFP-expressing D614G and D614G/P681R mutant viruses (1,000 TCID50) were inoculated on the apical side of culture. (Upper left) The copy number of viral RNA on the apical side was quantified as described in Methods, and the growth curves of the inoculated viruses are shown. (Lower left) The size distributions of plaque-like spots in D614G-infected and D614G/P681R-infected cultures. The numbers in the panel indicate the number of plaque-like spots counted. (Right) Time-course of GFP expression. Note that larger plaque-like spots are observed in D614G/P681R-infected culture after 7 d.p.i. Bars, 200 μm. Assays were performed in quadruplicate. Data are mean ± S.D. Statistically significant differences versus D614G (*P < 0.05) were determined by two-sided, unpaired Student’s t test (b, upper left) or the Mann-Whitney U test (a, b, lower left).
Extended Data Fig. 8
Extended Data Fig. 8. Virological phenotypes exhibited by the P681R mutation.
a, Western blotting of pseudoviruses. (Left) Representative blots of SARS-CoV-2 full-length S and cleaved S2 proteins as well as HIV-1 p24 capsid as an internal control. kDa, kilodaltons. (Right) The ratio of S2 to the full-length S plus S2 proteins on pseudovirus particles. Assays were performed in triplicate. Data are mean ± S.D. A statistically significant difference (*, P < 0.05) versus D614G S was determined by two-sided Student’s t test. b, Pseudovirus assay. The HIV-1-based reporter virus pseudotyped with SARS-CoV-2 S D614G or D614G/P681R was inoculated into HOS-ACE2 cells or HOS-ACE2/TMPRSS2 cells at 4 different doses (125, 250, 500 and 1,000 ng HIV-1 p24 antigen). Rates of infectivity compared to the virus pseudotyped with parental S D614G (1,000 ng HIV-1 p24) in HOS-ACE2 cells are shown. The labels above the HOS-ACE2/TMPRSS2 bars indicate the fold change versus the corresponding HOS-ACE2. Assays were performed in quadruplicate. c, Expression of S protein on the cell surface. (Left) Representative histogram of S protein expression on the cell surface. The number in the histogram indicates the mean fluorescence intensity (MFI). (Right) The MFI of surface S on the S-expressing cells. Assays were performed in triplicate. d,e, The kinetics of fusion velocity. d, Fitting of a mathematical model based on the kinetics of fusion activity data (see Methods). Each line indicates the result of respective mathematical model on the experimental data (shown in Fig. 3e). e, Initial velocity of the S-mediated fusion. Assays were performed in quadruplicate. Data are mean ± S.D. Statistically significant differences (*P < 0.05) were determined by two-sided, unpaired Student’s t test without adjustments for multiple comparisons (b), two-sided Student’s t test (c) or two-sided Welch’s t test (e). NS, no statistical significance.
Extended Data Fig. 9
Extended Data Fig. 9. Association of the P681R mutation with sensitivity to NAbs.
a, Neutralization assay using three monoclonal antibodies (clones 8A5, 4A3 and CB6). Assays were performed in triplicate. b,c, Neutralization assay using 19 vaccinated sera. Pseudoviruses and effector cells (S-expressing cells) were treated with serially diluted NAbs or sera as described in Methods. Assays were performed in triplicate. The raw data of panel b are shown in panel c. NT50, 50% neutralization titre. In b, each dot indicates the mean NT50 value of the respective donor. A statistically significant difference versus the D614G virus was determined by two-sided Wilcoxon matched-pairs signed rank test. In c, the NT50 values of D614G S (black) and D614G/P681R S (orange) for each serum are indicated in each panel.
Extended Data Fig. 10
Extended Data Fig. 10. MicroCT of the lung of infected hamsters.
a, MicroCT axial and coronal images of the lungs of Syrian hamsters at 7 d.p.i. with D614G-infected (n = 4), D614G/P681R-infected (n = 4), and uninfected hamsters (n = 3). Lung abnormalities included multifocal nodules (black arrows), ground glass opacity (white arrowheads), and regions of lung consolidation (white arrows) that were peripheral, bilateral, and multilobar. Pneumomediastinum is labelled with white asterisks. b, Summary of CT severity score. CT severity score of D614G-infected (n = 4), D614G/P681R-infected (n = 4), and uninfected hamsters (n = 3) Syrian hamsters. Each dot indicates the result of the respective infected hamster. Note that D614G/P681R-infected animals had a higher average CT severity score compared to D614G-infected animals.

Similar articles

Cited by

References

    1. Coronavirus Disease 2019 (WHO, 2021); https://www.who.int/emergencies/diseases/novel-coronavirus-2019
    1. Singh J, Rahman SA, Ehtesham NZ, Hira S, Hasnain SE. SARS-CoV-2 variants of concern are emerging in India. Nat. Med. 2021;27:1131–1133. - PubMed
    1. Plante JA, et al. The variant gambit: COVID’s next move. Cell Host Microbe. 2021;29:508–515. - PMC - PubMed
    1. Korber B, et al. Tracking changes in SARS-CoV-2 spike: evidence that D614G increases infectivity of the COVID-19 virus. Cell. 2020;182:812–827. - PMC - PubMed
    1. Zhou B, et al. SARS-CoV-2 spike D614G change enhances replication and transmission. Nature. 2021;592:122–127. - PubMed

Publication types

MeSH terms

Substances

Supplementary concepts