

Changes in the dollar value of per capita alcohol, essential, and non-essential retail sales in Canada during COVID-19
- PMID: 34823488
- PMCID: PMC8613522
- DOI: 10.1186/s12889-021-12226-1
Changes in the dollar value of per capita alcohol, essential, and non-essential retail sales in Canada during COVID-19
Abstract
Background: Multiple survey reports suggest that alcohol use has increased in Canada during the COVID-19 pandemic. However, less is known about how per capita alcohol sales, which predict population-level alcohol use, have changed and whether changes in alcohol sales differ from changes in sales of other products due to pandemic factors.
Methods: We obtained monthly retail sales data by industry from Statistics Canada, for the six largest provinces in Canada (containing 93% of the national population), between January 2010 and November 2020, representing time before and 9 months after the start of the pandemic in Canada. We used an interrupted time series analysis to estimate pandemic impacts on the dollar value of monthly per capita (per individuals 15+ years) alcohol, essential and non-essential retail sales. We adjusted our analyses for pre-pandemic sales trends, inflation, seasonality and changing population demographics over time.
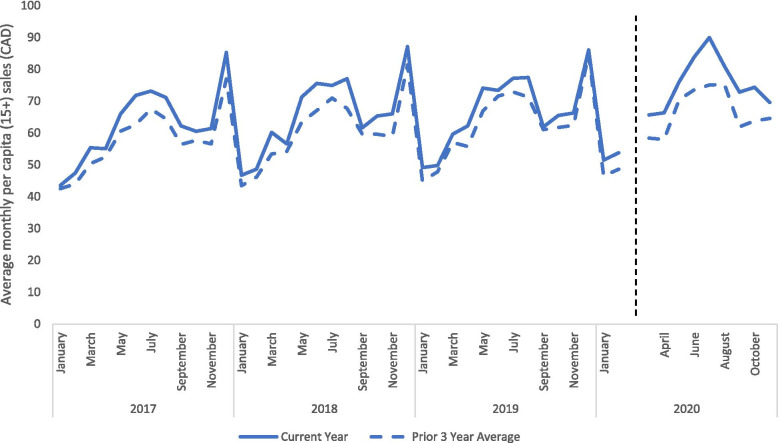
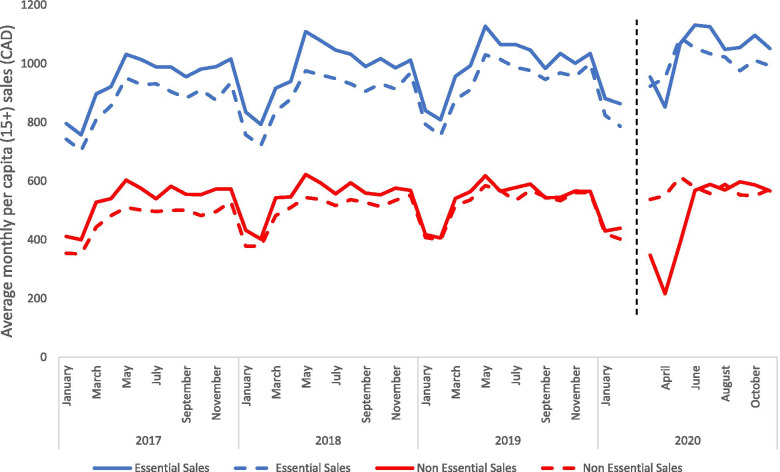
Results: During the first 9 months of the pandemic, the values of per capita alcohol, essential and non-essential sales were, respectively, 13.2% higher, 3.6% higher and 13.1% lower than the average values during the same period in the prior 3 years. Interrupted time series models showed significant level change for the value of monthly per capita alcohol sales (+$4.86, 95% CIs: 2.88, 6.83), essential sales (-$59.80, 95% CIs: - 78.47, - 41.03) and non-essential sales (-$308.70, 95% CIs: - $326.60, - 290.79) during the pandemic. Alcohol sales were consistently elevated during the pandemic, and the pre- and post-pandemic slopes were comparable. In contrast, essential and non-essential retail sales declined in the early months of the pandemic before returning to regular spending levels.
Conclusion: During the first 9 months of the pandemic, per capita alcohol sales were moderately elevated in Canada. In contrast, non-essential sales were lower than prior years, driven by large decreases during the initial months of the pandemic. These findings suggest that the pandemic was associated with increased population-level alcohol consumption, which may lead to increased alcohol-related harms. Ongoing research is needed to examine how factors, including pandemic-related stressors and specific alcohol sales-related policies, may have influenced changes in alcohol use and harms.
© 2021. The Author(s).
Conflict of interest statement
The authors have all completed ICMJE conflict of interest forms. The authors have no conflicts of interest to declare.
Figures
References
-
- Degenhardt L, Charlson F, Ferrari A, Santomauro D, Erskine H, Mantilla-Herrara A, et al. The global burden of disease attributable to alcohol and drug use in 195 countries and territories, 1990–2016: a systematic analysis for the Global Burden of Disease Study 2016. Lancet Psychiatry. 2018;5(12):987–1012. doi: 10.1016/S2215-0366(18)30337-7. - DOI - PMC - PubMed
-
- Canadian substance use costs and harms (2015–2017) [report] | Canadian Centre on Substance Use and Addiction. Available from: https://www.ccsa.ca/canadian-substance-use-costs-and-harms-2015-2017-report. Cited 2020 Aug 4.
MeSH terms
LinkOut - more resources
Full Text Sources
Medical
