. 2022 Apr 16:374:131632.
doi: 10.1016/j.foodchem.2021.131632. Epub 2021 Nov 18.

Diversity in blueberry genotypes and developmental stages enables discrepancy in the bioactive compounds, metabolites, and cytotoxicity

Affiliations

Diversity in blueberry genotypes and developmental stages enables discrepancy in the bioactive compounds, metabolites, and cytotoxicity

Protiva Rani Das et al. Food Chem. .

Abstract

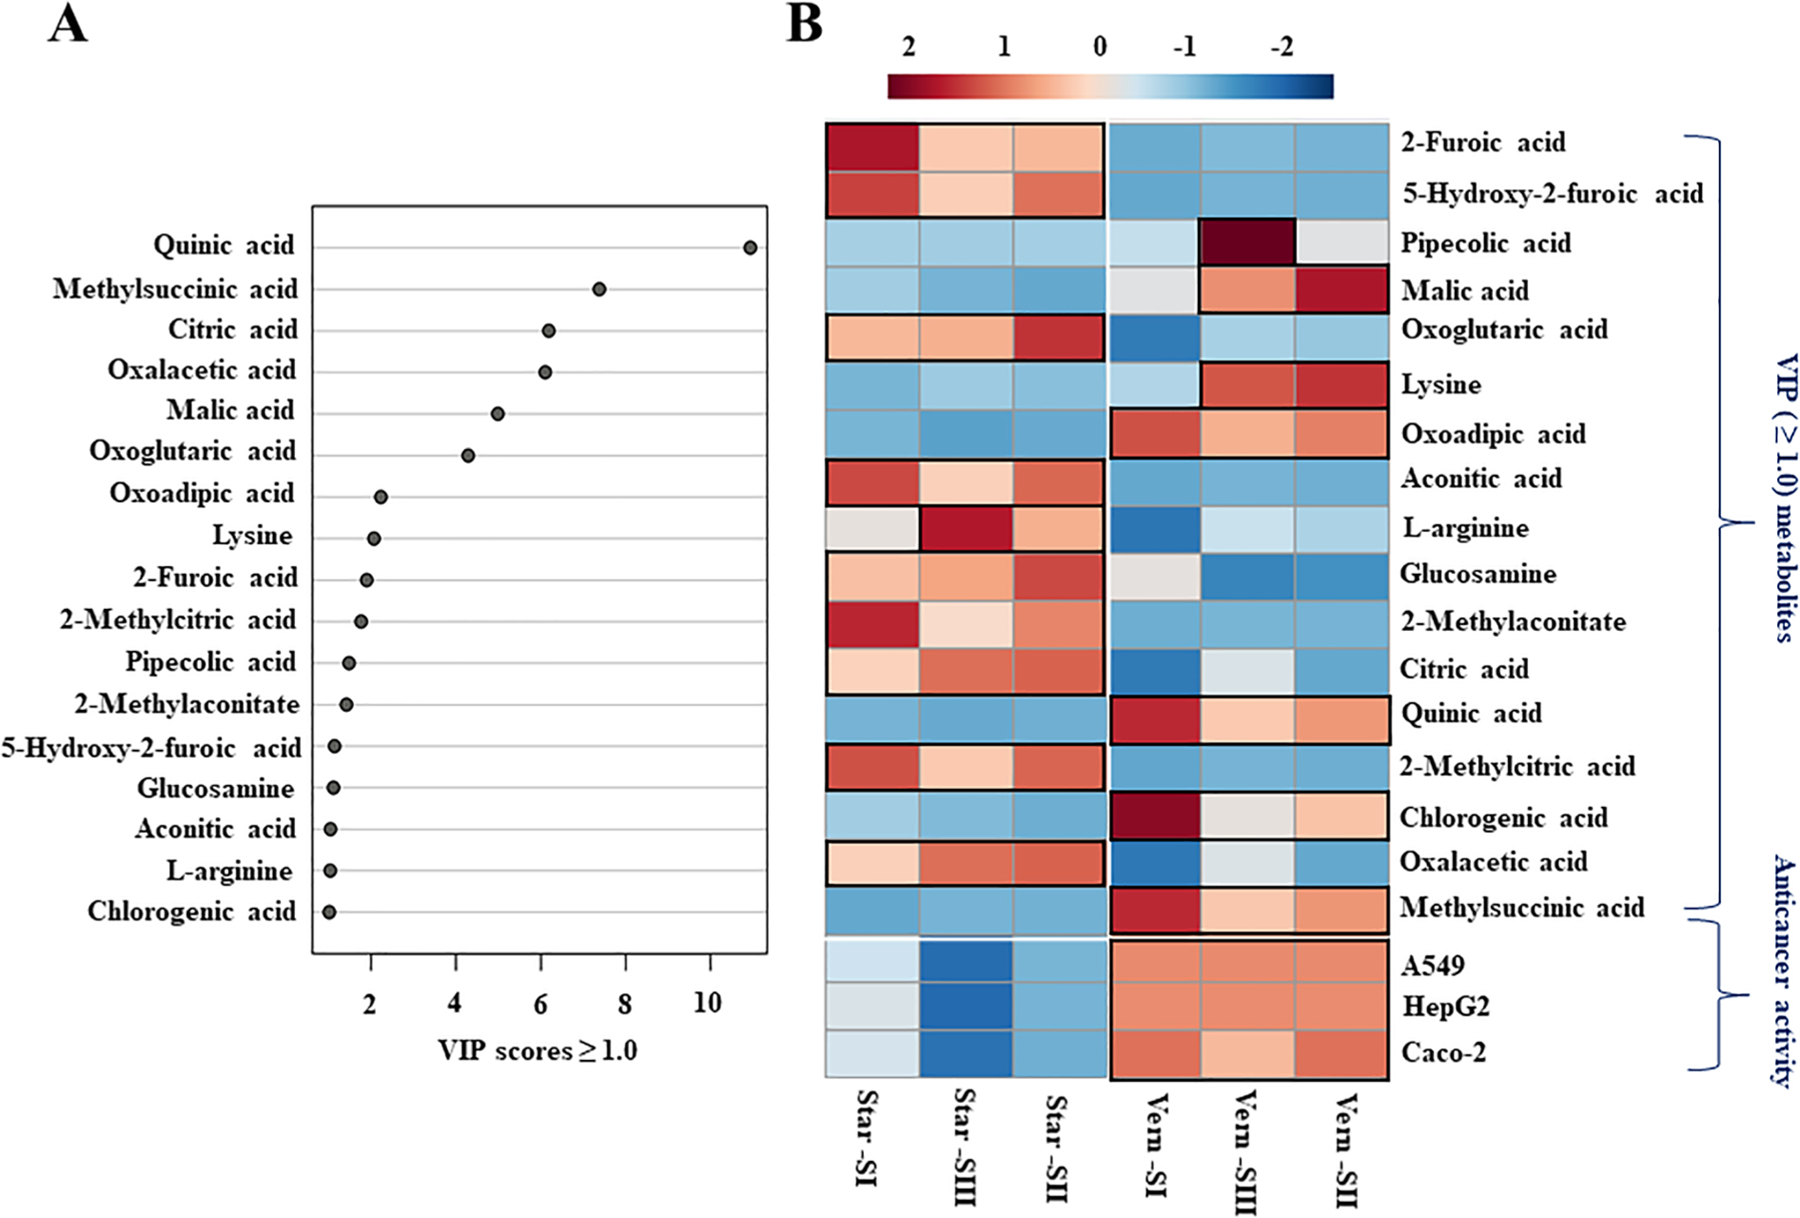
Eight blueberry cultivars at three developmental stages were investigated for metabolite profiling, antioxidant, and anticancer activities. Cultivars- and developmental stages-variations were determined in total phenolic, flavonoid, DPPH, and FRAP antioxidant assays. The anticancer capacity was equal against A549, HepG2, and Caco-2 cancer cells, whereas the inhibition rate was dose-, incubation period-, cultivar-, and developmental stages-dependent. The untargeted metabolite profiling by UPLC-TOF-MS analysis of two contrast cultivars, 'Vernon' and 'Star', throughout the developmental stages revealed 328 metabolites; the majority of them were amino acids, organic acids, and flavonoids. The multivariate statistical analysis identified five metabolites, including quinic acid, methyl succinic acid, chlorogenic acid, oxoadipic acid, and malic acid, with positively higher correlations with all anticancer activities. This comprehensive database of blueberry metabolites along with anticancer activities could be targeted as natural anticancer potentials. This study would be of great value for food, nutraceutical, and pharmaceutical industries as well as plant biotechnologists.

Keywords: Anticancer; Antioxidant; Berry developmental stage; Biomarker metabolites; Blueberry cultivars; Untargeted metabolomics.


Conflict of interest statement

Declaration of Competing Interest

The authors declare that they have no known competing financial interests or personal relationships that could have appeared to influence the work reported in this paper.

Figures

Fig. 1.
Fig. 1.
(A) Close-up view of the 8 blueberry cultivars at different developmental stages. Stage I represents the green color stage, stage II represents the turning pigmentation stage, and stage III represents the ripening stage. (B) Total phenolic content (TPC), (C) Total flavonoid content (TFC), (D) Total anthocyanin content (TAC), (E) DPPH radical scavenging activity, and (F) FRAP activity of blueberry cultivars during developmental stages. Colors representing each cultivar are indicated. Data represent the mean values ± SD (n = 3). The different lowercase letters represent the significant differences among blueberry cultivars and different uppercase letters represent the significant differences among developmental stages, according to Duncan’s multiple range test (p > 0.05). (For interpretation of the references to color in this figure legend, the reader is referred to the web version of this article.)
Fig. 2.
Fig. 2.
(A) Inhibition percentage (%) of the A549, HepG2, and Caco-2 cancer cell growth by selected blueberry cultivars throughout the different developmental stages at the dose of 500 ng/mL for 48 h incubation. (B) IC50 values of selected blueberry cultivars throughout the developmental stages for (B) A549, (C) HepG2, and (D) Caco-2 cancer cells at 48 h incubation. Data represent the mean values ± SD (n = 3). ** Significant at p0.01, ns: non-significant. Vern-SI: ‘Vernon’ cultivar at the green color stage; Vern-SII: ‘Vernon’ cultivar at the turning pigmentation stage; Vern-SIII: ‘Vernon’ cultivar at the ripe stage; Star-SI: ‘Star’ cultivar at the green color stage; Star-SII: ‘Star’ cultivar at the turning pigmentation stage; Star-SIII: ‘Star’ cultivar at the ripe stage. (For interpretation of the references to color in this figure legend, the reader is referred to the web version of this article.)
Fig. 3.
Fig. 3.
(A) Dot plot and (B) Interactive pie chart of identified blueberry metabolites throughout the developmental stages based on metabolite set enrichment analysis (MSEA). This analysis refers to the over-representation analysis of 328 identified metabolites from all blueberry cultivars throughout the developmental stages. As all 328 metabolites were identified in all cultivars as well as all developmental stages, the over-representation analysis of MSEA represents the main chemical classes of metabolites set with enrichment ratio. For the over-representation analysis only HMDB ID of identified compounds are used without concentration. Colors in the bar plot describe the p-value. The red and orange colors dots signify the high and low values, respectively. The dot sizes indicate the enrichment ratio, which was computed by hits/expected, where hits = observed hits and expected = expected hits. The colors in the interactive pie chart designate each chemical group relative to the total number of compounds. (For interpretation of the references to color in this figure legend, the reader is referred to the web version of this article.)
Fig. 4.
Fig. 4.
(A) PCA 2D score plot and (B) Biplot of the blueberry metabolites throughout the developmental stages. (C) Visualization of top 20 FC metabolite patterns by volcano plot between ‘Vernon’ vs v’Star’ at developmental (C) stage-I, (D) stage-II, and (E) stage-III. In the 2D score plot, the red color of the oval, triangle, and cross shape represents Star-SI, Star-SII, and Star-SIII; and blue color represents Vern-SI, Vern-SII, and Vern-SIII. The different short abbreviations in the biplot manifest the scores of the observations (i.e., blueberry developmental stages). The vectors that point toward the same direction correspond to the variables (i.e., metabolites) with similar response profiles. Vern-SI: ‘Vernon’ cultivar at the green color stage; Vern-SII: ‘Vernon’ cultivar at the turning pigmentation stage; Vern-SIII: ‘Vernon’ cultivar at the ripe stage; Star-SI: ‘Star’ cultivar at the green color stage; Star-SII: ‘Star’ cultivar at the turning pigmentation stage; Star-SIII: ‘Star’ cultivar at the ripe stage. In the Volcano Plot analysis, Bluish bars on the right side: up-regulated metabolites, and bluish bars on the left side: down-regulated metabolites. (For interpretation of the references to color in this figure legend, the reader is referred to the web version of this article.)
Fig. 5.
Fig. 5.
(A) Variable importance in projection (VIP ≥ 1.0) measure in PLS-DA and (B) Heatmap of VIP (score ≥ 1.0) metabolites and anticancer activities of ‘Vernon’ and ‘Star’ among all developmental stages. In Heatmap analysis, each column refers to the blueberry cultivars at developmental stages, each row indicates the metabolites and anticancer activities, the red and blue colors with values (ranged from –2 to +2) describe the higher and lower metabolites intensities and anticancer potentialities, the higher the red color intensity (from +1 to +2 values), the higher the metabolite contents and anticancer activities. In contrast, the higher blue color intensity (from –1 to –2 values) represents the lower metabolite contents and anticancer activities. Vern-SI: ‘Vernon’ cultivar at the green color stage; Vern-SII: ‘Vernon’ cultivar at the turning pigmentation stage; Vern-SIII: ‘Vernon’ cultivar at the ripe stage; Star-SI: ‘Star’ cultivar at the green color stage; Star-SII: ‘Star’ cultivar at the turning pigmentation stage; Star-SIII: ‘Star’ cultivar at the ripe stage; A549: lung cancer cell line; HepG2: liver cancer cell line; Caco-2: colon cancer cell line. (For interpretation of the references to color in this figure legend, the reader is referred to the web version of this article.)
Fig. 6.
Fig. 6.
(A) Pearson correlations and (B) The relative contents (MAU.s) of biomarker metabolites displaying higher positive correlation with anticancer activities of ‘Vernon’ and ‘Star’ among all developmental stages. Pearson correlations were performed between VIP (score ≥ 1.0) metabolites computed among all developmental stages and anticancer activities against A549 (lung cancer cell line), HepG2 (liver cancer cell line), and Caco-2 (colon cancer cell line).

References

    1. Aravind SM, Wichienchot S, Tsao R, Ramakrishn S, & Chakkaravarthi S (2021). Role of dietary polyphenols on gut microbiota, their metabolites and health benefits. Food Research International, 142, Article 110189. - PubMed
    1. Castrejón ADR, Eichholz I, Rohn S, Kroh LW, & Huyskens-Keil S (2008). Phenolic profile and antioxidant activity of highbush blueberry (Vaccinium corymbosum L.) during fruit maturation and ripening. Food Chemistry, 109(3), 564–572.
    1. Chang CC, Yang MH, Wen HM, & Chern JC (2002). Estimation of total flavonoid content in propolis by two complementary colorimetric methods. Journal of Food and Drug Analysis, 10, 178–182.
    1. Concetta TM, Antonioc MG, Marcoa B, Rosariac A, Rosaa LM, Annabelleb D, … Brigitteb D (2020). LC-ESI-QTOF-MS profiling, protective effects on oxidative damage, and inhibitory activity of enzymes linked to type 2 diabetes and nitric oxide production of Vaccinium corymbosum L. (Ericaceae) extracts. Journal of Berry Research, 10(4), 603–622.
    1. Darwish AG, Das PR, Ismail A, Gajjar P, Balasubramani SP, Sheikh MB, … El-Sharkawy I (2021). Untargeted metabolomics and antioxidant capacities of muscadine grape genotypes during berry development. Antioxidants, 10(6), 914. 10.3390/antiox10060914 - DOI - PMC - PubMed

LinkOut - more resources