

Urinary metabotype of severe asthma evidences decreased carnitine metabolism independent of oral corticosteroid treatment in the U-BIOPRED study
- PMID: 34824054
- PMCID: PMC9245194
- DOI: 10.1183/13993003.01733-2021
Urinary metabotype of severe asthma evidences decreased carnitine metabolism independent of oral corticosteroid treatment in the U-BIOPRED study
Abstract
Introduction: Asthma is a heterogeneous disease with poorly defined phenotypes. Patients with severe asthma often receive multiple treatments including oral corticosteroids (OCS). Treatment may modify the observed metabotype, rendering it challenging to investigate underlying disease mechanisms. Here, we aimed to identify dysregulated metabolic processes in relation to asthma severity and medication.
Methods: Baseline urine was collected prospectively from healthy participants (n=100), patients with mild-to-moderate asthma (n=87) and patients with severe asthma (n=418) in the cross-sectional U-BIOPRED cohort; 12-18-month longitudinal samples were collected from patients with severe asthma (n=305). Metabolomics data were acquired using high-resolution mass spectrometry and analysed using univariate and multivariate methods.
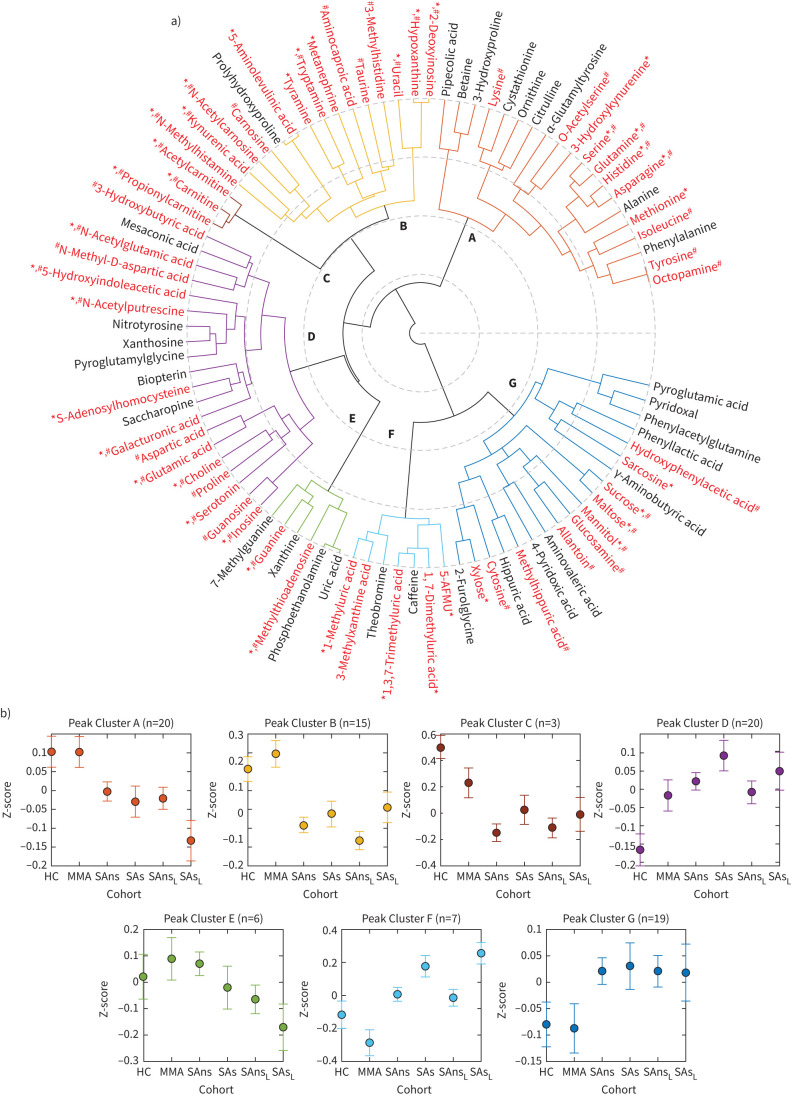
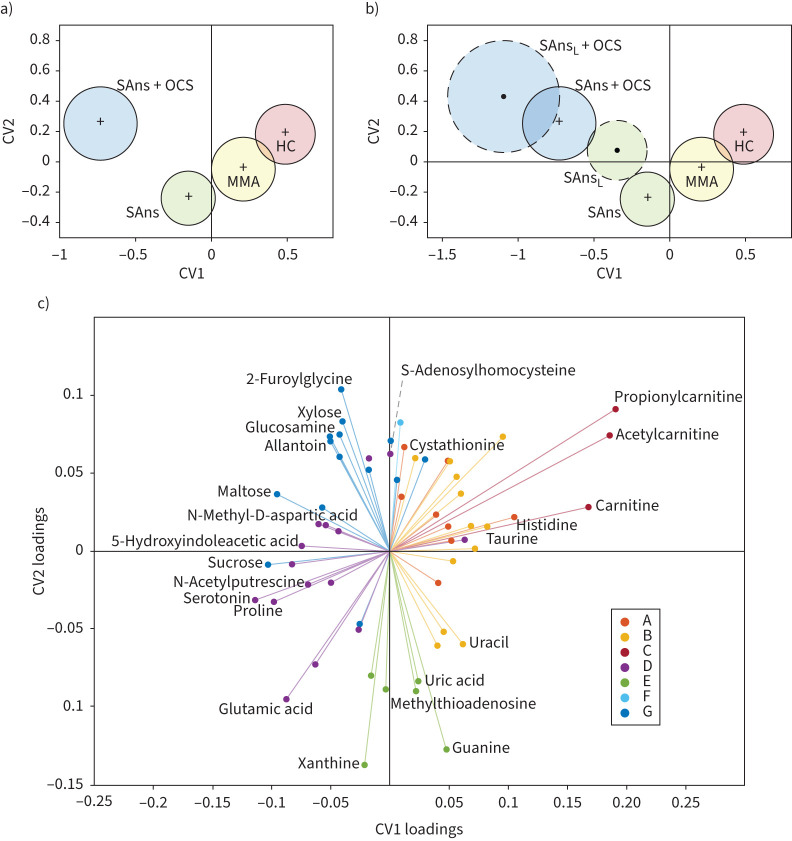
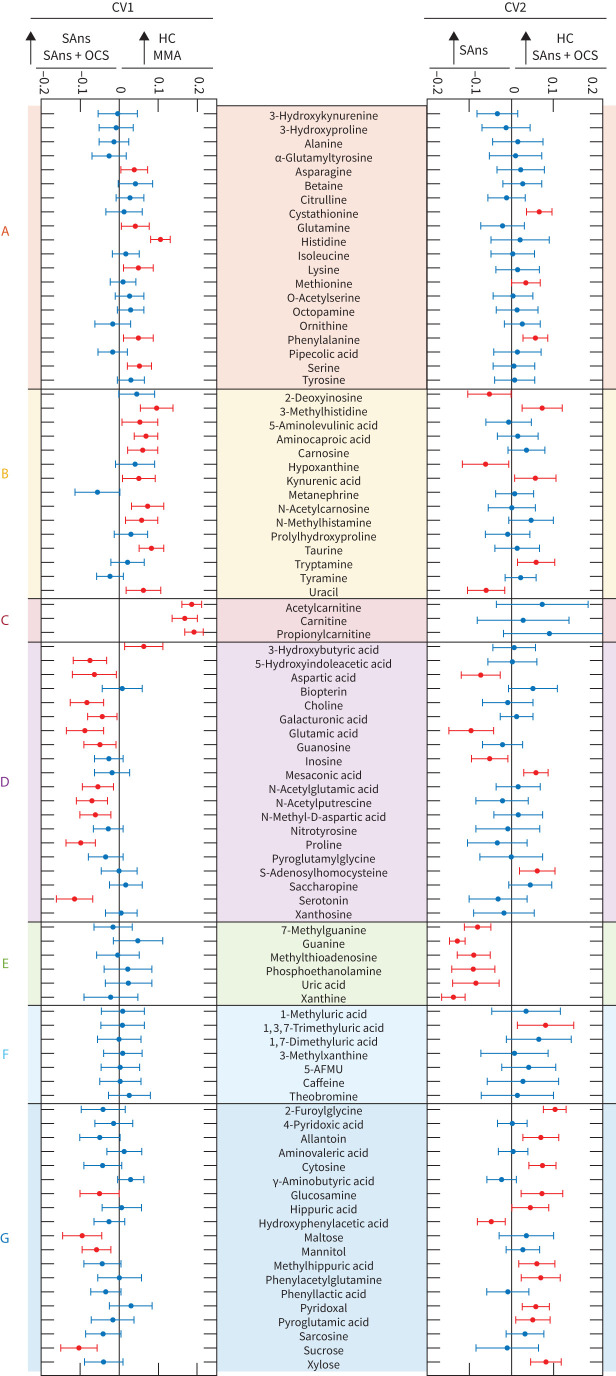
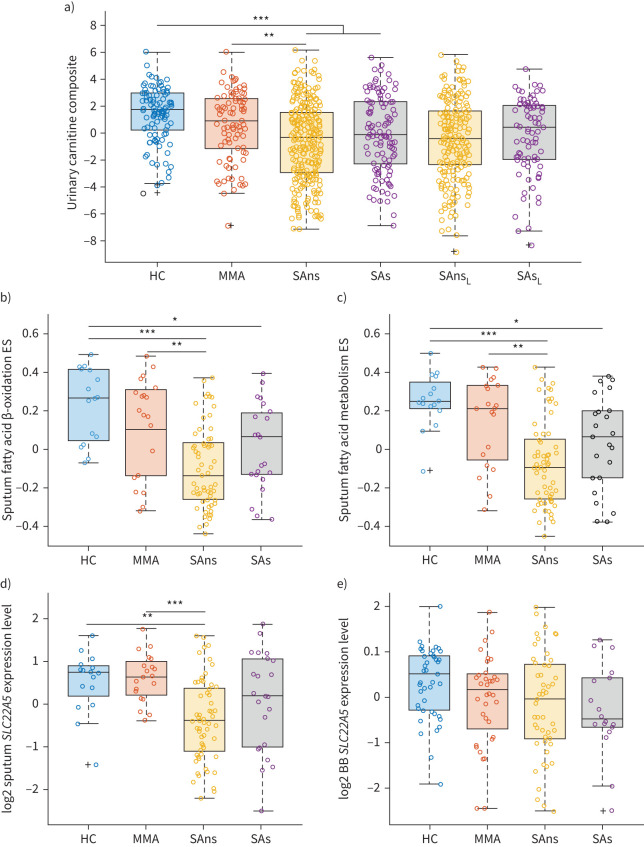
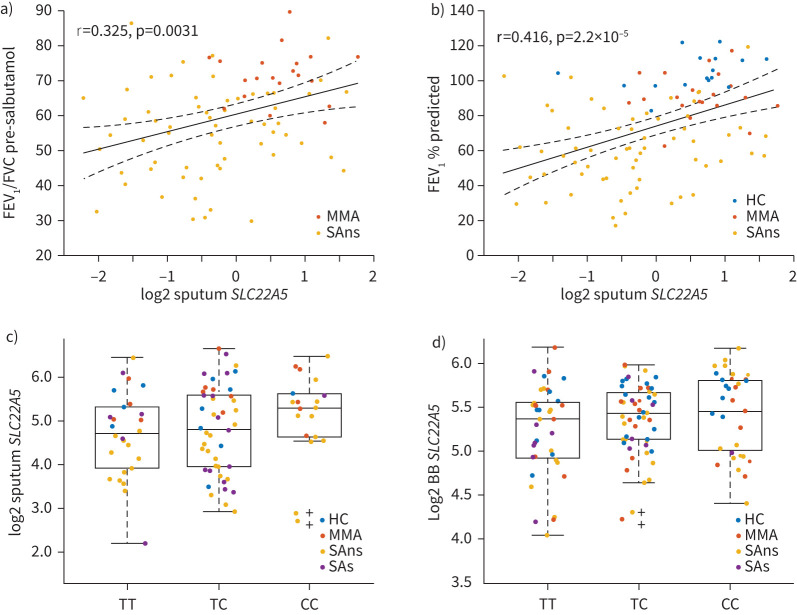
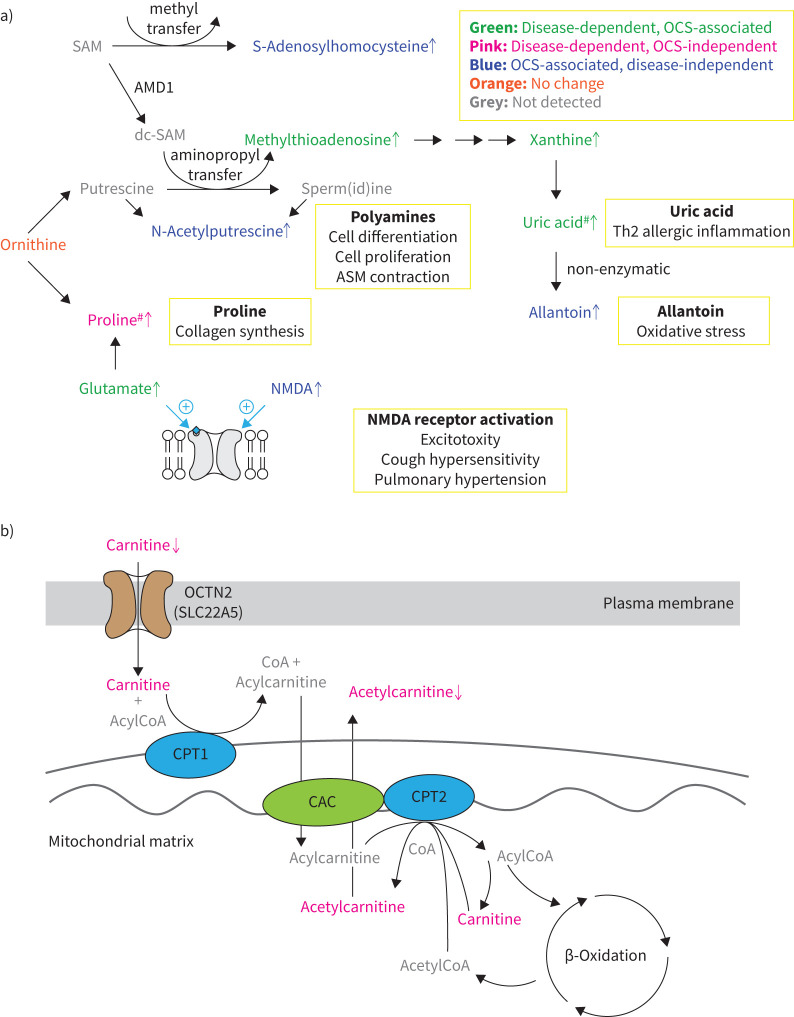
Results: A total of 90 metabolites were identified, with 40 significantly altered (p<0.05, false discovery rate <0.05) in severe asthma and 23 by OCS use. Multivariate modelling showed that observed metabotypes in healthy participants and patients with mild-to-moderate asthma differed significantly from those in patients with severe asthma (p=2.6×10⁻²⁰), OCS-treated asthmatic patients differed significantly from non-treated patients (p=9.5×10⁻⁴), and longitudinal metabotypes demonstrated temporal stability. Carnitine levels evidenced the strongest OCS-independent decrease in severe asthma. Reduced carnitine levels were associated with mitochondrial dysfunction via decreases in pathway enrichment scores of fatty acid metabolism and reduced expression of the carnitine transporter SLC22A5 in sputum and bronchial brushings.
Conclusions: This is the first large-scale study to delineate disease- and OCS-associated metabolic differences in asthma. The widespread associations with different therapies upon the observed metabotypes demonstrate the need to evaluate potential modulating effects on a treatment- and metabolite-specific basis. Altered carnitine metabolism is a potentially actionable therapeutic target that is independent of OCS treatment, highlighting the role of mitochondrial dysfunction in severe asthma.
Trial registration: ClinicalTrials.gov NCT01976767.
Copyright ©The authors 2022.
Conflict of interest statement
Conflict of interest: S.N. Reinke reports grants from Canadian Institutes of Health Research, during the conduct of the study. Conflict of interest: S. Naz has nothing to disclose. Conflict of interest: R. Chaleckis has nothing to disclose. Conflict of interest: H. Gallart-Ayala has nothing to disclose. Conflict of interest: J. Kolmert reports personal fees for consultancy from Gesynta Pharma AB, outside the submitted work. Conflict of interest: N.Z. Kermani has nothing to disclose. Conflict of interest: A. Tiotiu has nothing to disclose. Conflict of interest: D.I. Broadhurst has nothing to disclose. Conflict of interest: A. Lundqvist has nothing to disclose. Conflict of interest: H. Olsson is an employee and shareholder of AstraZeneca. Conflict of interest: M. Ström has nothing to disclose. Conflict of interest: Å.M. Wheelock has nothing to disclose. Conflict of interest: C. Gómez has nothing to disclose. Conflict of interest: M. Ericsson has nothing to disclose. Conflict of interest: A.R. Sousa has nothing to disclose. Conflict of interest: J.H. Riley works for and own shares in GlaxoSmithKline. Conflict of interest: S. Bates is an employee of Johnson & Johnson and has previously worked for and holds stock in GlaxoSmithKline. Conflict of interest: J. Scholfield reports grants from Innovative Medicines Initiative, during the conduct of the study; and is director and employee of TopMD Precision Medicine Ltd. Conflict of interest: M. Loza is an employee of and owns stock in Johnson & Johnson. Conflict of interest: F. Baribaud is a shareholder of Johnson & Johnson and a current employee of Bristol Myers Squibb. Conflict of interest: P.S. Bakke reports personal fees for advisory board work and lectures from AstraZeneca, and personal fees for lectures from Novartis and Boehringer Ingelheim, outside the submitted work. Conflict of interest: M. Caruso has nothing to disclose. Conflict of interest: P. Chanez reports grants and personal fees from AstraZeneca, ALK, Boehringer Ingelheim, Chiesi, Sanofi-Aventis, Novartis and GlaxoSmithKline, outside the submitted work. Conflict of interest: S.J. Fowler reports personal fees from AstraZeneca, Novartis, TEVA and Chiesi, outside the submitted work. Conflict of interest: T. Geiser has nothing to disclose. Conflict of interest: P. Howarth has nothing to disclose. Conflict of interest: I. Horvath has nothing to disclose. Conflict of interest: N. Krug has nothing to disclose. Conflict of interest: P. Montuschi has nothing to disclose. Conflict of interest: A. Behndig has nothing to disclose. Conflict of interest: F. Singer reports personal fees from Vertex Pharmaceuticals (CH) and Novartis, outside the submitted work. Conflict of interest: J. Musial has nothing to disclose. Conflict of interest: D.E. Shaw has nothing to disclose. Conflict of interest: B. Dahlén reports personal fees for advisory board work and lectures from AstraZeneca, TEVA and Sanofi, and grants from Novartis and GlaxoSmithKline, outside the submitted work. Conflict of interest: S. Hu has nothing to disclose. Conflict of interest: J. Lasky-Su has nothing to disclose. Conflict of interest: P.J. Sterk reports a public private grant from the Innovative Medicines Initiative (IMI) covered by the EU and EFPIA, during the conduct of the study. Conflict of interest: K.F. Chung has received honoraria for participating in advisory board meetings of GlaxoSmithKline, AstraZeneca, Roche, Novartis, Merck, Nocion and Shionogi regarding treatments for asthma, COPD and chronic cough and has also been remunerated for speaking engagements. Conflict of interest: R. Djukanovic reports receiving fees for lectures at symposia organised by Novartis, AstraZeneca and TEVA, consultation for TEVA and Novartis as member of advisory boards, and participation in a scientific discussion about asthma organised by GlaxoSmithKline; and is a co-founder and current consultant, and has shares in Synairgen, a University of Southampton spin out company. Conflict of interest: S-E. Dahlén reports personal fees for consultancy from AstraZeneca, Cayman Chemical, GlaxoSmithKline, Novartis, Merck, Regeneron, Sanofi and TEVA, outside the submitted work. Conflict of interest: I.M. Adcock has nothing to disclose. Conflict of interest: C.E. Wheelock has nothing to disclose.
Figures
References
-
- Kolmert J, Gomez C, Balgoma D, et al. Urinary leukotriene E4 and prostaglandin D2 metabolites increase in adult and childhood severe asthma characterised by type 2 inflammation. A clinical observational study. Am J Respir Crit Care Med 2021; 203: 37–53. doi: 10.1164/rccm.201909-1869OC - DOI - PMC - PubMed