. 2021 Nov 25;12(1):6876.
doi: 10.1038/s41467-021-27150-6.

scCODA is a Bayesian model for compositional single-cell data analysis

Affiliations

scCODA is a Bayesian model for compositional single-cell data analysis

M Büttner et al. Nat Commun. .

Abstract

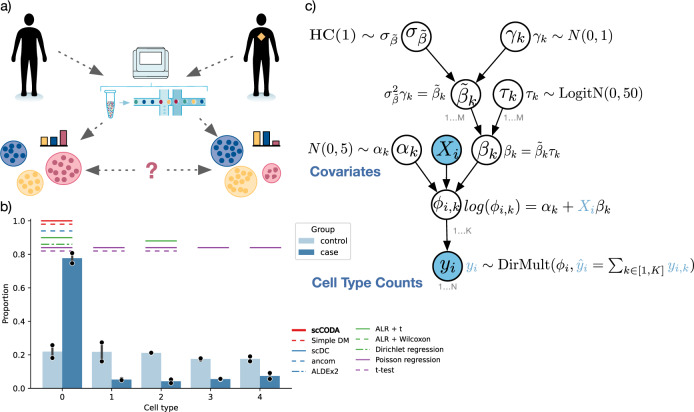
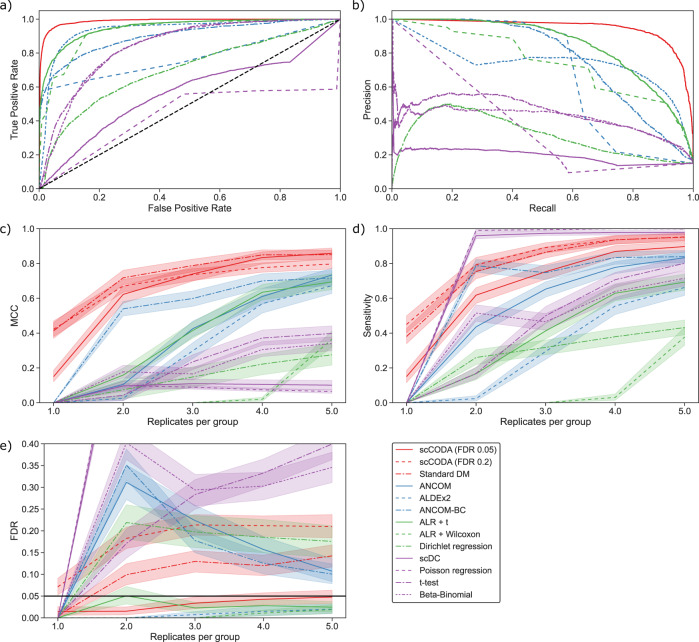
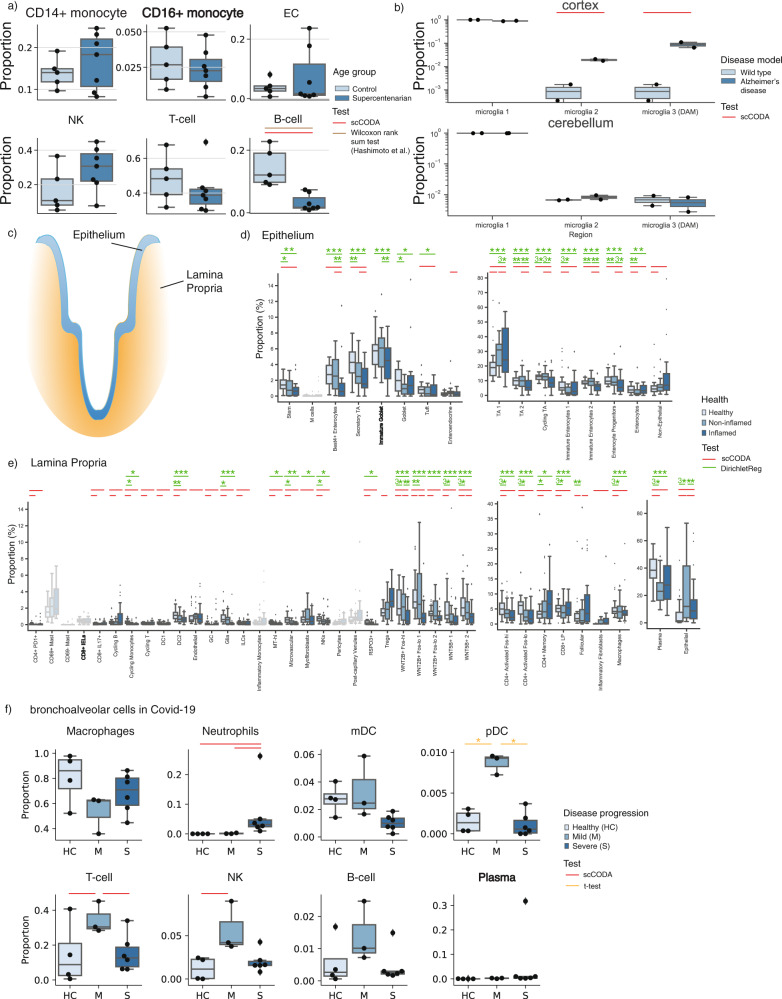
Compositional changes of cell types are main drivers of biological processes. Their detection through single-cell experiments is difficult due to the compositionality of the data and low sample sizes. We introduce scCODA ( https://github.com/theislab/scCODA ), a Bayesian model addressing these issues enabling the study of complex cell type effects in disease, and other stimuli. scCODA demonstrated excellent detection performance, while reliably controlling for false discoveries, and identified experimentally verified cell type changes that were missed in original analyses.


Conflict of interest statement

F.J.T. reports receiving consulting fees from Roche Diagnostics GmbH and Cellarity Inc., and an ownership interest in Cellarity, Inc. The remaining authors declare no competing interests.

Figures

Fig. 1
Fig. 1. Compositional data analysis in single-cell RNA-sequencing data.
a Single-cell analysis of control and disease states of a human tissue sample. Disease states reflect changes in the cell-type composition. b Exemplary realization of the tested scenarios with high compositional log-fold change and low replicate number (n = 2 samples per group). Colored horizontal lines indicate statistically detected compositional changes between case and control for different methods. The error bars denote the 95% confidence interval around the mean. c The scCODA model structure with hyperparameters. Blue variables are observed. DirMult indicates a Dirichlet-Multinomial, N a Normal, logitN a Logit-Normal, and HC a Half-Cauchy distribution.
Fig. 2
Fig. 2. Comparison of scCODA’s benchmark performance to other differential abundance testing methods.
Bayesian models (red), non-standard compositional models (blue), compositional tests/regression (green), non-compositional methods (purple). Shaded areas represent 95% confidence intervals. a Receiver-operating curve (n >1 samples per group). AUC scores are reported in (Supplementary Table 1). b Precision-recall curve (n >1 samples per group). Average precision scores are reported in (Supplementary Table 1). ce Performance metrics with increasing number of replicates per group over all tested scenarios. In the case of n = 1 sample per group, only Bayesian methods are applicable, other methods cannot detect any changes. c Overall performance measured by Matthews’ correlation coefficient (MCC). d Sensitivity measured by true positive rate (TPR). e Precision measured by false discovery rate (FDR). The nominal FDR level of 0.05 for all methods (except scCODA with FDR 0.2) is indicated with a horizontal black line.
Fig. 3
Fig. 3. scCODA determines the compositional changes in a variety of examples.
References are indicated in bold. a Boxplots of blood samples of supercentenarians (n = 7, dark blue) have significantly fewer B cells than younger individuals (control, n = 5, light blue), reference was set to CD16+ Monocytes, Hamiltonian Monte Carlo (HMC) chain length was set to 20,000 with a burn-in of 5000. Credible and significant results are depicted as colored bars (red: scCODA, brown: Wilcoxon rank-sum test (two-sided; Benjamini–Hochberg corrected)). Results are in accordance with FACS data. P values and effect sizes are shown in Supplementary Data 1. b Microglia associated with Alzheimer’s disease (AD) are significantly more abundant in the cortex, but not in the cerebellum (n = 2 in AD (dark blue) and wild-type (light blue) mice, respectively), HMC chain length was set to 20,000 with burn-in of 5000. P values and effect sizes are shown in Supplementary Data 2. ce Changes in epithelium and lamina propria in the human colon in ulcerative colitis (UC) (n = 133 from 18 UC patients, 12 healthy donors). Credible and significant results are depicted as colored bars (red: scCODA, green: two-sided t test of Dirichlet regression coefficients). Stars indicate the significance level (*adjusted P < 0.05, **adjusted P < 0.01, ****adjusted P < 0.001; Benjamini–Hochberg corrected). c Epithelium and Lamina propria are distinct tissues, which are studied separately. d Compositional changes from healthy (light blue) to non-inflamed (medium blue) and inflamed (dark blue) biopsies of the intestinal epithelium, HMC chain length was set to 150,000 with burn-in of 10,000. P values and effect sizes are shown in Supplementary Data 3. e Boxplots of compositional changes from healthy (light blue) to non-inflamed (medium blue) and inflamed (dark blue) biopsies in the lamina propria, HMC chain length was set to 400,000 with burn-in of 10,000. P values and effect sizes are shown in Supplementary Data 3. f Boxplots of compositional changes in bronchoalveolar cells in COVID-19 patients (n = 4 healthy (light blue), n = 3 mild (medium blue), n = 6 severe (dark blue) disease progression). Credible and significant results are depicted as colored bars (red: scCODA, orange: t test (two-sided; Benjamini–Hochberg corrected)), references for scCODA: Plasma (all pairwise comparisons between conditions), FDR at 0.2. Stars indicate the significance level (*: adjusted P < 0.05, **adjusted P < 0.01, ***adjusted P < 0.001; Benjamini–Hochberg corrected), HMC chain length was set to 80,000 with a burn-in of 10,000. P values and effect sizes are shown in Supplementary Data 4. a, b, df In all boxplots, the central line denotes the median, boxes represent the interquartile range (IQR), and whiskers show the distribution except for outliers. Outliers are all points outside 1.5 times of the IQR.

References

    1. Smillie CS, et al. Intra- and inter-cellular rewiring of the human colon during ulcerative colitis. Cell. 2019;178:714–730.e22. doi: 10.1016/j.cell.2019.06.029. - DOI - PMC - PubMed
    1. Pijuan-Sala B, et al. A single-cell molecular map of mouse gastrulation and early organogenesis. Nature. 2019;566:490–495. doi: 10.1038/s41586-019-0933-9. - DOI - PMC - PubMed
    1. Hashimoto K, et al. Single-cell transcriptomics reveals expansion of cytotoxic CD4 T cells in supercentenarians. Proc. Natl Acad. Sci. USA. 2019;116:24242–24251. doi: 10.1073/pnas.1907883116. - DOI - PMC - PubMed
    1. Liao M, et al. Single-cell landscape of bronchoalveolar immune cells in patients with COVID-19. Nat. Med. 2020;26:842–844. doi: 10.1038/s41591-020-0901-9. - DOI - PubMed
    1. Aitchison J. The statistical analysis of compositional data. J. R. Stat. Soc. Ser. B Stat. Methodol. 1982;44:139–160.

Publication types