. 2021 Nov 25;12(1):6839.
doi: 10.1038/s41467-021-27172-0.

Cell-fate transition and determination analysis of mouse male germ cells throughout development

Affiliations

Cell-fate transition and determination analysis of mouse male germ cells throughout development

Jiexiang Zhao et al. Nat Commun. .

Abstract

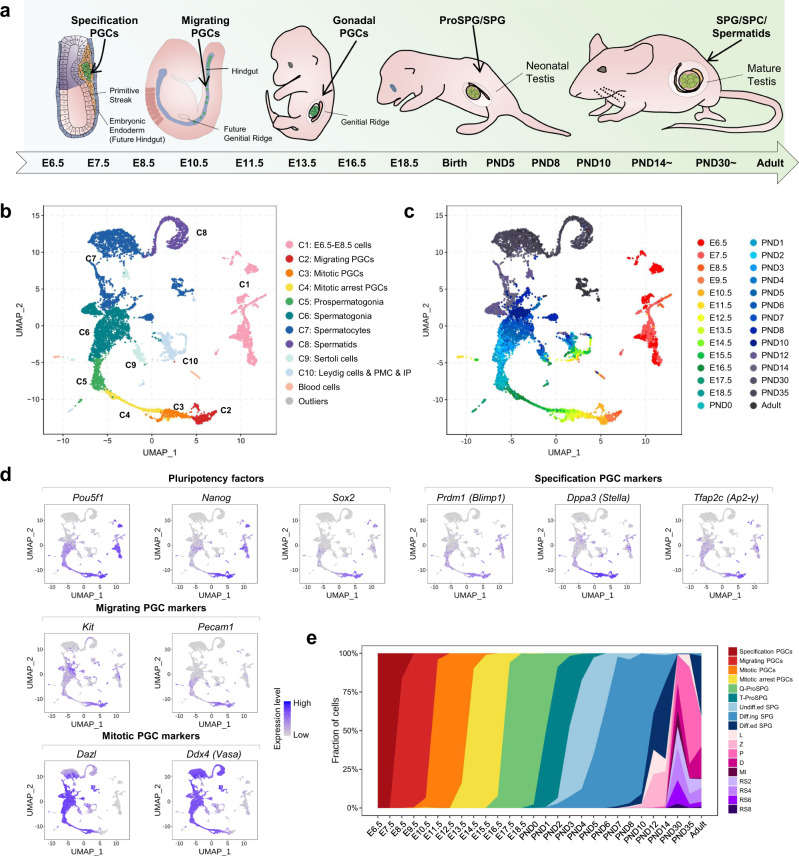
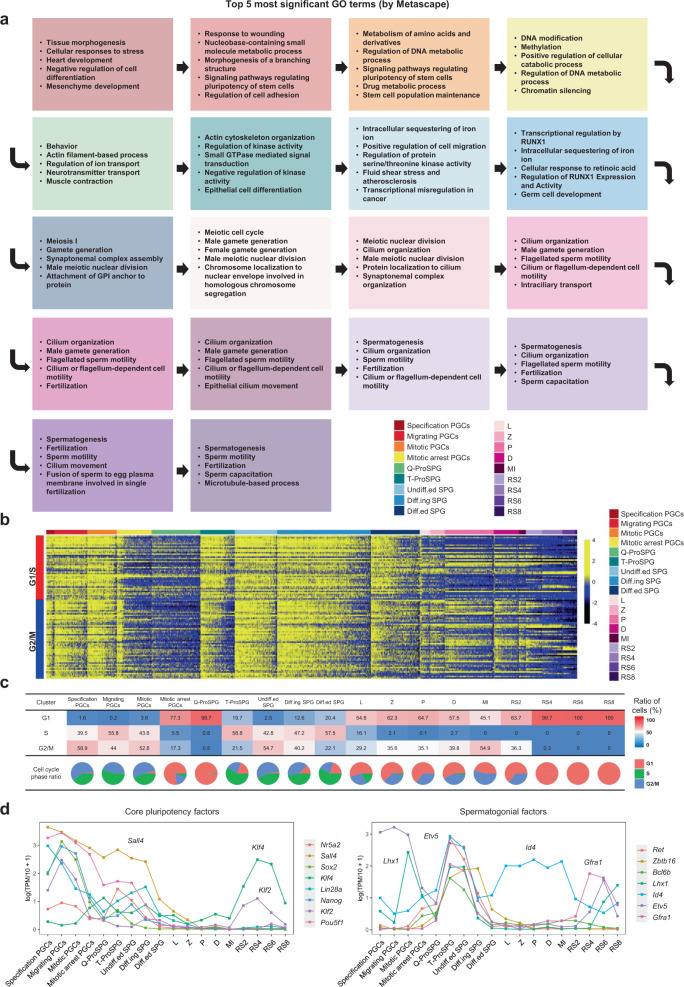
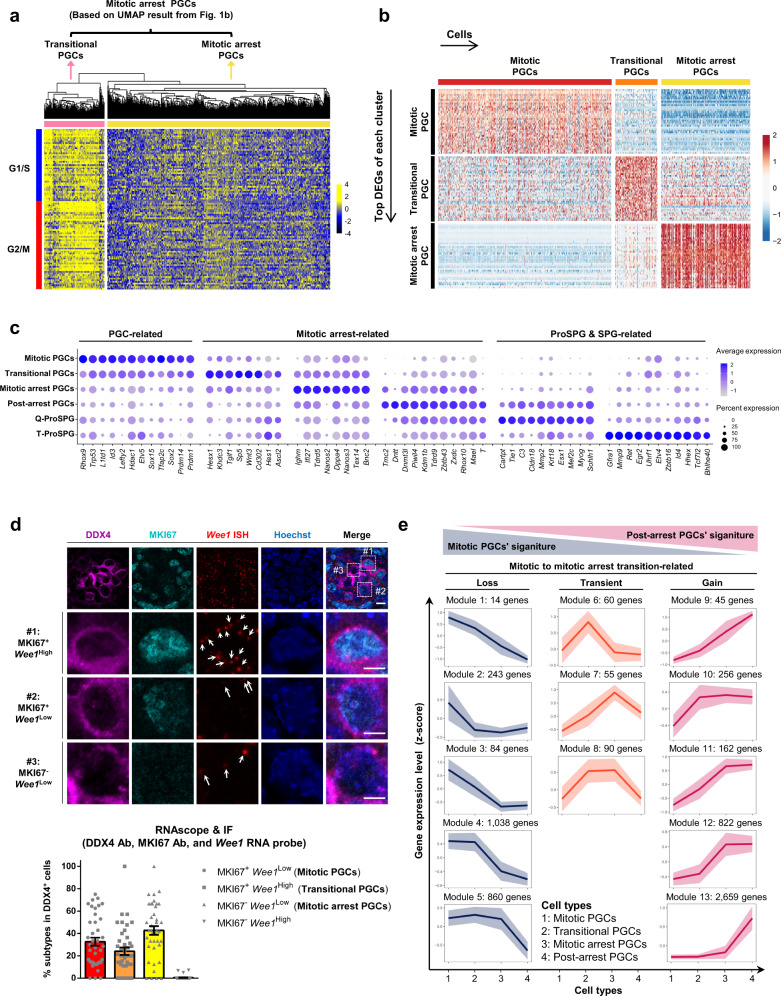
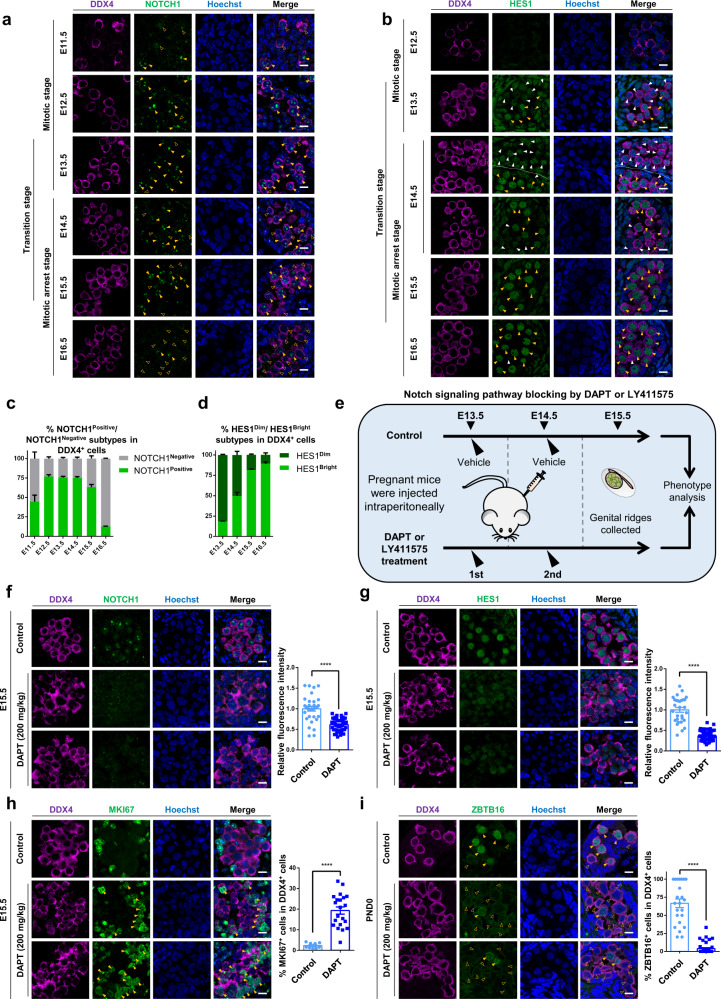
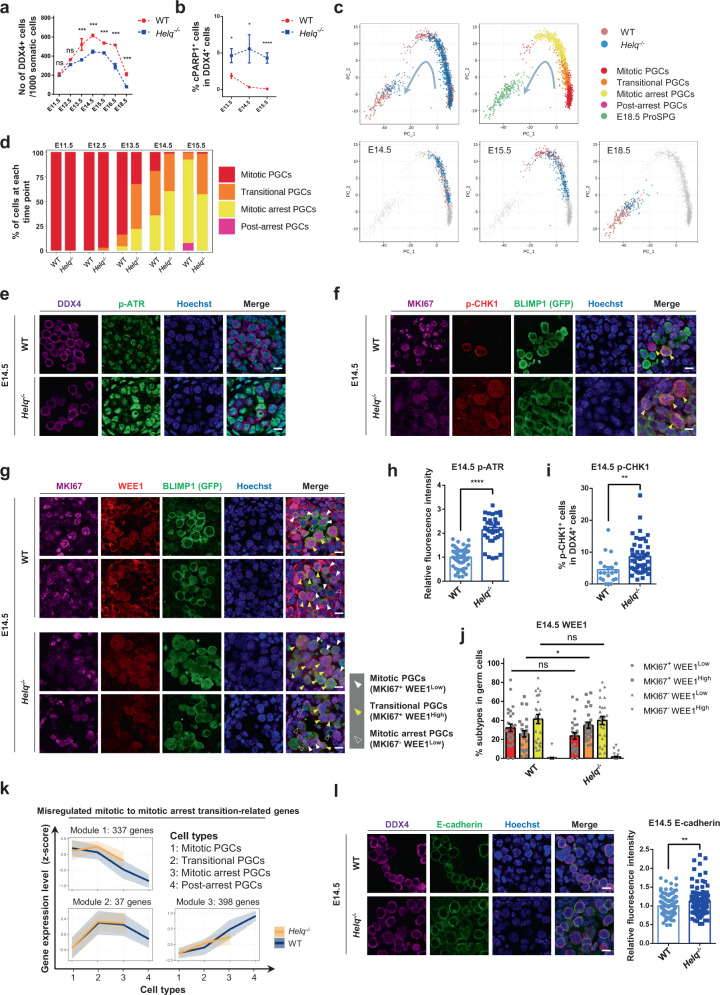
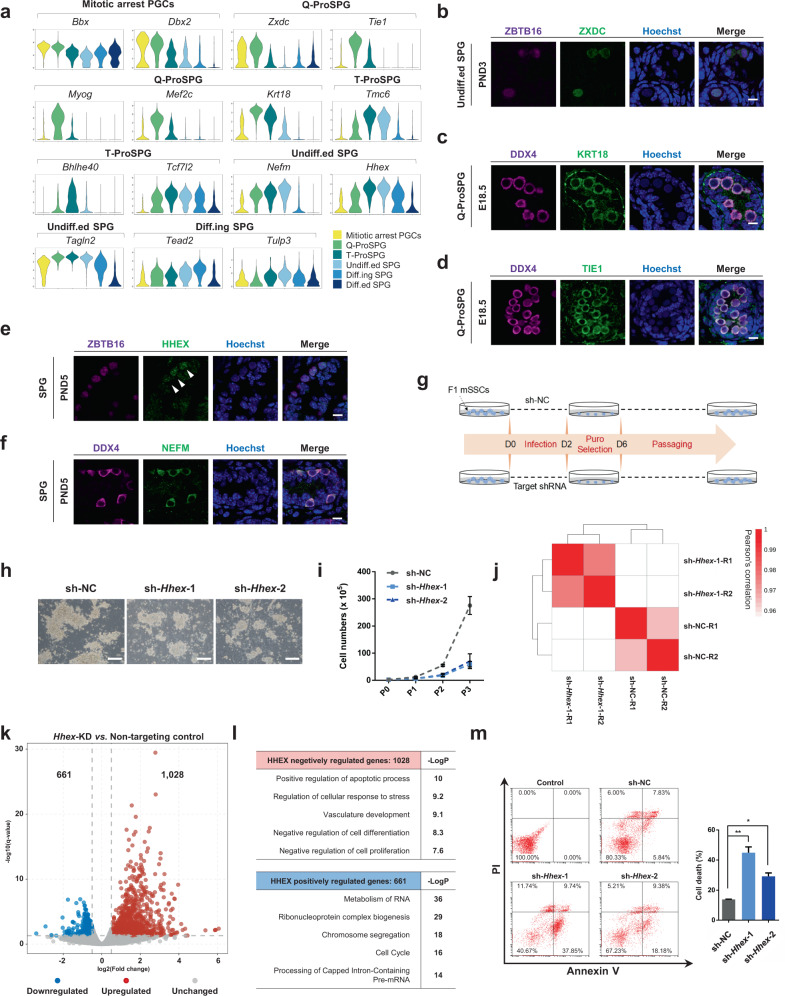
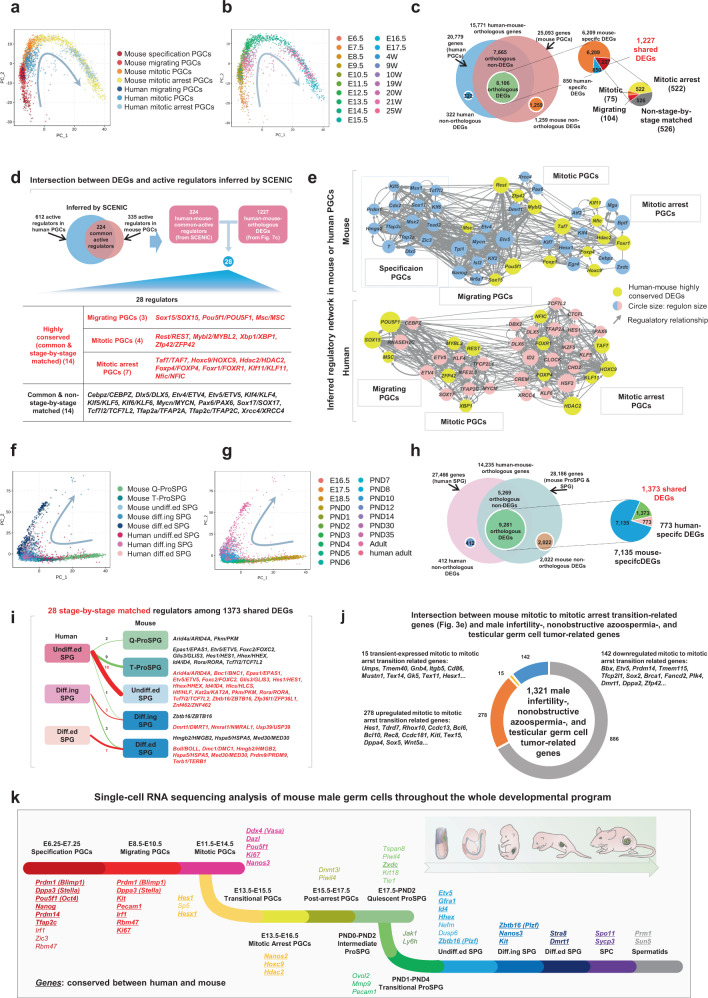
Mammalian male germ cell development is a stepwise cell-fate transition process; however, the full-term developmental profile of male germ cells remains undefined. Here, by interrogating the high-precision transcriptome atlas of 11,598 cells covering 28 critical time-points, we demonstrate that cell-fate transition from mitotic to post-mitotic primordial germ cells is accompanied by transcriptome-scale reconfiguration and a transitional cell state. Notch signaling pathway is essential for initiating mitotic arrest and the maintenance of male germ cells' identities. Ablation of HELQ induces developmental arrest and abnormal transcriptome reprogramming of male germ cells, indicating the importance of cell cycle regulation for proper cell-fate transition. Finally, systematic human-mouse comparison reveals potential regulators whose deficiency contributed to human male infertility via mitotic arrest regulation. Collectively, our study provides an accurate and comprehensive transcriptome atlas of the male germline cycle and allows for an in-depth understanding of the cell-fate transition and determination underlying male germ cell development.


Conflict of interest statement

The authors declare no competing interests.

Figures

Fig. 1
Fig. 1. A single-cell map of mouse male germ cell development.
a Schematic overview of the sampled time-points across mouse male germ cell development. b UMAP (Uniform Manifold Approximation and Projection) plot of the 11,598 mouse germ cells and somatic cells included in this study. Cells are colored by indicated cell types. c UMAP plot of 11,598 mouse germ cells and somatic cells included in this study. Cells are colored by indicated developmental time-points. d UMAP plots are colored by expression levels for selected marker genes. Aliases of some genes are also shown. The color key from gray to blue indicates low to high expression levels. e Proportion of germ cell types across the sampled time-points. L, leptotene; Z, zygotene; P, pachytene; D, diplotene; MI, metaphase I; RS, round spermatids.
Fig. 2
Fig. 2. Transcriptome signatures of mouse male germ cells.
a Top 5 most significant GO terms and P values (-LogP) of 18 germ cell clusters are indicated by distinct colors, respectively. b Heatmap of 97 cell-cycle-related genes in mouse male germ cells. The color key from black to yellow indicates low to high expression levels. L, leptotene; Z, zygotene; P, pachytene; D, diplotene; MI, metaphase I; RS, round spermatids. c Proportion germ cells in one of three cell-cycle phase. d Line plots showing the relative expression levels (log(TPM/10+1)) of previously known core pluripotency factors, and spermatogonial factors in each cell cluster.
Fig. 3
Fig. 3. Mitotic to mitotic arrest transition is companied by global transcriptome reconfiguration.
a Heatmap showing cell-cycle-related genes based hierarchical clustering result of the mitotic arrest PGCs identified from Fig. 1b. The transitional PGCs are clearly subdivided as an independent cell cluster. b Heatmap of the top DEGs of each stage (identified among the mitotic PGCs, transitional PGCs and mitotic arrest PGCs). The color key from blue to red indicates low to high expression levels. c Dotplot showing the expression patterns of gene sets in the mitotic PGCs, transitional PGCs, mitotic arrest PGCs, post-arrest PGCs, Q-ProSPG, and T-ProSPG. Dot size indicates the fraction of cells with detectable expression for a given marker gene and the color key indicates average gene-expression levels in each cell type. d RNAscope of Wee1 co-stained with immunofluorescence of DDX4 and MKI67 antibodies in E14.5 mouse male gonadal sections. Arrows indicate the dots of the probe signals, each representing one copy of the Wee1 mRNA. Scale bar, 10 μm. Detailed images of the indicated germ cells are also shown. Scale bar, 5 μm. Images are obtained using ZEISS LSM880 confocal microscope under a C-Apochromat 63×/1.20 W korr M27 objective lens with 2× scan zoom. Relative proportions of mitotic- (MKI67+ Wee1Low), transitional- (MKI67+ Wee1High), and mitotic arrest PGCs (MKI67 Wee1Low) in the WT mouse male gonads at E14.5 are also shown below. Mean ± SEM, n = 457 cells examined over four biologically independent experiments. e Clustering analysis of dynamic gene expression during mitotic to mitotic arrest transition. Thirteen modules of genes form three distinct categories according to the expression patterns. Gene number per cluster was followed by the module number. Mean of scaled gene-expression level of each module (solid line) was shown with 95% confidence interval (shadow).
Fig. 4
Fig. 4. Notch signaling pathway regulates the mitotic arrest of male PGCs.
a Immunofluorescence of NOTCH1 co-stained with DDX4 in E11.5–E16.5 mouse male gonads. Hollow and solid yellow arrowheads indicate NOTCH1Negative and NOTCH1Positive subtypes in DDX4+ cells, respectively. Scale bar, 10 μm. b Immunofluorescence of HES1 co-stained with DDX4 in E11.5–E16.5 mouse male gonads. White and yellow arrowheads indicate HES1Dim and HES1Bright subtypes in DDX4+ cells, respectively. Scale bar, 10 μm. c Proportion of NOTCH1Negative and NOTCH1Positive subtypes in DDX4+ cells in E11.5–E16.5 mouse male gonads. Mean ± SEM, n = at least 2 biologically independent samples for each time-point. d Proportion of HES1Dim and HES1Bright subtypes in DDX4+ cells in E11.5–E16.5 mouse male gonads. Mean ± SEM, n = at least three biologically independent samples for each time-point. e Schematic showing the workflow of treatment of γ-Secretase inhibitor–DAPT or LY411575 for Notch signaling pathway blocking. f Immunofluorescence of NOTCH1 co-stained with DDX4 and the quantification of relative fluorescence intensity in DAPT-treatment and control mouse male gonads at E15.5. Scale bar, 10 μm. Mean ± SEM, n = 3 per group, **** P < 0.0001, P = 9.5E–13, unpaired two-tailed t test. g Immunofluorescence of HES1 co-stained with DDX4 and the quantification of relative fluorescence intensity in DAPT-treatment and control mouse male gonads at E15.5. Scale bar, 10 μm. Mean ± SEM, n = 3 per group, **** P < 0.0001, P = 4.0E–25, unpaired two-tailed t test. h Immunofluorescence of MKI67 co-stained with DDX4 and proportion of MKI67+ cells in DDX4+ cells in DAPT-treatment and control mouse male gonads at E15.5. Solid yellow arrowheads indicate MKI67Positive subtypes in DDX4+ cells. Scale bar, 10 μm. Mean ± SEM, n = 3 per group, **** P < 0.0001, P = 8.8E–07, unpaired two-tailed t test. i Immunofluorescence of ProSPG and SPG marker ZBTB16 co-stained with DDX4 and proportion of ZBTB16+ cells in DDX4+ cells in DAPT-treatment and control mouse male gonads at PND0. Hollow and solid yellow arrowheads indicate ZBTB16Negative and ZBTB16Positive subtypes in DDX4+ cells, respectively. Scale bar, 10 μm. Mean ± SEM, n = 3 per group, **** P < 0.0001, P = 1.2E–18, unpaired two-tailed t test.
Fig. 5
Fig. 5. Proper mitotic to mitotic arrest transition is crucial for the prenatal development of male germ cells.
a Numbers of DDX4+ cells from E11.5 to E16.5, and E18.5 WT versus Helq−/− mouse male gonads. Mean ± SEM, n = 4 per time-point, ns, not significant, *** P < 0.001, E11.5 (P = 0.5731), E12.5 (P = 0.0706), E13.5 (P = 0.0004), E14.5 (P = 0.0001), E15.5 (P = 0.0004, E16.5 (P = 0.0002), E18.5 (P = 0.0002), unpaired two-tailed t test. b Scatter diagram showing the proportions of cPARP1+ cells in DDX4+ cells from E13.5 to E15.5 in the WT- and Helq−/− mouse male gonads. Mean ± SEM, n = at least 2 per time-point, * P < 0.05, **** P < 0.0001, E13.5 (P = 0.0176), E14.5 (P = 0.0358), E15.5 (P = 7.7E−05), unpaired two-tailed t test. c PCA (Principal component analysis) plots showing the developmental trajectory of 985 WT- and 724 Helq−/− mouse male germ cells sampled between E14.5 and E18.5. The same PCA is also plotted, highlighting only cells from each stage (cell numbers: n = 187, WT; n = 191, Helq−/− for E14.5; n = 185, WT; n = 187, Helq−/− for E15.5; n = 140, WT; n = 72, Helq−/− for E18.5, also see Supplementary Fig. 8a). d Relative proportions of mitotic-, transitional-, mitotic arrest-, and post-arrest PGCs from E11.5 to E15.5 in the WT- versus Helq−/− mouse male gonads. e Immunofluorescence of p-ATR co-stained with DDX4. Scale bar, 10 μm. f Immunofluorescence of p-CHK1 co-stained with MKI67 and BLIMP1 (GFP) in the WT- and Helq−/− mouse male gonads at E14.5. Arrowheads indicate p-CHK1+ subtypes in MKI67+ germ cells. Scale bar, 10 μm. g Immunofluorescence of WEE1 co-stained with MKI67 and BLIMP1 (GFP) in the WT- and Helq−/− mouse male gonads at E14.5. Scale bar, 10 μm. h The quantification of relative fluorescence intensity of p-ATR in the WT- and Helq−/− mouse male germ cells at E14.5. Mean ± SEM, n = 4 per group, **** P < 0.0001, P = 9.1E–19, unpaired two-tailed t test. i Relative proportions of of p-CHK1+ germ cells in the WT- and Helq−/− mouse male germ cells at E14.5. Mean ± SEM, n = 4 per group, ** P < 0.01, P = 0.0029, unpaired two-tailed t test. j Relative proportions of mitotic- (MKI67+ WEE1Low), transitional- (MKI67+ WEE1High), and mitotic arrest PGCs (MKI67 WEE1Low) in the WT- versus Helq−/− mouse male gonads at E14.5. Mean ± SEM, n = 4 per group, ns, not significant, * P < 0.05, MKI67+ WEE1Low (P = 0.1113), MKI67+ WEE1High (P = 0.0488), MKI67 WEE1Low (P = 0.8135), unpaired twotailed t test. k Clustering analysis of the misexpression of mitotic to mitotic arrest transition-related genes expression. Three distinct modules according to the expression patterns were shown. Misregulated gene number per cluster was followed by the module number. Mean of scaled gene-expression level of each module (solid line) was shown with 95% confidence interval (shadow). l Immunofluorescence of E-cadherin co-stained with DDX4 and the quantification of relative fluorescence intensity in the WT- and Helq−/− mouse male gonads at E14.5. Scale bar, 10 μm. Mean ± SEM, n = 4 per group, ** P < 0.01, P = 0.0029, unpaired two-tailed t test.
Fig. 6
Fig. 6. Formation of the spermatogonial stem cell pool.
a Violin plots showing the relative expression levels (log(TPM/10 + 1)) of the identified marker genes of mitotic arrest PGCs, ProSPG and SPG. b Immunofluorescence of ZXDC co-stained with ZBTB16 in PND3 mouse testis. Scale bar, 10 μm. c Immunofluorescence of KRT18 co-stained with DDX4 in E18.5 mouse testis. Scale bar, 10 μm. d Immunofluorescence of TIE1 co-stained with DDX4 in E18.5 mouse testis. Scale bar, 10 μm. e Immunofluorescence of HHEX co-stained with ZBTB16 in PND5 mouse testis. Scale bar, 10 μm. Arrowheads indicate the HHEX+ SPG. f Immunofluorescence of NEFM co-stained with DDX4 in PND5 mouse testis. Scale bar, 10 μm. g Schematic showing the workflow of gene knockdown in mSSCs. h Representative cell morphology of Hhex-knockdown mSSCs compared to control mSSCs transduced with non-targeting shRNA (shNC). Scale bar, 200 μm. i Proliferation of mSSCs upon Hhex knockdown. Data are shown as the mean ± SEM, n = at least 3 biologically independent samples for each group. j Heatmap showing the hierarchically clustered Pearson’s correlation coefficient among different samples based on global gene-expression profiling in bulk cell populations. k Volcano plots showing DEGs (performed by DESeq2 with likelihood ratio test) between the cells transfected with non-targeting shRNA or with shRNAs against Hhex. The number of DEGs (|log2(fold change)|) ≥ 0.5, q-value < 0.05) are shown above the plots. l Representative GO terms of DEGs in Hhex-knockdown mSSCs. m Cell death of Hhex-knockdown mSSCs. Quantitative data are shown as the mean ± SEM to the right, n = 2, * P < 0.05, ** P < 0.01, sh-NC vs. sh-Hhex-1 (P = 0.0074), sh-NC vs. sh-Hhex-2 (P = 0.0109), unpaired two-tailed t test.
Fig. 7
Fig. 7. Interspecies comparison of male germ cell development between human and mouse.
a PCA plots of four phases of mouse male PGCs and three phases of human male PGCs. Cells are colored based on the cell types are shown. b PCA plots of four phases of mouse male PGCs and three phases of human male PGCs. Cells are colored based on the sampled time-points shown. c Pie chart showing the distribution of human-mouse orthologous- and non-orthologous genes in the transcription profiles of mouse male PGCs and human male PGCs. The distribution of stage-by-stage matched and mismatched DEGs are also shown. d Intersection between DEGs and active regulators inferred by SCENIC in mouse male PGCs and human male PGCs. e Inferred regulatory networks of representative regulators in mouse male PGCs (Top) and human male PGCs (Bottom) are shown. Nodes labeled by yellow indicate the human-mouse highly conserved DEGs (common & stage-by-stage matched regulators). f PCA plots of five phases of mouse male ProSPG and SPG and three phases of adult human male SPG. Cells are colored based on the cell types are shown. g PCA plots of five phases of mouse male ProSPG and SPG and three phases of human adult male SPG. Cells are colored based on the sampled time-points. h Venn diagram showing the distribution of human-mouse orthologous- and non-orthologous genes in the transcription profiles of mouse male ProSPG and SPG and adult human male SPG. i 28 stage-by-stage matched regulators among 1,373 shared DEGs are shown. j Intersection between mouse mitotic to mitotic arrest transition-related genes (Fig. 3e) and male infertility-, nonobstructive azoospermia-, and testicular germ cell tumor-related genes. k The cell stages determined by scRNA-seq during mouse male germ cell development are shown in different colors. Genes conserved in humans and mice are bolded and underlined.

Similar articles

Cited by

References

    1. Ewen KA, Koopman P. Mouse germ cell development: from specification to sex determination. Mol. Cell Endocrinol. 2010;323:76–93. - PubMed
    1. Ohinata Y, et al. Blimp1 is a critical determinant of the germ cell lineage in mice. Nature. 2005;436:207–213. - PubMed
    1. Ohinata Y, et al. A signaling principle for the specification of the germ cell lineage in mice. Cell. 2009;137:571–584. - PubMed
    1. Hayashi K, Ohta H, Kurimoto K, Aramaki S, Saitou M. Reconstitution of the mouse germ cell specification pathway in culture by pluripotent stem cells. Cell. 2011;146:519–532. - PubMed
    1. Nakaki F, et al. Induction of mouse germ-cell fate by transcription factors in vitro. Nature. 2013;501:222–226. - PubMed

Publication types

Substances