. 2021 Nov 25;12(1):6895.
doi: 10.1038/s41467-021-27163-1.

SARS-CoV-2 transmission across age groups in France and implications for control

Affiliations

SARS-CoV-2 transmission across age groups in France and implications for control

Cécile Tran Kiem et al. Nat Commun. .

Abstract

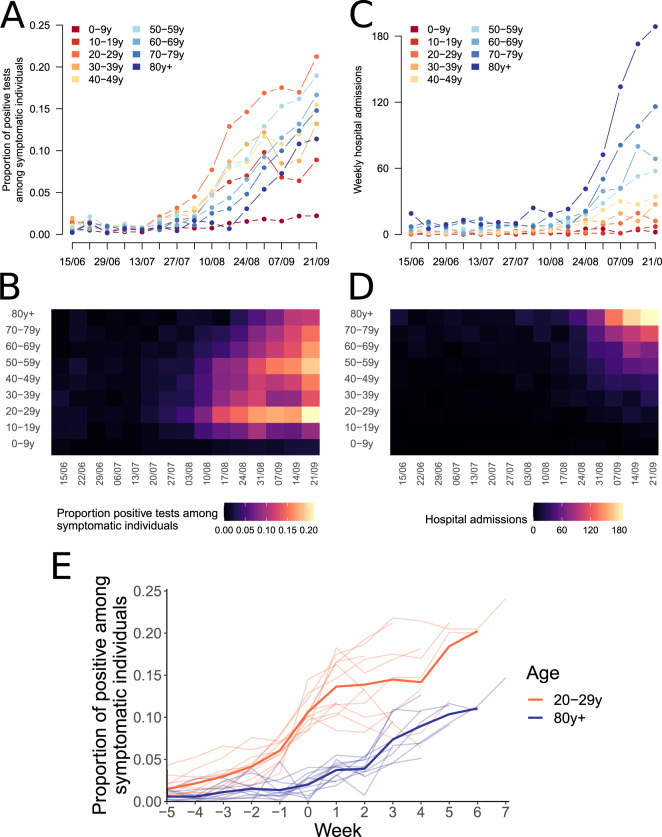
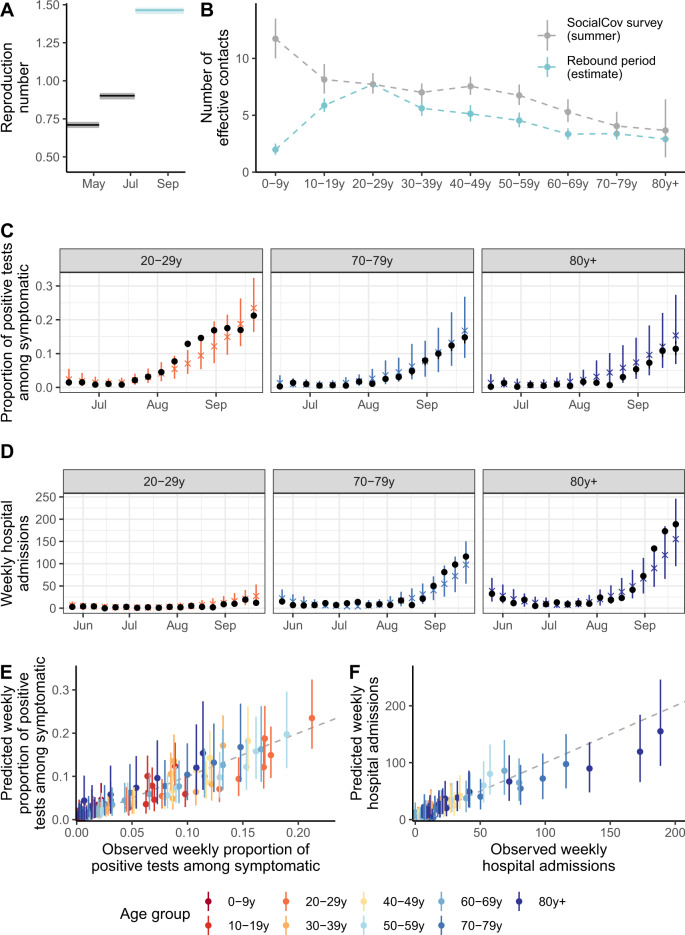
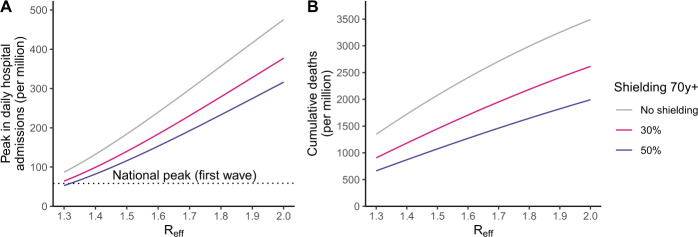
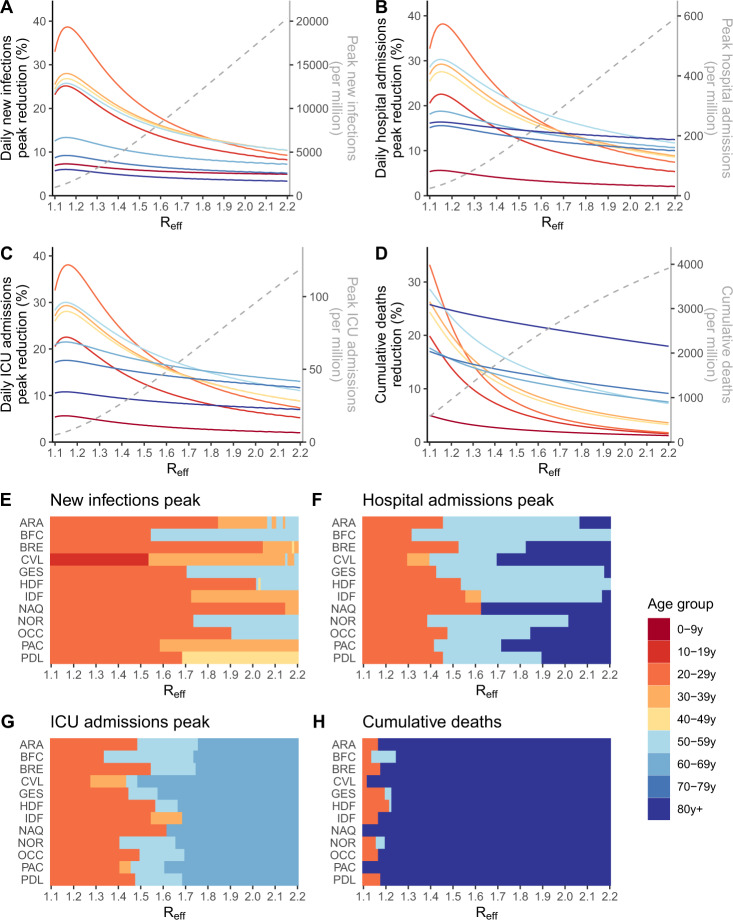
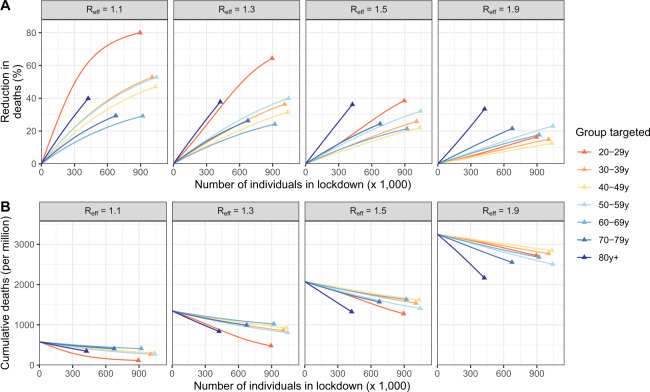
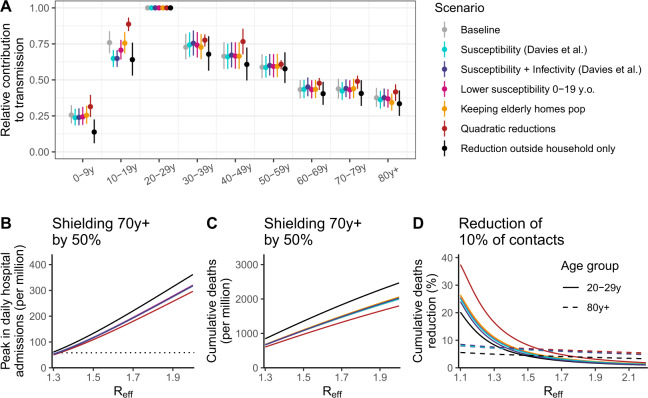
The shielding of older individuals has been proposed to limit COVID-19 hospitalizations while relaxing general social distancing in the absence of vaccines. Evaluating such approaches requires a deep understanding of transmission dynamics across ages. Here, we use detailed age-specific case and hospitalization data to model the rebound in the French epidemic in summer 2020, characterize age-specific transmission dynamics and critically evaluate different age-targeted intervention measures in the absence of vaccines. We find that while the rebound started in young adults, it reached individuals aged ≥80 y.o. after 4 weeks, despite substantial contact reductions, indicating substantial transmission flows across ages. We derive the contribution of each age group to transmission. While shielding older individuals reduces mortality, it is insufficient to allow major relaxations of social distancing. When the epidemic remains manageable (R close to 1), targeting those most contributing to transmission is better than shielding at-risk individuals. Pandemic control requires an effort from all age groups.


Conflict of interest statement

The authors declare no competing interests.

Figures

Fig. 1
Fig. 1. Dynamics of the epidemic rebound by age group.
A, B Weekly proportion of positive tests amongst symptomatic individuals being tested, and C, D weekly number of hospital admissions, by age group in Auvergne-Rhône-Alpes region. E Proportion of positive tests among symptomatic individuals in individuals aged 20–29 yr and older than 80 yr. In panel (E), the light lines represent the trends in the 13 metropolitan French regions. The wider lines indicate the mean proportion of positive among symptomatic across regions. Week 0 corresponds to the first week when the proportion of positive tests among symptomatic individuals aged 20–29 yr reaches 8%.
Fig. 2
Fig. 2. Model predictions for Auvergne-Rhône-Alpes region.
A Intervention reproduction number estimates during the epidemic. B Effective number of contacts estimated for each age group during the rebound period (9 July–27 September). C Predicted and observed weekly proportion of positive tests amongst symptomatic individuals being tested aged 20–29 yr, 70–79 yr, and 80 yr+. D Predicted and observed weekly number of hospitalizations of individuals aged 20–29 yr, 70–79 yr, and 80 yr+. E Predicted and observed weekly proportion of positive tests among symptomatic individuals being tested. F Predicted and observed weekly hospital admissions. In panel (A), the shaded areas correspond to 95% credible intervals obtained from the posterior distribution. The points and vertical segments for the blue curve in panel (B) correspond to the means and 95% credible intervals obtained from the posterior distribution (Markov Chain Monte Carlo (MCMC) chain of 100,000 iterations removing 5000 iterations of burn-in). The points and vertical segments for the gray curve correspond to the observed mean and to 95% bootstrap confidence intervals (10,000 bootstrap samples). The black points in panels (C, D) indicate the data. The colored crosses and vertical segments in panels (C, D) indicate the means and 95% credible intervals obtained from 500 simulations from the posterior distribution. In panels (E, F), each point corresponds to a specific week and age group. The colored points and vertical segments in panels (E, F) indicate the means and 95% credible intervals obtained from 500 simulations from the posterior distribution.
Fig. 3
Fig. 3. Impact of strategies shielding the elderly population.
A Peak in hospital admissions per million, and B number of deaths per million as a function of the effective reproduction number Reff assuming a reduction of 50% or 30% in effective contacts of those older than 70 yr. The number of deaths is computed from the time interventions are implemented until the end of the simulation, corresponding to the period from 28 September 2020 to 1 January 2022. The impact of reducing contacts in individuals aged 70 yr and older in counterfactual simulations was reported according to the effective reproduction number at the start of the simulation. The effective reproduction number decreased over the course of the simulation with increasing immunity.
Fig. 4
Fig. 4. Impact of strategies targeting specific age groups.
Reduction in (A) the peak in daily new infections, (B) the peak in hospital admissions, (C) the peak in daily ICU admissions, (D) the number of deaths when individuals in the target age group reduce their effective contacts by 1, as a function of the effective reproduction number Reff, in the Auvergne-Rhône-Alpes region. The gray dotted lines indicate, in the absence of additional measure, the value of the epidemiological metrics. Age groups for which a reduction of 1 contact results in the highest impact on the reduction of (E) the peak in daily new infections, (F) the peak in hospital admissions, (G) the peak in daily ICU admissions, and (H) the number of deaths as a function of the effective reproduction number Reff. In counterfactual simulations, the impact of reducing 1 effective daily contacts in each age group from the region-specific date of beginning of simulation (Table S4) to 1 January 2022 was compared for different values of the effective reproduction numbers at the beginning of the simulations, which then declined in the simulation with increasing immunity. The number of deaths is computed from the time interventions are implemented until the end of the simulation. Region’s abbreviations are detailed in supplementary text.
Fig. 5
Fig. 5. Impact of targeted strategies as a function of the equivalent number of individuals put into lockdown in the different age groups.
A Percentage reduction in cumulative deaths, and B remaining cumulative deaths in the Auvergne-Rhône-Alpes region for strategies targeting different age groups. The results are presented for different values of the effective reproduction number Reff at the beginning of the simulations, which then declined in the simulation with increasing immunity. Simulations are run for different intensities of targeting. For each targeted strategy, we compute the equivalent number of individuals that would need to be put into lockdown to reach this level. The lockdown of an entire age group corresponds to the triangle.
Fig. 6
Fig. 6. Sensitivity analyses for the Auvergne-Rhône-Alpes region.
A Relative contribution of the different age groups to transmission compared to the 20–29 y.o. age group across a range of scenarios. B Peak in daily hospital admissions (per million inhabitants) assuming a reduction of 50% in contacts of those older than 70 yr across a range of scenarios as a function of the effective reproduction number Reff. C Number of deaths (per million inhabitants) assuming a reduction of 50% in contacts of those older than 70 yr across a range of scenarios as a function of the effective reproduction number Reff. D Reduction in the number of deaths (reported in percentage) as a function of the effective reproduction number Reff for strategies targeting those aged 20–29 yr and those 80 y.o. and older. The horizontal dotted line in panel (B) corresponds to the peak in daily hospital admissions observed at the national level during the first pandemic wave of SARS-CoV-2. The scenarios explored are: Susceptibility (Davies et al.)—using age-specific susceptibilities; Susceptibility + Infectivity (Davies et al.)—using age-specific susceptibilities and infectivities; Lower susceptibility 0–19 y.o.—0–9 y.o. and 10–19 y.o. are, respectively, 50% and 25% less susceptible to SARS-CoV-2 infection than 20 y.o. and older; Keeping elderly homes pop—including the population of elderly homes in the study population; Quadratic reduction—considering quadratic reductions in contact patterns; Reduction outside household only—assuming contact patterns are only modified outside the household. In counterfactual simulations, the impact of the targeted strategies from 28 September 2020 to 1 January 2022 was compared for varying, counterfactual degrees in effective reproduction numbers at the beginning of the simulations, which then declined in the simulation with increasing immunity. In panel (A), the points and vertical segments correspond to the means and 95% credible intervals obtained from the posterior distribution (Markov Chain Monte Carlo (MCMC) chain of 100,000 iterations removing 5000 iterations of burn-in).

References

    1. Salje H, et al. Estimating the burden of SARS-CoV-2 in France. Science. 2020;369:208–211. doi: 10.1126/science.abc3517. - DOI - PMC - PubMed
    1. Flaxman S, et al. Estimating the effects of non-pharmaceutical interventions on COVID-19 in Europe. Nature. 2020;584:257–261. doi: 10.1038/s41586-020-2405-7. - DOI - PubMed
    1. Great Barrington Declaration. https://gbdeclaration.org/ (2020).
    1. Hoertel N, et al. A stochastic agent-based model of the SARS-CoV-2 epidemic in France. Nat. Med. 2020;26:1417–1421. doi: 10.1038/s41591-020-1001-6. - DOI - PubMed
    1. Alwan NA, et al. Scientific consensus on the COVID-19 pandemic: we need to act now. Lancet. 2020;396:e71–e72. doi: 10.1016/S0140-6736(20)32153-X. - DOI - PMC - PubMed

Publication types

MeSH terms

Substances