. 2021 Nov 25;12(1):6917.
doi: 10.1038/s41467-021-27228-1.

Recent changes to Arctic river discharge

Affiliations

Recent changes to Arctic river discharge

Dongmei Feng et al. Nat Commun. .

Abstract

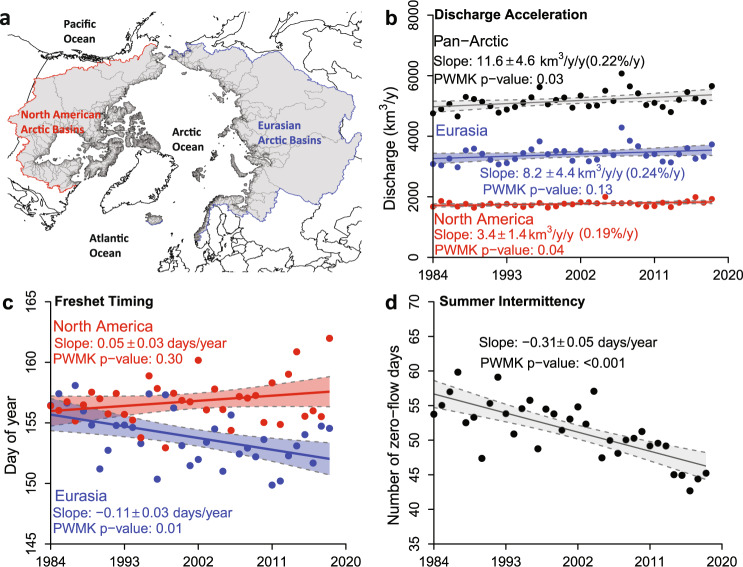
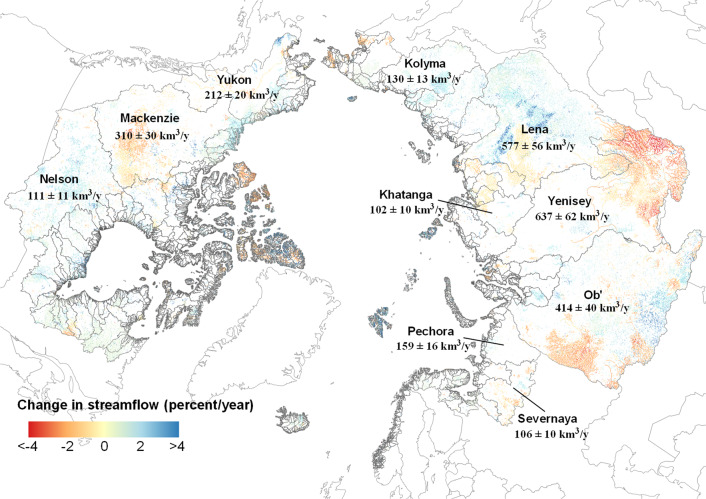
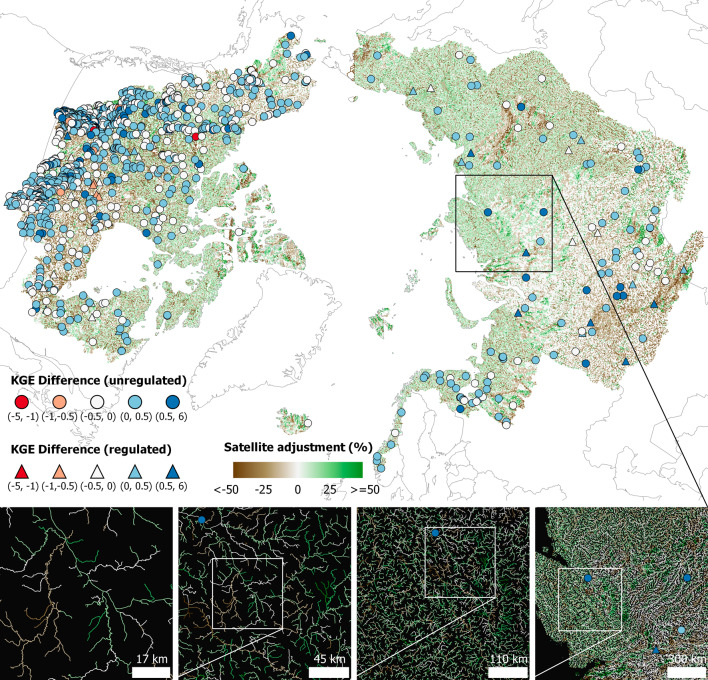
Arctic rivers drain ~15% of the global land surface and significantly influence local communities and economies, freshwater and marine ecosystems, and global climate. However, trusted and public knowledge of pan-Arctic rivers is inadequate, especially for small rivers and across Eurasia, inhibiting understanding of the Arctic response to climate change. Here, we calculate daily streamflow in 486,493 pan-Arctic river reaches from 1984-2018 by assimilating 9.18 million river discharge estimates made from 155,710 satellite images into hydrologic model simulations. We reveal larger and more heterogenous total water export (3-17% greater) and water export acceleration (factor of 1.2-3.3 larger) than previously reported, with substantial differences across basins, ecoregions, stream orders, human regulation, and permafrost regimes. We also find significant changes in the spring freshet and summer stream intermittency. Ultimately, our results represent an updated, publicly available, and more accurate daily understanding of Arctic rivers uniquely enabled by recent advances in hydrologic modeling and remote sensing.


Conflict of interest statement

The authors declare no competing interests.

Figures

Fig. 1
Fig. 1. Changes in total water export, freshet timing, and summer stream intermittency.
a Map showing the pan-Arctic (gray shaded), North American (outlined in red), and Eurasian (outlined in blue) basins; b Water export from rivers shows increasing trends across the Pan-Arctic, Eurasia, and North America during 1984–2018; c The temporal centroid of spring freshet (TCSF) for North American and Eurasian rivers per year shows a significant advance of the TCSF for Eurasia. Data points represent the mean TCSF of all reaches in each region for 1984–2018; d The number of zero-flow days (ZFD) during the open-water period (Apr–Nov) has decreased significantly by 3.1 days/decade for streams prone to intermittency during 1984–2018. Each data point represents the annual average ZFD for all intermittent reaches across the pan-Arctic. The shade in b, c, and d indicates the 95% confidence interval. See Methods for the definitions of total water export, TCSF, ZFD, and intermittent reaches. PWMK refers to the pre-whitening Mann–Kendall test for trend significance.
Fig. 2
Fig. 2. Temporal trends in river discharge during 1984–2018.
Arctic rivers show substantial spatial variations in discharge trends. Only rivers with statistically significant trends are mapped (percent/year, p-value<0.05). Trend significance is calculated using the pre-whitening Mann–Kendall test. The mean annual discharge (km3/y) is labeled for ten major river basins (see more details about its change in Supplementary Table 2).
Fig. 3
Fig. 3. Discharge differences attributed to satellite data.
The satellite adjustment (relative difference, %) between RADR and baseline models in the annual mean discharge at each of 486,493 reaches is shown in a color gradient from brown (less water) to green (more water). Colored circles (for unregulated reaches) and triangles (for regulated reaches) indicate the difference in KGE (Kling-Gupta efficiency, a standard error metric, positive difference indicates improvement) of daily discharge between RADR and baseline model simulations evaluated against 1,079 gauges at the daily scale. See Methods for the definition of the regulated reach and baseline model simulations. The four boxes at the bottom show spatial details of the difference.

References

    1. Rose, A. N. et al., LandScan 2019. Edn. 2019 (Oak Ridge National Laboratory, Oak Ridge, TN; 2020).
    1. Carmack, E.C. in The Freshwater Budget of the Arctic Ocean. (eds. E.L. Lewis, E.P. Jones, P. Lemke, T.D. Prowse & P. Wadhams) 91–126 (Springer Netherlands, 2000).
    1. Carmack EC, et al. Freshwater and its role in the Arctic Marine System: sources, disposition, storage, export, and physical and biogeochemical consequences in the Arctic and global oceans. J. Geophys. Res. Biogeosci. 2016;121:675–717.
    1. Prowse T, Flegg P. The magnitude of river flow to the Arctic Ocean: dependence on contributing area. Hydrological Process. 2000;14:3185–3188.
    1. Dai A, Luo D, Song M, Liu J. Arctic amplification is caused by sea-ice loss under increasing CO2. Nat. Commun. 2019;10:121. - PMC - PubMed

Publication types

LinkOut - more resources