. 2021 Nov 25;12(1):6891.
doi: 10.1038/s41467-021-27273-w.

STAT3 is critical for skeletal development and bone homeostasis by regulating osteogenesis

Affiliations

STAT3 is critical for skeletal development and bone homeostasis by regulating osteogenesis

Siru Zhou et al. Nat Commun. .

Abstract

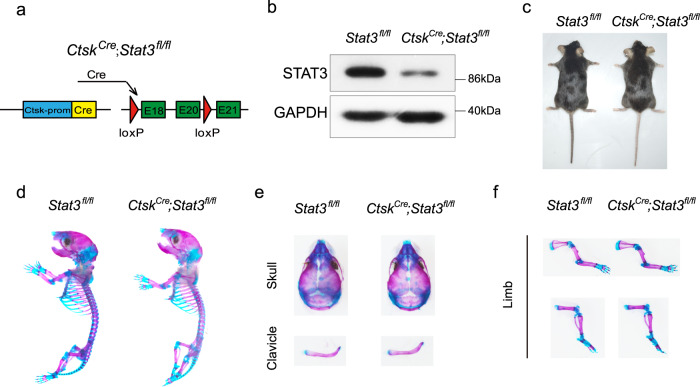
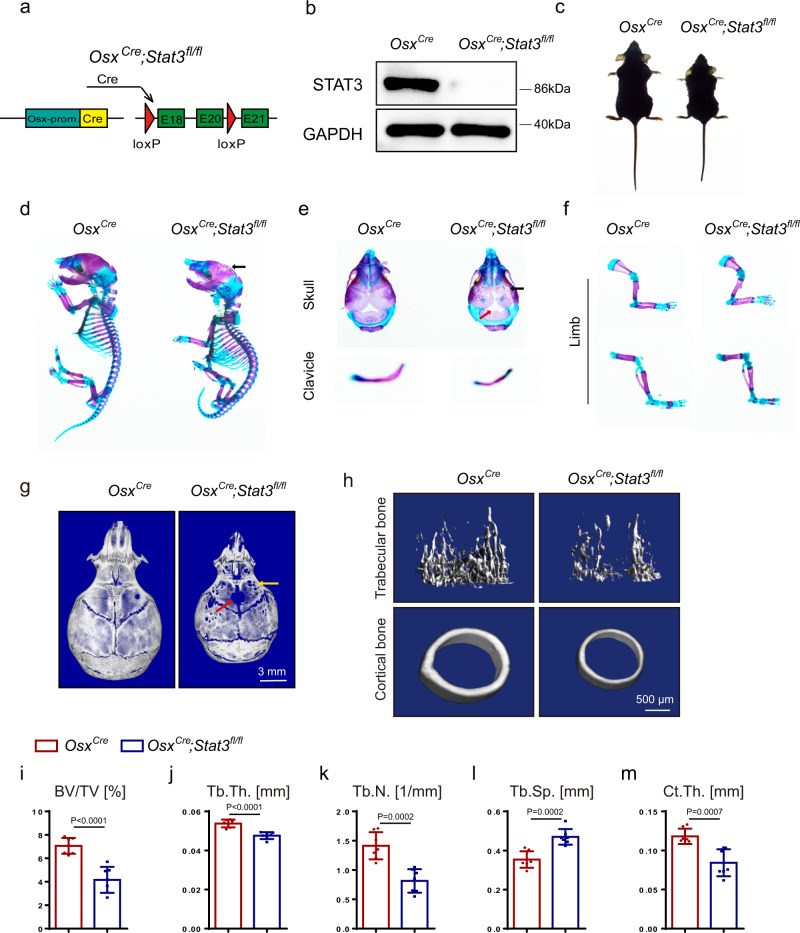
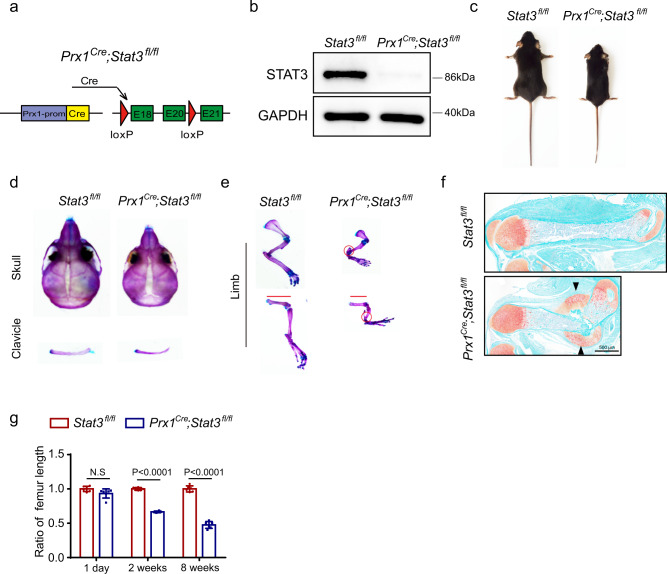
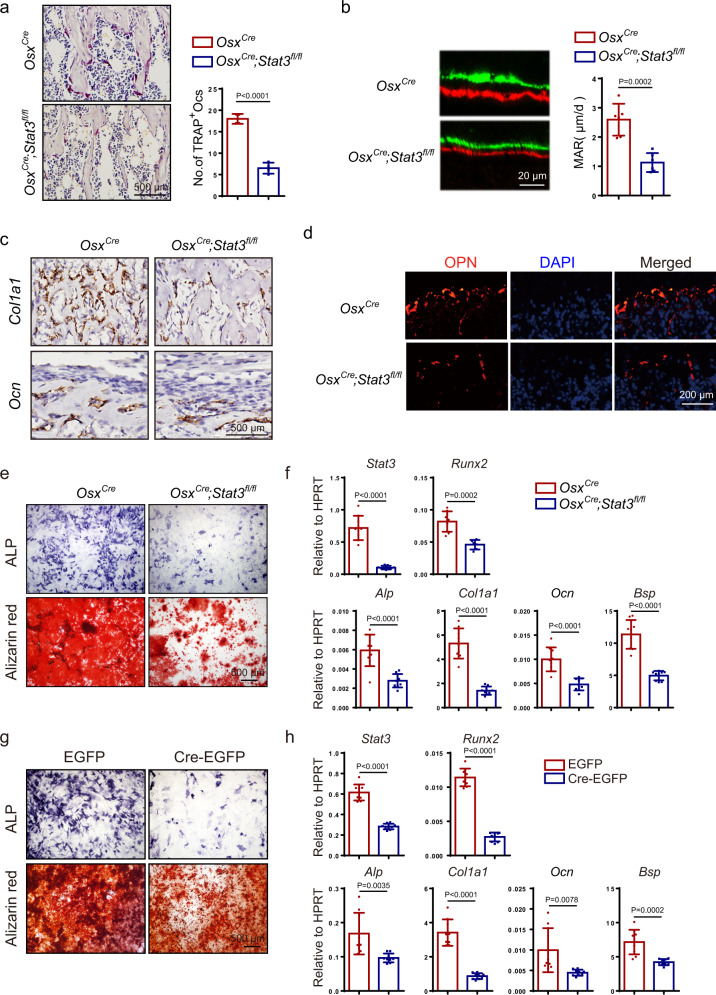
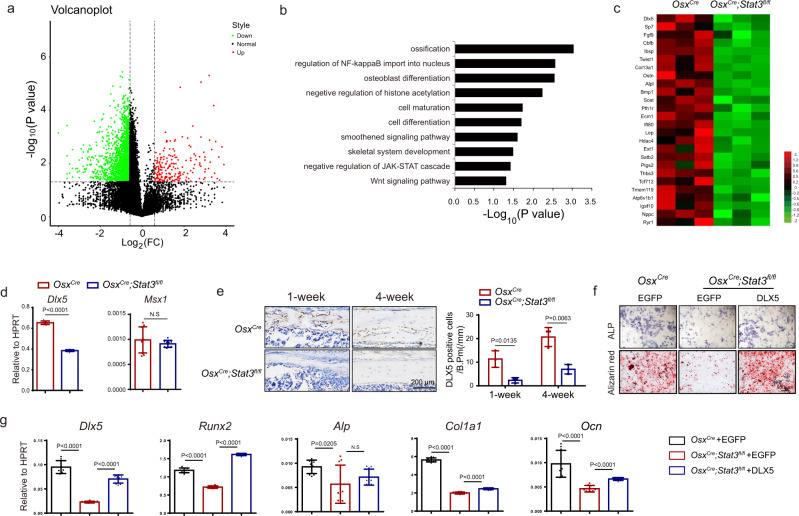
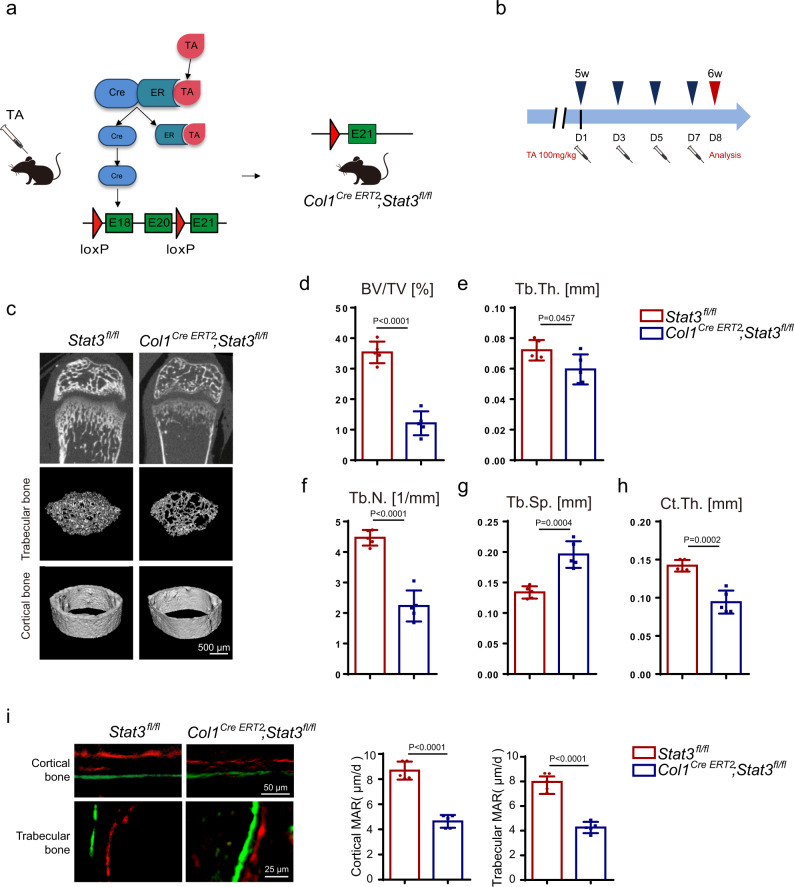
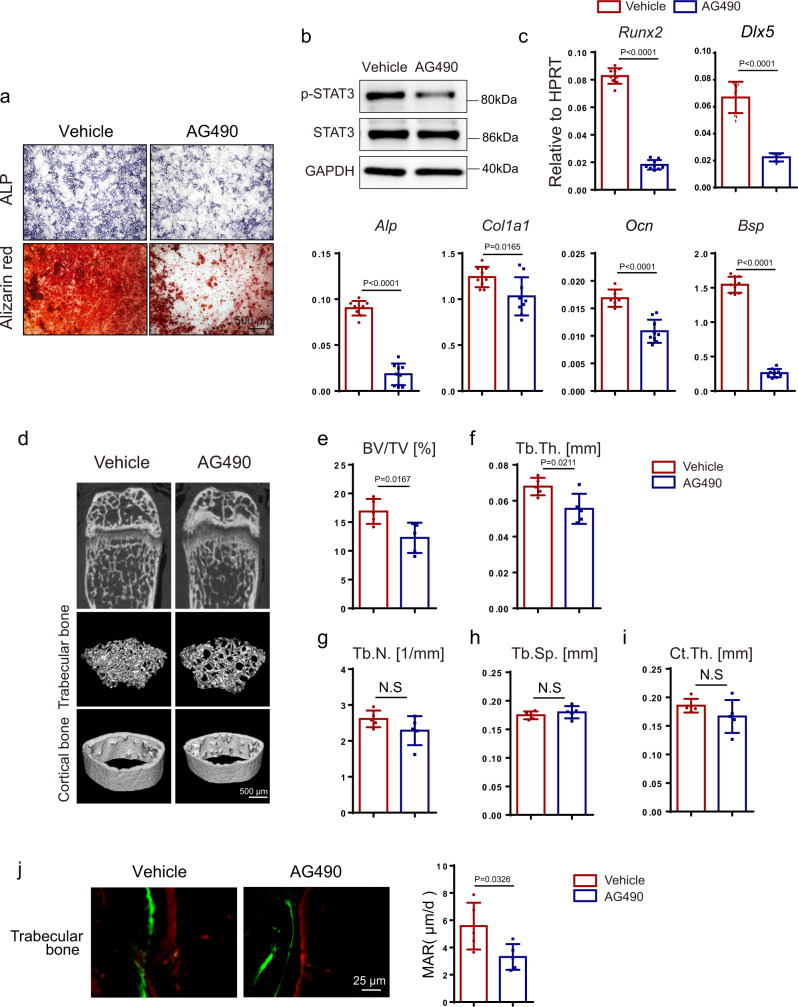
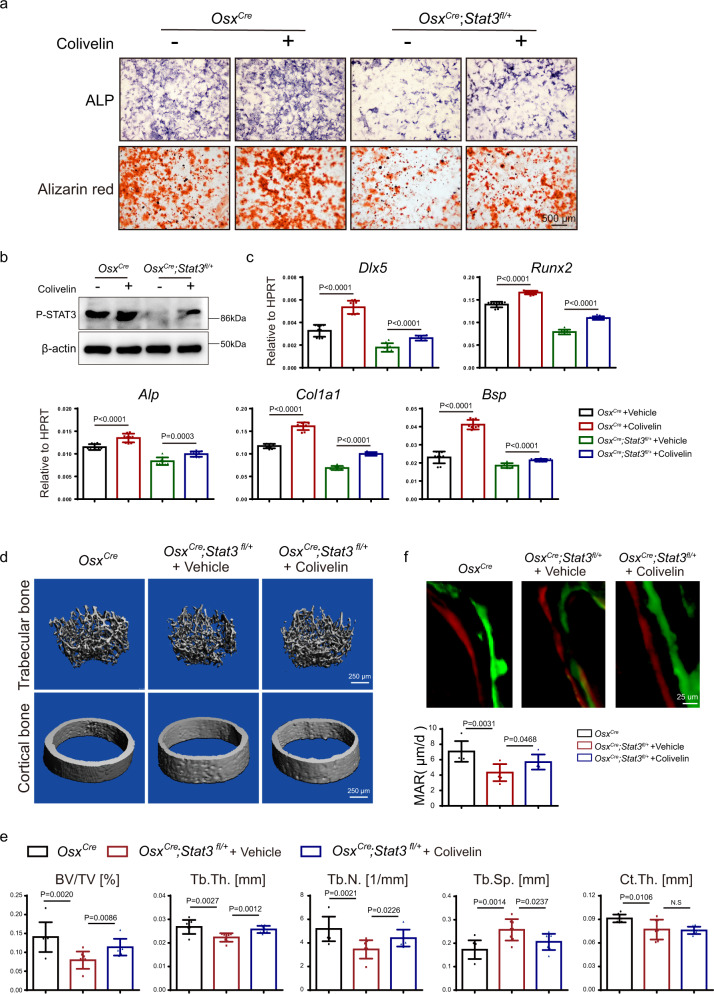
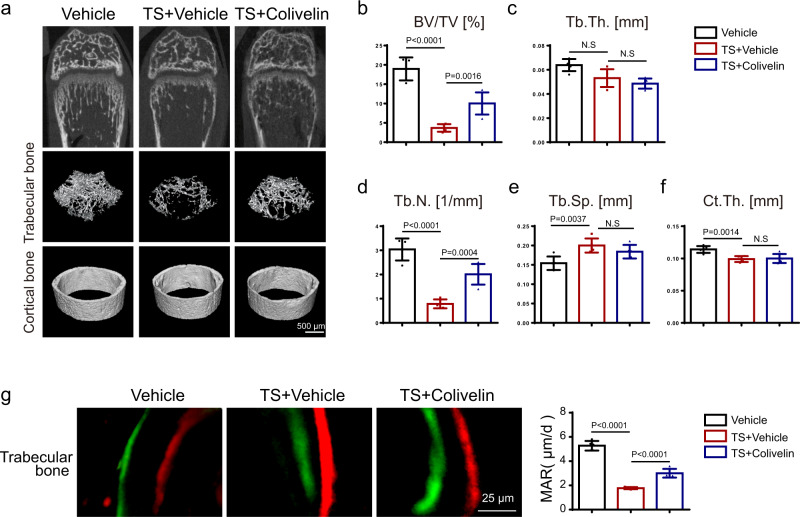
Skeletal deformities are typical AD-HIES manifestations, which are mainly caused by heterozygous and loss-of-function mutations in Signal transducer and activator of transcription 3 (STAT3). However, the mechanism is still unclear and the treatment strategy is limited. Herein, we reported that the mice with Stat3 deletion in osteoblasts, but not in osteoclasts, induced AD-HIES-like skeletal defects, including craniofacial malformation, osteoporosis, and spontaneous bone fracture. Mechanistic analyses revealed that STAT3 in cooperation with Msh homeobox 1(MSX1) drove osteoblast differentiation by promoting Distal-less homeobox 5(Dlx5) transcription. Furthermore, pharmacological activation of STAT3 partially rescued skeletal deformities in heterozygous knockout mice, while inhibition of STAT3 aggravated bone loss. Taken together, these data show that STAT3 is critical for modulating skeletal development and maintaining bone homeostasis through STAT3-indcued osteogenesis and suggest it may be a potential target for treatments.


Conflict of interest statement

The authors declare no competing interests.

Figures

Fig. 1
Fig. 1. Deletion of Stat3 in osteoclasts did not cause AD-HIES-like bone deformities.
a Illustration of Stat3 deletion in Ctsk-expressing osteoclasts. b Western blotting of STAT3 in BMMSs from 4-week-old male Stat3fl/fl and CtskCre;Stat3fl/fl mice cultured with M-CSF and RANKL for 7 days. The experiment was performed twice to similar results. c Representative views of 8-week-old male Stat3fl/fl and CtskCre;Stat3fl/fl mice. df Skeletal preparations from male Stat3fl/fl and CtskCre;Stat3fl/fl newborns were double-stained with alcian blue and alizarin red S. Source data are provided in the Source data file.
Fig. 2
Fig. 2. Deletion of Stat3 in pre-osteoblasts induced skeletal deformities.
a Illustration of Stat3 deletion in Osx-expressing pre-osteoblasts. b Western blotting of STAT3 in BMSCs from 4-week-old male Stat3fl/fl and OsxCre;Stat3fl/fl mice cultured in osteogenic medium for 7 days. The experiment was performed twice to similar results. c Representative views of 8-week-old male OsxCre and OsxCre;Stat3fl/fl mice. df Skeletal preparations from male OsxCre and OsxCre;Stat3fl/fl newborns were double-stained with alcian blue and alizarin red S. Arrows indicate calvarial lesions. g Microcomputed tomography (micro-CT) images of skulls from 4-week-old male OsxCre and OsxCre;Stat3fl/fl mice. Arrows indicate calvarial lesions. h Micro-CT images of distal femurs from 4-week-old male OsxCre and OsxCre;Stat3fl/fl mice. im Quantitative parameters of micro-CT, including bone volume per tissue volume (BV/TV), trabecular thickness (Tb.Th.), trabecular number (Tb.N.), trabecular space (Tb.Sp.), and cortical thickness (Ct.Th). n = 7. Two-tailed Student’s t test. Data represent the mean ± s.d. Source data are provided in the Source data file.
Fig. 3
Fig. 3. Ablation of Stat3 in BMSCs induced bone defects in mice.
a Illustration of Stat3 deletion in Prx1-expressing bone mesenchymal stem cells. b Western blotting of STAT3 in BMSCs from 4-week-old male Stat3fl/fl and Prx1Cre;Stat3fl/fl mice cultured in osteogenic medium for 7 days. The experiment was performed twice to similar results. c Representative views of 8-week-old male Stat3fl/fl and Prx1Cre;Stat3fl/fl mice. d, e Skeletal preparations from 2-week-old male Stat3fl/fl and Prx1Cre;Stat3fl/fl were double-stained with alcian blue and alizarin red S. Red circles represent bone fracture. f Safranin O stain of femurs to show bone fractures in 1-week-old Prx1Cre;Stat3fl/fl mice. Black arrows indicate bony callus. g Statistical analysis of femur length from different ages of Stat3fl/fl and Prx1Cre;Stat3fl/fl mice. n = 6. Two-tailed Student’s t test. Data represent the mean ± s.d. Source data are provided in the Source data file.
Fig. 4
Fig. 4. STAT3-driven osteoblast differentiation and bone formation.
a TRAP staining of femurs from 4-week-old male OsxCre and OsxCre;Stat3fl/fl mice and analysis of the number of TRAP+-multinucleated osteoclasts. n = 4. b Representative images of calcein-alizarin red S double labeling of femurs from 4-week-old male OsxCre and OsxCre;Stat3fl/fl mice and quantitative parameters mineral apposition rate (MAR). n = 6. c In situ hybridization for Col1α1 and Ocn in femurs from 1-week-old male OsxCre and OsxCre;Stat3fl/fl littermates. d Immunofluorescence staining for OPN in distal femurs from 1-week-old male OsxCre and OsxCre;Stat3fl/fl mice. e ALP staining and alizarin red S staining of BMSCs after culture in osteogenic medium for 7 days and 14 days separately. f The relative mRNA levels of Stat3, Runx2, Alp, Col1α1, Ocn, and Bsp in BMSCs after culture in osteogenic medium for 14 days. n = 9. g BMSCs from 4-week-old male Stat3fl/fl mice were infected with adenovirus expressing EGFP or Cre-EGFP for 4 h then induced by osteogenic medium; ALP staining and alizarin red S staining of BMSCs after culture in osteogenic medium for 7 days and 14 days separately. h The relative mRNA levels of Stat3, Runx2, Alp, Col1α1, Ocn, and Bsp were quantified after 14 days of culture in osteogenic medium. n = 9. Two-tailed Student’s t test. Data represent the mean ± s.d. Source data are provided in the Source data file.
Fig. 5
Fig. 5. STAT3 regulated the gene network of osteoblast differentiation.
a Total RNA was isolated from calvaria bone of male OsxCre and OsxCre;Stat3fl/fl newborns, followed by RNA sequencing analysis. Kolmogorov–Smirnov (K–S) test was used for testing the correlation between the OsxCre set and OsxCre;Stat3fl/fl set. Volcano plot displays global gene expression in the OsxCre and OsxCre;Stat3fl/fl sets. Two-sided test. Green represents downregulated genes, red represents upregulated genes. b Gene ontology (GO) enrichment analysis of downregulated genes (>1.5-fold) in the OsxCre;Stat3fl/fl set. c Heatmap analysis of osteoblast-related genes in the OsxCre and OsxCre;Stat3fl/fl sets. d The relative mRNA levels of Dlx5 and Msx1 from the calvaria of OsxCre and OsxCre;Stat3fl/fl newborns were quantified by qPCR. n = 9 e Immunohistochemistry for DLX5 in femurs from 1-week-old and 4-week-old OsxCre and OsxCre;Stat3fl/fl littermates. DLX5-positive cells were counted. n = 3. f BMSCs from 4-week-old male OsxCre and OsxCre;Stat3fl/fl mice were infected with lentivirus expressing EGFP or DLX5 for 24 h then induced by osteogenic medium; ALP staining and alizarin red S staining of BMSCs after culture in osteogenic medium for 7 days and 14 days separately. g The relative mRNA levels of Dlx5, Runx2, Alp, Col1α1, and Ocn were quantified after 14 days of culture in osteogenic medium. n = 9. Two-tailed Student’s t test. Data represent the mean ± s.d. Source data are provided in the Source data file.
Fig. 6
Fig. 6. STAT3 regulated Dlx5 transcription by promoting the activity of its promoter.
a Illustration of predicted STAT3 binding sites on the Dlx5 promoter. b ChIP assay for occupation of STAT3 on the promoter of Dlx5 in the C3H10 cell line. IgG n = 3, STAT3 n = 9. c Effect of STAT3, constitutively-active STAT3 (STAT3-C) and dominant-negative mutation of STAT3 (STAT3-DN) on Dlx5 promoter activity. Dlx5 promoter-driven luciferase reporter was co-transfected with STAT3, STAT3-C, and STAT3-DN expressing plasmid separately in the 293T cell line. After 48 h, the luciferase activity was performed in cell extract supernatants. n = 3. d Effects of potential STAT3 binding site mutations on the activity of Dlx5. STAT3 was co-transfected with the luciferase reporter driven by the Dlx5 promoter (DLX5-Luc) or mutant Dlx5 promoter (Dlx5 promoter with deletion of the two predicted STAT3 binding sites, DLX5-mu-Luc) separately in the 293T cell line, followed by luciferase activity analysis. n = 3. e Co-IP analysis of STAT3 and MSX1. Myc-MSX1 expressing plasmid was co-transfected with or without Flag-STAT3 in the 293T cell line. After 48 h, the whole-cell lysate was used for immunoprecipitation and then immunoblotted with the indicated antibodies. f Co-IP of STAT3 with MSX2. The Co-IP was repeated twice to similar results. g Effect of STAT3 activity on the synergistic promotion of STAT3 and MSX1 on Dlx5 promoter activity. MSX1 and DLX5-Luc were co-transfected with STAT-C or STAT3-DN into the 293T cell line followed by luciferase activity analysis. n = 3. h Effect of STAT3 binding sites on the synergistic promotion of STAT3 and MSX1 on the Dlx5 promoter activity. STAT3-C and MSX1 were co-transfected with the luciferase reporter driven by the Dlx5 promoter or mutant Dlx5 promoter into the 293T cell line, followed by luciferase activity analysis. n = 3. i Four mutants (R382W, R382Q, V637M, and T714A) were shown on the STAT3 domains. j Effect of STAT3 wild type (WT) and four mutants (R382W, R382Q, V637M, and T714A) on Dlx5 promoter activity. n = 3. k Effect of various STAT3 mutants activity on the synergistic promotion of STAT3 and MSX1 on Dlx5 promoter activity. n = 3. Two-tailed Student’s t test. Data represent the mean ± s.d. Source data are provided in the Source data file.
Fig. 7
Fig. 7. Inducible osteoblastic deletion of Stat3 impaired bone formation and reduced bone mass in adult mice.
a Illustration of inducible Stat3 deletion in Col1a1-expressing osteoblast lineage cells (specifically, the mouse icon is bought from https://www.shutterstock.com). When Col1Cre ERT2;Stat3fl/fl mice were injected with tamoxifen, Cre translocated to the nucleus and exon 18 to 20 domain were deleted (TA: tamoxifen). b Scheme of the experiment: 5-week-old male Stat3fl/fl and Col1Cre ERT2;Stat3fl/fl mice were injected with tamoxifen (100 mg/kg) for 7 days and euthanized for analysis. c Micro-CT images of the distal femurs from 6-week-old Stat3fl/fl and Col1Cre ERT2;Stat3fl/fl mice. dh Quantitative parameters of micro-CT, including BV/TV, Tb.Th., Tb.N., Tb.Sp., and Ct.Th. n = 5. i Images of calcein-alizarin red S double labeling of femurs from 6-week-old Stat3fl/fl and Col1Cre ERT2;Stat3fl/fl mice and quantitative parameters of MAR. n = 5. Two-tailed Student’s t test. Data represent the mean ± s.d. Source data are provided in the Source data file.
Fig. 8
Fig. 8. Pharmacological inhibition of STAT3 activity inhibited osteoblast differentiation and induced bone loss by impairing osteogenesis.
a ALP staining and alizarin red S staining of BMSCs after culture in osteogenic medium with or without AG490 for 7 and 14 days separately. b Expression of p-STAT3 and STAT3 in BMSCs with or without AG490 for 12 h analyzed by western blotting. The experiment was performed twice to similar results. c The relative mRNA levels of Runx2, Dlx5, Alp, Col1α1, Ocn, and Bsp in BMSCs with or without AG490 for 14 days were quantified by qPCR. n = 9. d Micro-CT images of distal femurs from 9-week-old vehicle and AG490-injected mice. Four-week-old male mice were injected with or without 5 mg/kg AG490 daily for 5 weeks. ei Quantitative parameters of micro-CT, including BV/TV, Tb.Th., Tb.N., Tb.Sp., and Ct.Th. n = 5. j Images of calcein-alizarin red S double labeling of femurs from 9-week-old mice with or without AG490 and quantitative parameters of MAR. n = 5. Two-tailed Student’s t test. Data represent the mean ± s.d. Source data are provided in the Source data file.
Fig. 9
Fig. 9. Administration of colivelin promoted osteoblast differentiation and partially rescued bone loss in heterozygous pre-osteoblast-specific Stat3 deletion mice.
a ALP and alizarin red S staining of BMSCs from OsxCre, OsxCre;Stat3fl/+ mice after culture in osteogenic medium with or without colivelin for 7 and 14 days separately. b Expression of p-STAT3 in BMSCs from OsxCre, OsxCre;Stat3fl/+ mice treated with or without colivelin for 12 h analyzed by western blotting. The experiment was performed twice to similar results. c The relative mRNA levels of Dlx5, Runx2, Alp, Col1α1, and Bsp in BMSCs with or without Colivelin for 14 days were quantified by qPCR. n = 9. d Micro-CT images of distal femurs from 4-week-old male OsxCre, OsxCre;Stat3fl/++Vehicle, and OsxCre;Stat3fl/++ Colivelin group mice. One-week-old male OsxCre;Stat3fl/+ mice were used to treat with or without 1.5 mg/kg colivelin every day for 3 weeks. e Quantitative parameters of micro-CT, including BV/TV, Tb.Th., Tb.N., Tb.Sp., and Ct.Th. n = 8. f Images of calcein-alizarin red S double labeling of femurs from 4-week-old male OsxCre, OsxCre;Stat3fl/++Vehicle and OsxCre;Stat3fl/++ Colivelin group mice and quantitative parameters of MAR. n = 6. Two-tailed Student’s t test. Data represent the mean ± s.d. Source data are provided in the Source data file.
Fig. 10
Fig. 10. Pharmacological activation of STAT3 activity promoted osteoblast differentiation and partially prevented bone mass loss induced by tail suspension by promoting osteogenesis.
a Micro-CT images of distal femurs from 5-week-old Vehicle, TS + Vehicle, and TS + Colivelin group mice. Four-week-old male mice were used to perform the tail suspension model with or without 1 mg/kg colivelin every day for 1 week. bf Quantitative parameters of micro-CT, including BV/TV, Tb.Th., Tb.N., Tb.Sp., and Ct.Th. n = 5. g Images of calcein-alizarin red S double labeling of femurs from 5-week-old Vehicle, TS + Vehicle, and TS + Colivelin group mice and quantitative parameters of MAR. n = 5. Two-tailed Student’s t test. Data represent the mean ± s.d. Source data are provided in the Source data file.

References

    1. Grimbacher B, Holland SM, Puck JM. Hyper-IgE syndromes. Immunological Rev. 2005;203:244–250. - PubMed
    1. Minegishi Y, et al. Dominant-negative mutations in the DNA-binding domain of STAT3 cause hyper-IgE syndrome. Nature. 2007;448:1058–1062. - PubMed
    1. Holland SM, et al. STAT3 mutations in the hyper-IgE syndrome. N. Engl. J. Med. 2007;357:1608–1619. - PubMed
    1. Grimbacher B, et al. Hyper-IgE syndrome with recurrent infections—an autosomal dominant multisystem disorder. N. Engl. J. Med. 1999;340:692–702. - PubMed
    1. Schwerd T, et al. A biallelic mutation in IL6ST encoding the GP130 co-receptor causes immunodeficiency and craniosynostosis. J. Exp. Med. 2017;214:2547–2562. - PMC - PubMed

MeSH terms