. 2021 Nov 25;12(1):6870.
doi: 10.1038/s41467-021-27233-4.

A H2O2-activatable nanoprobe for diagnosing interstitial cystitis and liver ischemia-reperfusion injury via multispectral optoacoustic tomography and NIR-II fluorescent imaging

Affiliations

A H2O2-activatable nanoprobe for diagnosing interstitial cystitis and liver ischemia-reperfusion injury via multispectral optoacoustic tomography and NIR-II fluorescent imaging

Junjie Chen et al. Nat Commun. .

Abstract

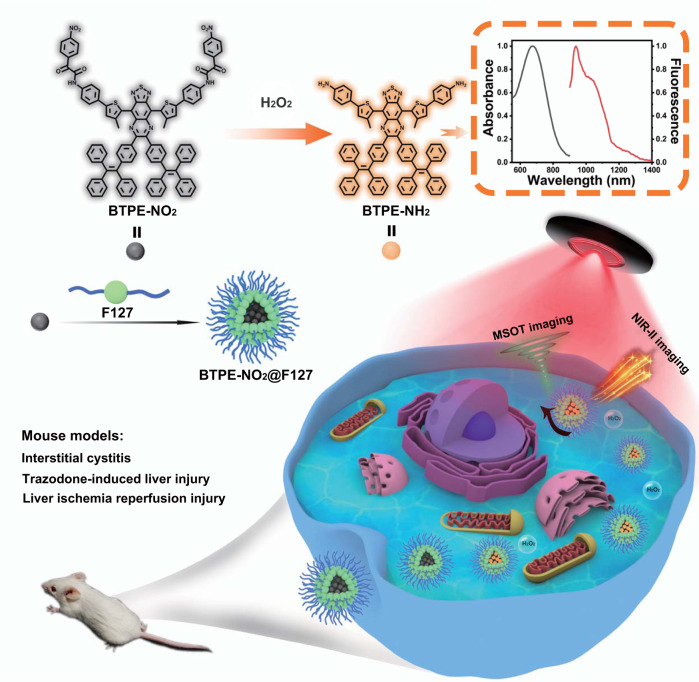
Developing high-quality NIR-II fluorophores (emission in 1000-1700 nm) for in vivo imaging is of great significance. Benzothiadiazole-core fluorophores are an important class of NIR-II dyes, yet ongoing limitations such as aggregation-caused quenching in aqueous milieu and non-activatable response are still major obstacles for their biological applications. Here, we devise an activatable nanoprobe to address these limitations. A molecular probe named BTPE-NO2 is synthesized by linking a benzothiadiazole core with two tetraphenylene groups serving as hydrophobic molecular rotors, followed by incorporating two nitrophenyloxoacetamide units at both ends of the core as recognition moieties and fluorescence quenchers. An FDA-approved amphiphilic polymer Pluronic F127 is then employed to encapsulate the molecular BTPE-NO2 to render the nanoprobe BTPE-NO2@F127. The pathological levels of H2O2 in the disease sites cleave the nitrophenyloxoacetamide groups and activate the probe, thereby generating strong fluorescent emission (950~1200 nm) and ultrasound signal for multi-mode imaging of inflammatory diseases. The nanoprobe can therefore function as a robust tool for detecting and imaging the disease sites with NIR-II fluorescent and multispectral optoacoustic tomography (MSOT) imaging. Moreover, the three-dimensional MSOT images can be obtained for visualizing and locating the disease foci.


Conflict of interest statement

The authors declare no competing interests.

Figures

Fig. 1
Fig. 1. Schematic representation for the fabrication of nanoprobe BTPE-NO2@F127 and its applications.
The fabrication of the nanoprobe BTPE-NO2@F127 and the biomarker (H2O2)-activatable detection/imaging for the interstitial cystitis, the trazodone-induced liver injury and the liver I/R injury in mouse models.
Fig. 2
Fig. 2. Characterization and spectral properties of nanoprobe.
a NIR-II fluorescence spectra of BTPE-NH2 (50 μM) in DMSO/H2O mixtures with different water fractions. Excitation wavelength: 808 nm. b Plot of fluorescence intensity (at 938 nm) of BTPE-NH2 versus water fraction. The inset shows NIR-II fluorescence images of BTPE-NH2 in DMSO/H2O with the water fraction being 0% or 99%. c Particle size distribution by DLS and TEM images for the nanoprobe BTPE-NO2@F127 (the experiments were repeated independently three times). Scale bar: 50 nm. d NIR-II fluorescence spectra of BTPE-NO2@F127 after incubation with varied H2O2 levels (in pH 7.4 PBS) for 90 min. Excitation wavelength: 808 nm. e Fluorescence intensity at 1028 nm for the nanoprobe BTPE-NO2@F127 (BTPE-NO2 32.6 μg mL−1) as a function of H2O2 level (n = 3 independent experiments). Inset: NIR-II fluorescent images for BTPE-NO2@F127 in the presence of varied levels of H2O2 in PBS; color bar: L: 6.0 × 102, H: 6.0 × 104 (arb. units). f Absorption spectra for BTPE-NO2@F127 after treatment with varied levels of H2O2 (in PBS). g Absorbance at 680 nm for the nanoprobe BTPE-NO2@F127 (BTPE-NO2 32.6 μg mL−1) versus H2O2 level (n = 3 independent experiments). h Relative optoacoustic intensity for the nanoprobe BTPE-NO2@F127 after incubation with varied levels of H2O2 (n = 3 independent experiments, excitation wavelength: 680 nm). Inset: Optoacoustic images for BTPE-NO2@F127 in the presence of varied levels of H2O2 in PBS; color bar: L: 6.1 × 101, H: 4.1 × 103 (arb. units). i Photostability of BTPE-NH2, BTPE-NO2 upon incubation with 100 μM H2O2, and ICG under the continuous irradiation by 808 nm laser (80 m W cm−2) for 60 min. F.I. fluorescence intensity, OA optoacoustic. Data with error bars are all presented as mean ± SD.
Fig. 3
Fig. 3. Application of nanoprobe BTPE-NO2@F127 in interstitial cystitis mouse model via NIR-II fluorescence imaging.
a Schematic illustration for establishment of the interstitial cystitis mouse model and imaging experiment. b Representative NIR-II fluorescence images of the control (healthy mice intraperitoneally injected with saline) and the interstitial cystitis model groups (intraperitoneally injected with 75 mg kg−1 CYP or 150 mg kg−1 CYP for 24 h) at various time points post-injection of BTPE-NO2@F127. Color bar: L: 6.0 × 102, H: 6.0 × 104 (arb. units). The mice were in supine position. Blue circle: bladder region. CYP cyclophosphamide, FL fluorescence, MSOT multispectral optoacoustic tomography.
Fig. 4
Fig. 4. Application of nanoprobe BTPE-NO2@F127 in interstitial cystitis mouse model via MSOT imaging and H&E analysis.
a Representative cross-sectional MSOT images of the control mice (the healthy mice intraperitoneally injected with saline) and the interstitial cystitis model groups (24 h after intraperitoneal injection with 75 mg kg−1 CYP or 150 mg kg−1 CYP) at various time points post intravesical injection of BTPE-NO2@F127. The mice were in prone position. Upper panel: overlay of the activated probe signal with the background (grayscale) signal. Lower panel: multispectrally resolved signal from the activated probe. Organ labeling: 1 artery. White dotted circle: bladder region. Color bar: L: 6.1 × 101, H: 4.1 × 103 (arb. units). b Tissue sections (H&E staining) for bladders of various mice groups (n = 5 animals per group. The experiments were repeated independently three times with similar results). Scale bar: 50 μm. CYP cyclophosphamide.
Fig. 5
Fig. 5. Application of nanoprobe BTPE-NO2@F127 in trazodone-induced liver injury mouse model.
a Molecular structure of trazodone. b Serum levels for the enzyme ALT of different groups (n = 5 animals per group). c Typical photographs under halogen light (serving as bright-field images) and NIR-II fluorescence images for the control group (mice administered with saline), and the mice pretreated with 50 mg kg−1, 100 mg kg−1 and 200 mg kg−1 trazodone at 0 min or at 120 min after i.v. injection of the nanoprobe BTPE-NO2@F127. Blue circle: liver region. Color bar: L: 6.0 × 102, H: 6.0 × 104 (arb. units). d Mean NIR-II fluorescence intensities at ROI (circled with blue curve) for liver site of the mice in c. n = 5 animals per group. e Mean NIR-II fluorescence intensities of the major organs corresponding to NIR-II fluorescent images in f. n = 5 animals per group. f Representative ex vivo NIR-II fluorescent images for the dissected organs (heart, liver, spleen, lung, and kidney) from different groups at 120 min after i.v. injection of BTPE-NO2@F127. Color bar: L: 6.0 × 102, H: 6.0 × 104 (arb. units). g Typical 3D MSOT images for the mice at 120 min after BTPE-NO2@F127 injection. White dotted circle: liver region. Scale bar: 3 mm. h H&E stained liver sections of different groups (n = 5 animals per group. The experiments were repeated independently three times with similar results). Color bar: L: 6.1 × 101, H: 4.1 × 103 (arb. units). Scale bar: 20 μm. Data with error bars are all presented as mean ± SD. F.I. fluorescence intensity, ALT alanine aminotransferase.
Fig. 6
Fig. 6. Application of nanoprobe BTPE-NO2@F127 in liver ischemia-reperfusion injury mouse model via NIR-II fluorescence imaging.
a Representative photographs showing the surgery process for the I/R process: the mouse undergoing laparotomy, ischemia with its hepatic artery and portal vein being clamped for 30 or 60 min, the vascular clamp being removed and the suturing procedure. b NIR-II fluorescence images for the sham-surgery group (ischemia for 0 min) and the I/R model mice (with ischemia for 30 min or 60 min followed by reperfusion for 24 h) at varied time points after i.v. injection of BTPE-NO2@F127 nanoprobe. Blue circle: liver region. Color bar: L: 6.0 × 102, H: 6.0 × 104 (arb. units). c Mean NIR-II fluorescence intensities of the liver regions corresponding to the ROI (blue circle) in b. n = 5 animals per group. Data with error bars are presented as mean ± SD. d Representative ex vivo NIR-II images of the dissected major organs (kidney, lung, spleen, heart and liver) in different mouse groups at 120 min after i.v. injection of BTPE-NO2@F127 nanoprobe. I ischemia, R reperfusion. Color bar: L: 6.0 × 102, H: 6.0 × 104 (arb. units). MSOT multispectral optoacoustic tomography, NIR-II near-infrared second window, F.I. fluorescence intensity, I ischemia, R reperfusion.
Fig. 7
Fig. 7. Application of nanoprobe BTPE-NO2@F127 in liver ischemia-reperfusion injury mouse model via MSOT imaging.
a Representative cross-sectional MSOT images for different groups at 0 min and 120 min after i.v. injection of the nanoprobe BTPE-NO2@F127 (I ischemia, R reperfusion). Organ labeling: “1” represents spinal cord. White dotted circle: liver region. Scale bar: 3.0 mm. Color bar: L: 6.1 × 101, H: 4.1 × 103 (arb. units). b Mean MSOT intensities corresponding to ROI (white dotted line) in a. n = 5 animals per group. c Cryosection image of a male mouse with its cross-section location matching those in a. 1: Spinal cord; 2: Spleen; 3: Thoracic aorta; 4: Vena cava; 5: Liver; 6: Portal vein; 7: Intestines; 8: Stomach. The cryosection image is from CryoMOUSETM atlas provided with the MSOT equipment for anatomical reference. d Serum levels of two enzymes ALT and AST from various groups. n = 5 animals per group. e Typical 3D MSOT images for different groups at 120 min post-injection of BTPE-NO2@F127 nanoprobe. “1” represents spinal cord. White dotted circle: liver region. Color bar: L: 6.1 × 101, H: 4.1 × 103 (arb. units). f Representative H&E staining of liver sections from different mouse groups (n = 5 animals per group. The experiments were repeated independently three times with similar results. Scale bar: 20 μm). Data with error bars are all presented as mean ± SD. I ischemia, R reperfusion, MSOT multispectral optoacoustic tomography.

Similar articles

Cited by

References

    1. Antaris AL, et al. A small-molecule dye for NIR-II imaging. Nat. Mater. 2016;15:235–242. - PubMed
    1. Hao X, et al. Programmable chemotherapy and immunotherapy against breast cancer guided by multiplexed fluorescence imaging in the second near-infrared window. Adv. Mater. 2018;30:1804437. - PubMed
    1. Li C, et al. Preoperative detection and intraoperative visualization of brain tumors for more precise surgery: a new dual-modality MRI and NIR nanoprobe. Small. 2015;11:4517–4525. - PubMed
    1. Wang S, et al. Anti-quenching NIR-II molecular fluorophores for in vivo high-contrast imaging and pH sensing. Nat. Commun. 2019;10:1058. - PMC - PubMed
    1. Wu W, et al. Molecular engineering of an organic NIR-II fluorophore with aggregation-induced emission characteristics for in vivo imaging. Small. 2019;15:1805549. - PubMed

Publication types

MeSH terms