. 2021 Nov 25;12(1):6906.
doi: 10.1038/s41467-021-27245-0.

NogoA-expressing astrocytes limit peripheral macrophage infiltration after ischemic brain injury in primates

Affiliations

NogoA-expressing astrocytes limit peripheral macrophage infiltration after ischemic brain injury in primates

Anthony G Boghdadi et al. Nat Commun. .

Abstract

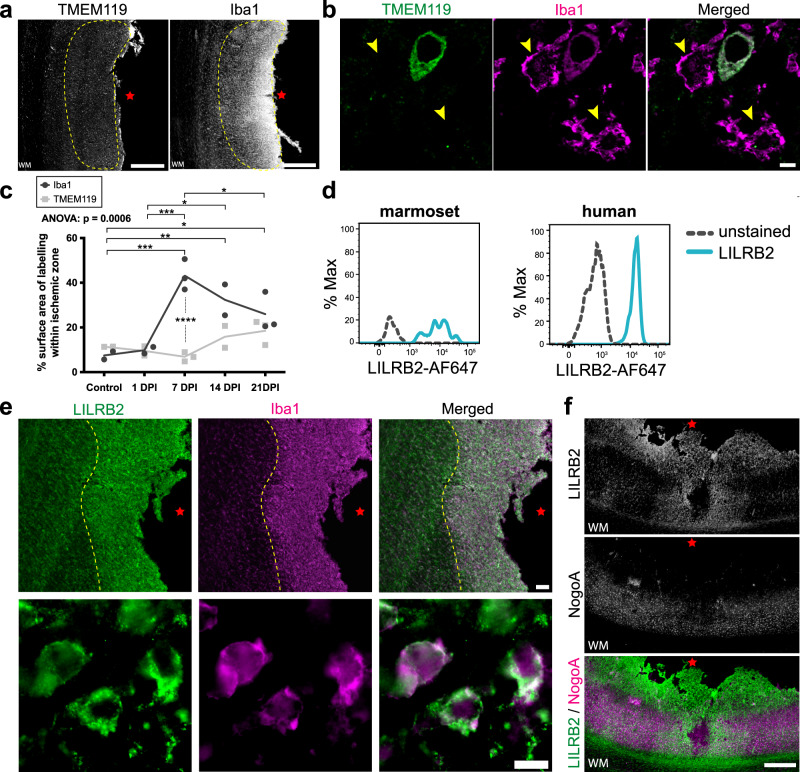
Astrocytes play critical roles after brain injury, but their precise function is poorly defined. Utilizing single-nuclei transcriptomics to characterize astrocytes after ischemic stroke in the visual cortex of the marmoset monkey, we observed nearly complete segregation between stroke and control astrocyte clusters. Screening for the top 30 differentially expressed genes that might limit stroke recovery, we discovered that a majority of astrocytes expressed RTN4A/ NogoA, a neurite-outgrowth inhibitory protein previously only associated with oligodendrocytes. NogoA upregulation on reactive astrocytes post-stroke was significant in both the marmoset and human brain, whereas only a marginal change was observed in mice. We determined that NogoA mediated an anti-inflammatory response which likely contributes to limiting the infiltration of peripheral macrophages into the surviving parenchyma.


Conflict of interest statement

S.M.S. is a founder and equity holder in ReNetX Bio, Inc., which seeks clinical development of NgR1-FC (AXER-204) for spinal cord injury. The remaining authors declare no competing interests.

Figures

Fig. 1
Fig. 1. Molecular classification of marmoset post-ischemic stroke reactive astrocytes.
a Schematic depicting ET-1-induced ischemic stroke in adult marmoset V1 and tissues isolated for single-nuclei 10x genomic sequencing. The injury was induced in the left hemisphere of three adult marmosets; uninjured hemispheres of three adult marmosets were used as controls for transcriptomic analyses. GM encompassing all cortical layers of V1 operculum was collected and isolated from both injured and control samples. b UMAP visualization of single nuclei from injured and control samples, colored by cell type. c Heat map colored by single nuclei gene expression of cell-type-specific markers. Heat map of additional markers used for cell-type assignment is in Supplementary Fig. 1c. d UMAP visualization of single astrocyte nuclei from injured and control samples, colored by cluster. e Average expression of pan-astrocyte and reactive astrocyte markers by condition. The size of the dots indicates the percentage of nuclei within that group that are expressing the gene at any level, while color indicates average expression from all nuclei within that group. f DEGs between injured and control samples; the log of the fold change between conditions is plotted on the axes. Genes were deemed significant if they exhibited >0.25 log-transformed fold change in either direction, and if the genes were expressed in >10% of nuclei in both groups. Red dots represent significantly upregulated DEGs, while blue dots represent DEGs that are significantly downregulated. Gray dots are genes with unaltered expression in between both conditions. The gene of interest, RTN4A (NogoA), within the top 30 DEGs is highlighted by a red bounding box. For the full DEG list, refer to Supplementary Data 1. g Venn diagram demonstrating shared and unique significant DEGs in RTN4A- and RTN4A + astrocytes. h GO analysis of unique DEGs in RTN4A- and RTN4A + astrocytes. For the full list of GO terms and genes, refer to Supplementary Data 1. i Characterization of the top 100 RTN4A- DEGs by Functional Module Detection (HumanBase), colored by functional module with summarized terms. For the full RTN4A- DEG list and Functional Module Detection analysis, refer to Supplementary Data 1. j Characterization of the top 100 RTN4A + DEGs by Functional Module Detection (HumanBase), colored by functional module with summarized terms. Genes of interest with concordant expression to RTN4A: GAP43, KLF6, and CD44, are highlight by red bounding boxes. For the full RTN4A + DEG list and Functional Module Detection analysis, refer to Supplementary Data 1. ET-1 endothelin-1, V1 primary visual cortex, GM gray matter, UMAP uniform manifold approximation and projection, Astro astrocyte, Endo endothelial cell, ExN excitatory neurons; InN inhibitory neurons, Oligo oligodendrocytes, OPC oligodendrocyte precursor cells, DEGs differentially expressed genes, RTN4A (NogoA) reticulon-4/ neurite outgrowth inhibitor A, GAP43 growth-associated protein 43, KLF6 kruppel-like factor 6, CD44 cell-surface glycoprotein-44.
Fig. 2
Fig. 2. In tissue validation of select markers upregulated concomitantly with NogoA in transcriptomic analysis.
a Nuclei-specific expression of RTN4A, and concordant GAP43, CD44, and KLF6. b Immunohistochemical validation of GAP43 upregulation in NogoA-positive reactive astrocytes from a separate cohort of adult marmosets. Injured = 7 days post-injury (ET-1 injection); Control = non-injected marmoset. c Quantification of GAP43 + / NogoA + GFAP + triple-positive astrocytes from (b). Each point represents the mean percentage ± SEM from an independent animal (n = 3 biological replicates) where at least 40 cells were counted over a minimum of three sections at high magnification with stacks to confirm colocalization of NogoA, GFAP, and GAP43. d Validation of CD44 upregulation by immunohistochemistry in marmoset 1-week post-stroke, compared to control (n = 3 biological replicates). e Validation of KLF6 upregulation by immunohistochemistry in marmoset 1-week post-stroke, compared to control (n = 3 biological replicates). RTN4A (NogoA): reticulon-4/ neurite outgrowth inhibitor A; GAP43: growth-associated protein 43; KLF6 kruppel-like factor 6, CD44 cell-surface glycoprotein-44; ET-1 endothelin-1; scale bar: 10 µm (bd); UT unpaired t-test, statistical test: UT, two-tailed, t = 19.97, df = 4, 95% CI; ****p < 0.0001. Source data are provided as a Source Data file.
Fig. 3
Fig. 3. NogoA expression after ischemic stroke in mouse, marmoset and human.
a, b, and e Representative immunofluorescent photomicrographs and stacks with orthogonal views showing NogoA colocalization with GFAP + cells in mouse (a) and primate (b marmoset; e human) cortical tissue adjacent to the ischemic core 3 and 7 days post-ischemic stroke, respectively (a: n = 3 biological replicates; b: n = 4 biological replicates; e: n = 1 biological replicate). c Quantification of NogoA + /GFAP + cells in mouse versus marmoset expressed as a percentage of total counted astrocytes. Each point represents the mean percentage ± SEM from an individual animal (mouse: n = 3 biological replicates, marmoset: n = 4 biological replicates), where at least 30 cells were counted over a minimum of three sections at high magnification with stacks to confirm colocalization of NogoA and GFAP (d) Quantification of NogoA fluorescent intensity, normalized against GFAP, in mouse versus marmoset. Each point represents the mean fluorescent intensity ± SEM of NogoA:GFAP for an individual animal (mouse: n = 3 biological replicates, marmoset: n = 4 biological replicates) where at least ten cells from previous counts in (c) were analyzed at high magnification. NogoA: neurite outgrowth inhibitor A; GFAP glial fibrillary acidic protein, hoechst: nuclear stain; WM white matter, yellow-hatched line: border of ischemic core; red star: ischemic core; scale bars: 100 µm (a, b, and e: left), 50 µm (a, b, and e: top), 10 µm (a, b, and e: bottom); UT unpaired t-test; statistical test: UT, p-value < 0.0001; two-tailed, t = 16.38, df = 5, CI = 95% (c), UT, p-value = 0.0003, two-tailed, t = 8.764, df = 5, CI = 95% (d); ***p < 0.001; ****p < 0.0001. Source data are provided as a Source Data file.
Fig. 4
Fig. 4. Peripheral macrophage infiltration in the marmoset post-ischemic stroke.
a Representative low-power photomicrographs revealing the low TMEM119 (microglia-specific) and high Iba1 (macrophages) expression within the ischemic zone of marmoset 1-week post-ischemic stroke cortical tissue by DAB immunohistochemistry (n = 3 biological replicates). b High-power photomicrographs identify a lack of TMEM119 colocalization with Iba1+ cells in the ischemic zone of 1-week post-ischemic stroke marmoset (n = 3 biological replicates). c Quantification of peripheral macrophage infiltration in the marmoset post-ischemic stroke. Each point represents the mean surface area labeled with Iba1 versus TMEM119, calculated from a minimum of three sections per marmoset across various post-ischemic stroke recovery time points (n = 2 biological replicates: control, 1 DPI and 14 DPI; n = 3 biological replicates: 7 DPI and 21 DPI). d Marmoset and human macrophage analysis. Fluorescent-activated cell sorting data depicting NogoA immune-receptor (LILRB2) expression in marmoset and human CD14 +/CD11b + macrophage populations. e Representative low and high-power photomicrographs demonstrating LILRB2 colocalization with Iba1+ cells in the ischemic zone of 1-week post-ischemic stroke marmoset (n = 3 biological replicates). f Representative pseudo colored LILRB2 and NogoA photomicrographs overlaid to show spatial distribution of labeling (n = 3 biological replicates). TMEM119: transmembrane protein 119; Iba1: ionized calcium-binding adapter molecule 1; WM white matter; yellow hatched line: cell population of interest with lack of TMEM119 expression; red star: ischemic core; yellow arrowheads: TMEM119-/Iba1+ peripheral macrophages; DPI days post-ischemic stroke, LILRB2 leukocyte immunoglobulin-like receptor B2, NogoA, neurite outgrowth inhibitor A; scale bars: 500 μm (a, f), 5 μm (b), 100 μm (e: top), 10 μm (e: bottom); statistical tests: ordinary two way-ANOVA with Sidak’s multiple comparisons; ANOVA p-value = 0.0006; *p < 0.05; **p < 0.01; ***p < 0.001. Source data and tabulated statistics for (c) are provided as a Source Data file.
Fig. 5
Fig. 5. NogoA/ LILRB2 signaling induces repulsion of human macrophages.
a Human RNA-seq data from Gosselin, Skola demonstrating known NogoA ligand binding partners in transcripts per million detected in human monocytes. b Qualitative immunoblot for LILRB2, NgR1 and S1PR2 in marmoset (MC) and human (HC) cortical tissues, and THP-1-derived human macrophages (MØ) (n = 1 biological replicate/tissue as a qualitative validation of published data from (a)). c LILRB2/ Iba1 immunostaining of THP-1-derived human macrophages, in vitro. THP-1-derived human macrophages were tested for phagocytosis of latex beads (c, magnified box) (n = 2 biological replicates over at least three serial dilutions). d Schematic depicting NogoA domains and receptors. e, f Representative immunoblots for THP-1-derived human macrophages treated with human Nogo-66 (e) or Nogo-Δ20 (f) for 0, 10, 30, 60, and 120 m. g, h Scatter plots depict densitometric quantification of protein normalized to GAPDH for e and f, respectively. Each point represents the mean of 2 technical replicates for independent THP-1-derived macrophage cohorts (n = 3 biological replicates/ condition, excluding PBS control for e and g, where n = 4 biological replicates/condition, with no technical replicates). i, j Representative immunostaining of the in vitro stripe (repulsion) assay for human Control-Fc, NogoA (Nogo-66-Fc or Nogo-Δ20-Fc) and NogoA with LILRB2 blocker pre-treatment of macrophages. The scatter plots with bars depict the mean percentage ± SEM of Iba1 + cells situated in between stripes (n = 3 biological replicates/ condition, at least three images per condition). k Nogo-Δ20 pull down assay of LILRB2 from THP-1 macrophage cell lysate (n = 1 biological replicate in triplicate). l Effect of LILRB2 treatment on THP-1-derived macrophage integrin expression. Scatter plots depict densitometric quantification of protein normalized to cell number. Each point represents the signal independent THP-1-derived macrophage cohort (n = 6 biological replicates/condition over one experiment). LILRB2 leukocyte immunoglobulin-like receptor B2, NgR1 Nogo Receptor 1, S1PR2 sphingosine-1-phosphate receptor 2; GAPDH: glyceraldehyde 3-phosphate dehydrogenase; kDa: kilodalton; MC: marmoset cortical tissue, HC human cortical tissue, MØ macrophages, Iba1 ionized calcium-binding adapter molecule 1, POSH plenty of sarcoma homology domain 3, ROCK1 Rho kinase 1, NogoA neurite outgrowth inhibitor A, mAB monoclonal antibody, +Ctrl positive control, IP immunoprecipitation, IgG immunoglobulin, ITGAV integrin subunit alpha V, ITGA4 integrin subunit alpha 4, ITGB3 integrin subunit beta 3, ITGB1 integrin subunit beta 1, yellow arrowheads: NogoA-repelled cells (i, j); scale bars: 50 μm (c, i, and j), 10 μm (c, magnified box); statistical tests: ordinary one way-ANOVA with post-hoc Dunnett’s OR Tukey’s multiple comparisons (gj), unpaired T-test (UT) (l); *p < 0.05; **p < 0.01; ***p < 0.001; ns: not significant. Source data and tabulated statistics for (g, h, i, j, and l) are provided as a Source Data file.

References

    1. O’collins VE, et al. 1,026 experimental treatments in acute stroke. Ann. Neurol. 2006;59:467–477. - PubMed
    1. Teo L, Bourne JA. A reproducible and translatable model of focal ischemia in the visual cortex of infant and adult marmoset monkeys. Brain Pathol. 2014;24:459–474. - PMC - PubMed
    1. Liddelow SA, Sofroniew MV. Astrocytes usurp neurons as a disease focus. Nat. Neurosci. 2019;22:512–513. - PubMed
    1. Liddelow SA, Barres BA. Reactive astrocytes: production, function, and therapeutic potential. Immunity. 2017;46:957–967. - PubMed
    1. Krienen FM, et al. Innovations present in the primate interneuron repertoire. Nature. 2020;586:262–269. - PMC - PubMed

Publication types