. 2021 Nov 25;12(1):6883.
doi: 10.1038/s41467-021-27272-x.

Dietary essential amino acids restore liver metabolism in ovariectomized mice via hepatic estrogen receptor α

Affiliations

Dietary essential amino acids restore liver metabolism in ovariectomized mice via hepatic estrogen receptor α

Sara Della Torre et al. Nat Commun. .

Abstract

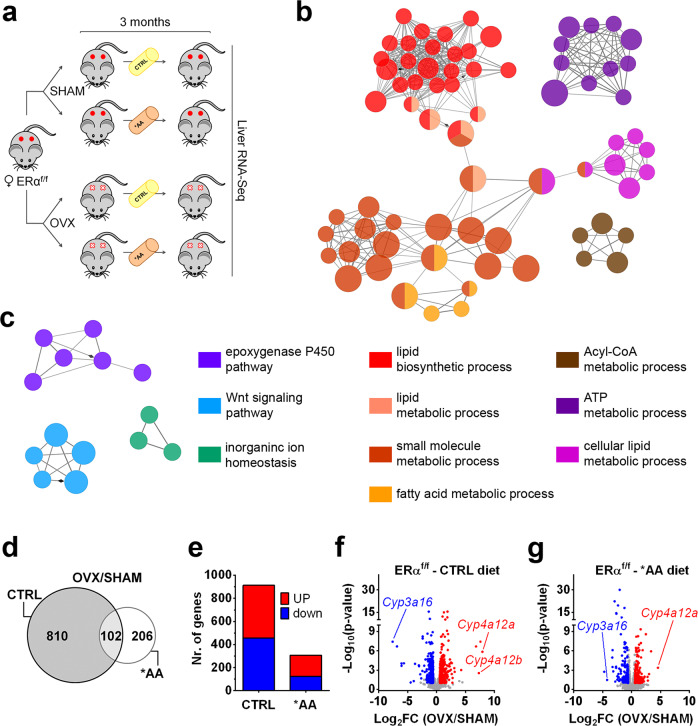
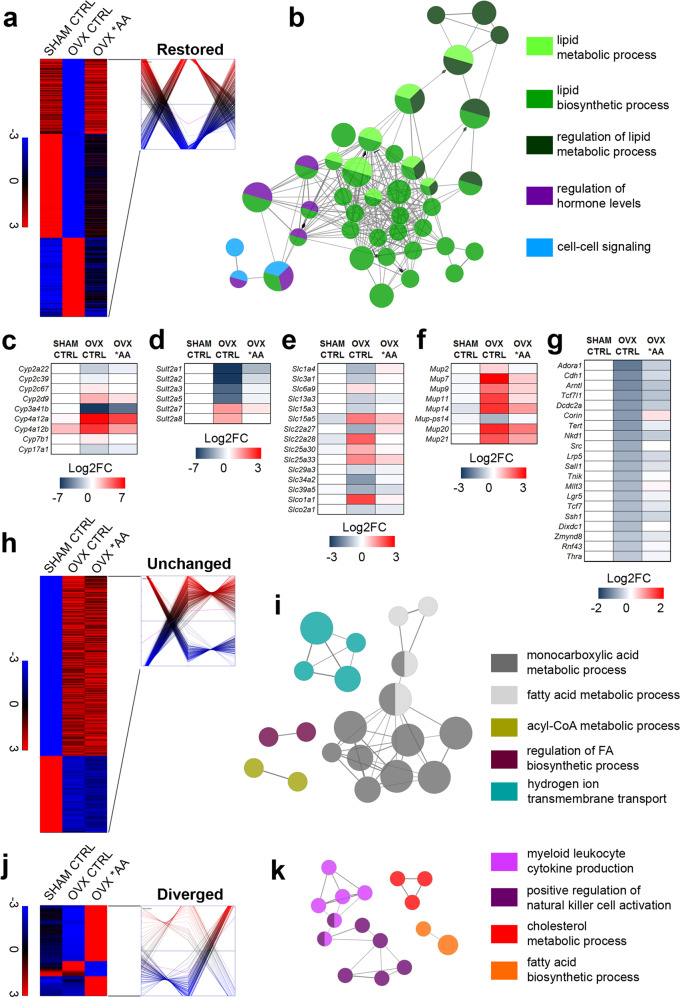
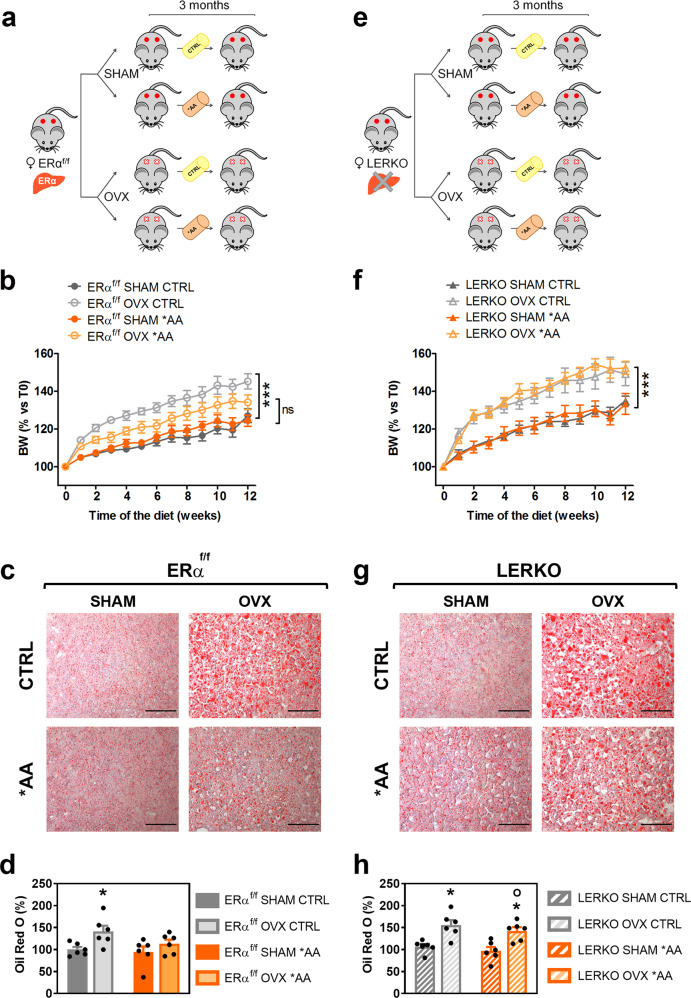
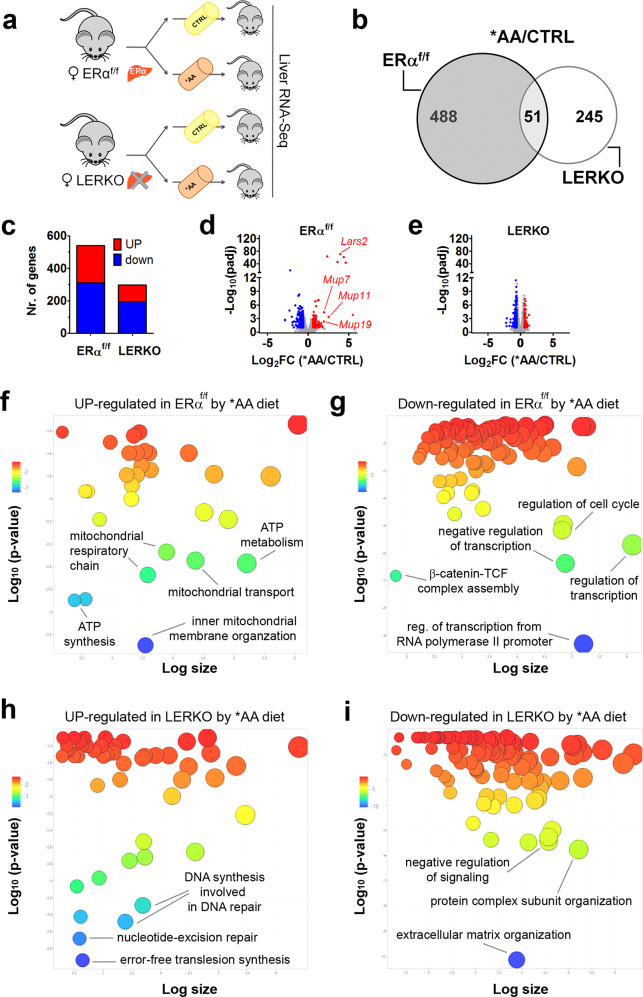
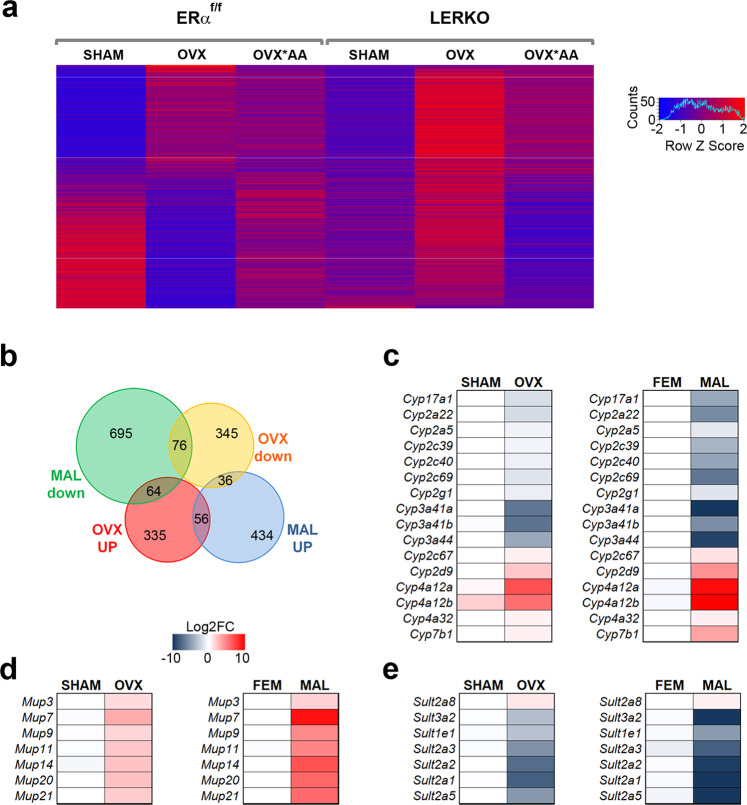
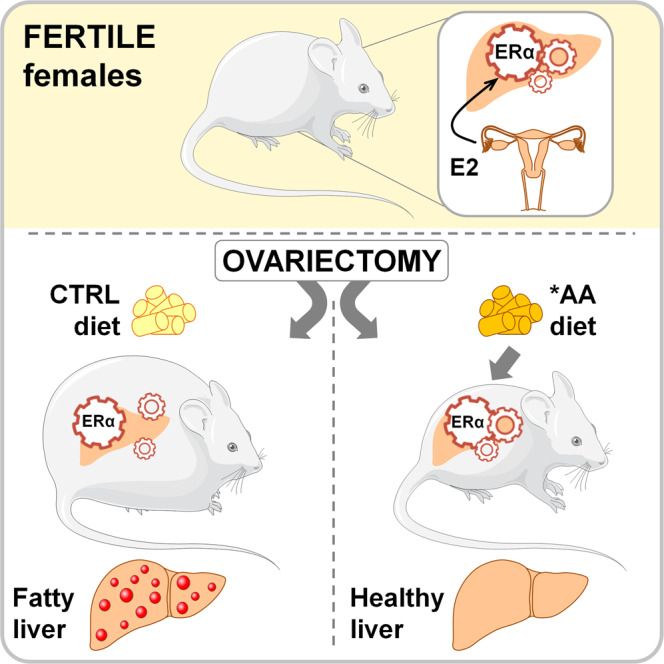
In female mammals, the cessation of ovarian functions is associated with significant metabolic alterations, weight gain, and increased susceptibility to a number of pathologies associated with ageing. The molecular mechanisms triggering these systemic events are unknown because most tissues are responsive to lowered circulating sex steroids. As it has been demonstrated that isoform alpha of the estrogen receptor (ERα) may be activated by both estrogens and amino acids, we test the metabolic effects of a diet enriched in specific amino acids in ovariectomized (OVX) mice. This diet is able to block the OVX-induced weight gain and fat deposition in the liver. The use of liver-specific ERα KO mice demonstrates that the hepatic ERα, through the control of liver lipid metabolism, has a key role in the systemic response to OVX. The study suggests that the liver ERα might be a valuable target for dietary treatments for the post-menopause.


Conflict of interest statement

The authors declare no competing interests.

Figures

Fig. 1
Fig. 1. Dietary EAA/BCAA mitigate the differences in liver transcriptome between SHAM-operated and OVX females.
a Experimental design adopted to evaluate the relevance of estrogens in the liver metabolic response to *AA diet. bc Cluster analysis of the functional networks significantly up- (b) and downregulated (c) by OVX in the liver of ERαf/f CTRL-fed females by RNA-Seq analysis (n = 4). d Venn diagram showing the genes differentially expressed in OVX versus SHAM mice. DEGs were identified by RNA-Seq (n = 4) in the liver of SHAM versus OVX ERαf/f females fed with CTRL diet (grey circle, 912 genes) or *AA diet (white circle, 308 genes). e Distribution of genes up- and downregulated by OVX measured by RNA-Seq analysis (n = 4) in the liver of ERαf/f females fed with CTRL or *AA diet. fg Volcano plot of liver DEGs measured by RNA-Seq (n = 4) in SHAM and OVX ERαf/f females fed with CTRL (f) or *AA (g) diet. OVX/SHAM ratio of gene expression is shown on the X axis as Log2FC and significance is displayed on the Y axis as −Log10padj. Genes significantly up- and downregulated with |FC| > 1.5 and padj < 0.1 (two-tailed Student’s t-test) by OVX are colored in red and blue, respectively; genes not differentially expressed are displayed in grey. Cyp3a16, Cytochrome P450 3A16; Cyp4a12a, Cytochrome P450 4A12A; Cyp4a12b, Cytochrome P450 4A12B. Source data are provided in; processed data are provided as a Source Data file.
Fig. 2
Fig. 2. Effect of the *AA diet on liver transcriptomic profile in females lacking estrogens.
By k-means clustering calculations done with Genesis, DEGs by RNA-Seq analysis (n = 4) related to SHAM ERαf/f females fed with CTRL diet and OVX ERαf/f females fed with CTRL or *AA diet were grouped in three classes according to the absolute variation in their expression profile (see also Supplementary Fig. 3). a Heatmaps and clusters reporting the expression of the genes which expression was affected by OVX and “restored” by *AA diet. b Cluster analysis of functional networks significantly enriched among the genes “restored” by *AA diet. cg Heatmaps reporting as Log2FC the mean expression of the most enriched classes of genes which expression was affected by OVX and “restored” by *AA diet. hj Heatmaps and clusters reporting the expression of the genes which expression was altered by OVX and “unchanged” (h) or “diverged” (j) by *AA diet. ik Cluster analysis of functional networks significantly enriched among the genes altered by OVX and “unchanged” (i) or “diverged” (k) by *AA diet. Source data are provided in; processed data are provided as a Source Data file.
Fig. 3
Fig. 3. Hepatic ERα mediates the *AA-induced metabolic benefits in females lacking estrogens.
a Experimental design adopted to evaluate the effects of *AA diet in ERαf/f OVX females. b Body weight (BW) of SHAM and OVX ERαf/f females fed with CTRL or *AA diet measured weekly for 12 weeks and expressed as percentage versus time 0. Data are mean values ± SEM (n = 8). ***p < 0.001 ERαf/f OVX CTRL versus ERαf/f SHAM CTRL by two-way ANOVA followed by Bonferroni’s post hoc test. c Representative images of the lipid deposits by Oil Red O staining in the liver tissues of SHAM and OVX ERαf/f females fed with CTRL or *AA diet for 12 weeks. Orange-red: neutral fats; scale bar = 100 μm. d Quantification of Oil Red O staining shown in (c). Data are expressed as percentages of the total section areas. Data are the mean ± SEM (n = 6). *p < 0.05 ERαf/f OVX CTRL versus ERαf/f SHAM CTRL by two-way ANOVA followed by Bonferroni’s post hoc test. e Experimental design adopted to evaluate the effects of *AA diet in LERKO OVX females. f Body weight (BW) of SHAM and OVX LERKO females fed with CTRL or *AA diet measured weekly for 12 weeks and expressed as percentage versus time 0. Data are the mean ± SEM (n = 8). ***p < 0.001 LERKO OVX CTRL versus LERKO SHAM CTRL and LERKO OVX *AA versus LERKO SHAM *AA by two-way ANOVA followed by Bonferroni’s post hoc test. g Representative images of the lipid deposits by Oil Red O staining in the liver tissues of SHAM and OVX LERKO females fed with CTRL or *AA diet for 12 weeks. Orange-red: neutral fats; scale bar = 100 μm. h Quantification of Oil Red O staining shown in (g). Data are expressed as percentages of the total section areas. Data are the mean ± SEM (n = 6). *p < 0.05 LERKO OVX CTRL versus LERKO SHAM CTRL and LERKO OVX *AA vs LERKO SHAM *AA; °p < 0.05 LERKO OVX *AA versus ERαf/f OVX *AA by two-way ANOVA followed by Bonferroni’s post hoc test. Source and processed data are provided in and as a Source Data file.
Fig. 4
Fig. 4. Liver ERα is necessary to maximize the hepatic metabolic response to *AA diet.
a Experimental scheme aimed at defining hepatic ERα involvement in the response to the *AA diet. b Venn diagram to compare the response to the *AA diet of ERαf/f (grey circle, on the left) and LERKO females (white circle, on the right). DEGs from RNA-Seq analysis (n = 4) were considered as significant when |FC|>1.5 and padj<0.1 (two-tailed Student’s t-test). c Distribution of genes up- and downregulated by *AA diet in the liver of ERαf/f and LERKO females from RNA-Seq analysis (n = 4). de Volcano plot of DEGs identified by RNA-Seq (n = 4) in the liver of ERαf/f (d) and LERKO (e) females fed with CTRL or *AA diet. *AA/CTRL ratio of gene expression is shown on the X axis as Log2FC and significance is displayed on the Y axis as −Log10padj. Genes significantly up- and down-regulated with |FC|>1.5; padj<0.1 (two-tailed Student’s t-test) by *AA diet are in red and blue, respectively; genes without bias are displayed in grey. Lars2, leucyl-tRNA synthetase 2; Mup7, major urinary protein 7; Mup11, major urinary protein 11; Mup19, major urinary protein 19. fi. Gene ontology (GO) enrichment analysis generated with REVIGO. Scatterplots of GO terms obtained with Enrichr were related to the genes up- (f) and down-regulated (g) by *AA diet exclusively in the liver of ERαf/f and to the genes up- (h) and down-regulated (i) by *AA diet exclusively in the liver of LERKO females. Colors indicate the p-value of enrichment according to the legend (in upper left-hand corner); the size of each bubble reflects the count of each term among the enriched term list. Source data are provided in; processed data are provided as a Source Data file.
Fig. 5
Fig. 5. Comparison of hepatic transcriptomes from different female genotypes and from males.
a Heatmap showing overall the DEGs from RNA-Seq analysis (n = 4) related to OVX and/or diet in ERαf/f and LERKO females. b Venn diagram summarizing the overlap between DEGs identified by RNA-Seq (n = 4) in the liver of male, fertile female and OVX female ERαf/f mice. ce Heatmaps reporting as Log2FC the mean expression (n = 4) of the most enriched class of genes differentially expressed in the livers of OVX ERαf/f females and in the livers of ERαf/f males with respect to fertile ERαf/f females. Source data are provided in; processed data are provided as a Source Data file.
Fig. 6
Fig. 6. The AA* diet induces metabolic benefits in OVX females that are mediated by the hepatic ERα.
In female mice, ovariectomy induces liver lipid deposition and body weight increase. The *AA diet reinstates a more balanced hepatic metabolism contributing to avoid fat deposition in the liver and to reestablish the lean phenotype typical of the intact females. This phenomenon is not observed in LERKO mice, suggesting a pivotal role of the hepatic ERα in the control of lipid and energy homeostasis in females. Image was modified from Servier Medical Art, licensed under a Creative Common Attribution 3.0 Generic License. http://smart.servier.com/.

Similar articles

Cited by

References

    1. Della Torre S, Benedusi V, Fontana R, Maggi A. Energy metabolism and fertility: a balance preserved for female health. Nat. Rev. Endocrinol. 2014;10:13–23. - PubMed
    1. Della Torre S, Maggi A. sex differences: a resultant of an evolutionary pressure? Cell Metab. 2017;25:499–505. - PubMed
    1. Maggi A, Della Torre S. Sex, metabolism and health. Mol. Metab. 2018;15:3–7. - PMC - PubMed
    1. Roy AK, Chatterjee B. Sexual dimorphism in the liver. Annu. Rev. Physiol. 1983;45:37–50. - PubMed
    1. Yang X. Tissue-specific expression and regulation of sexually dimorphic genes in mice. Genome Res. 2006;16:995–1004. - PMC - PubMed

Publication types

MeSH terms

Substances