. 2021 Nov 25;11(1):22904.
doi: 10.1038/s41598-021-01977-x.

Andrographolide promotes hippocampal neurogenesis and spatial memory in the APPswe/PS1ΔE9 mouse model of Alzheimer's disease

Affiliations

Andrographolide promotes hippocampal neurogenesis and spatial memory in the APPswe/PS1ΔE9 mouse model of Alzheimer's disease

Sebastian B Arredondo et al. Sci Rep. .

Abstract

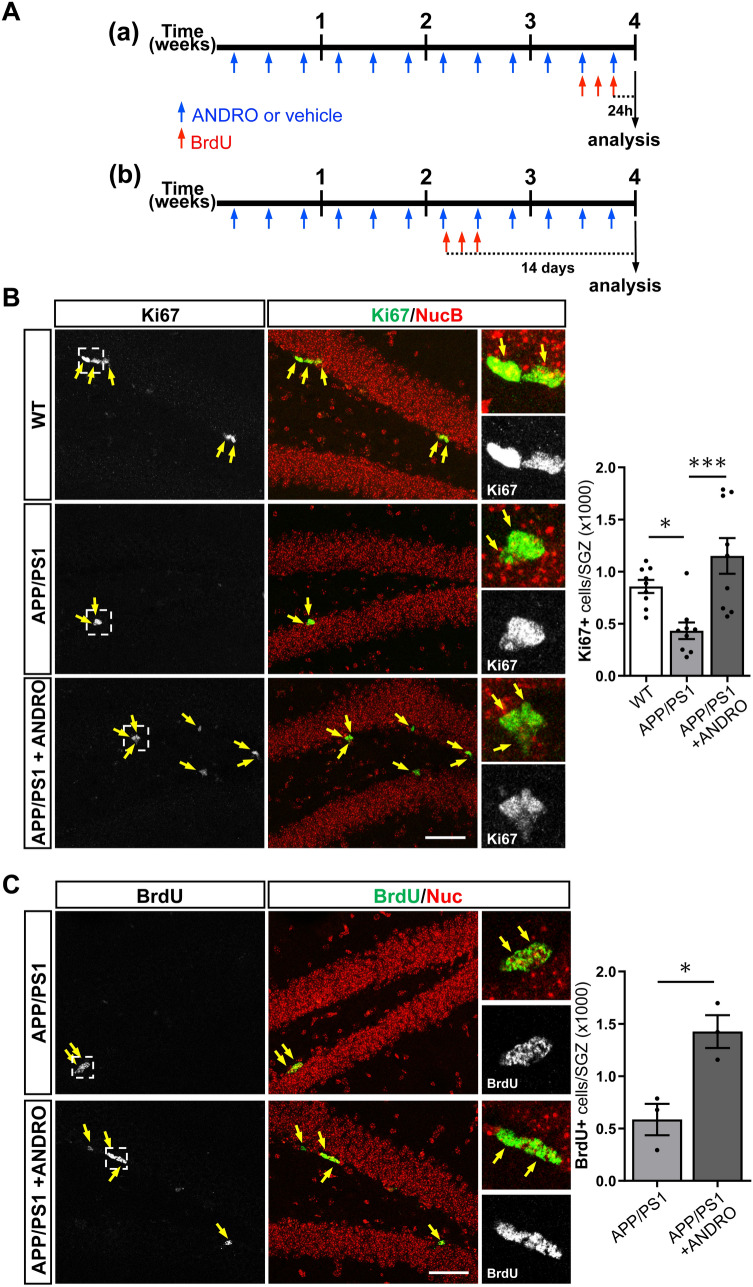
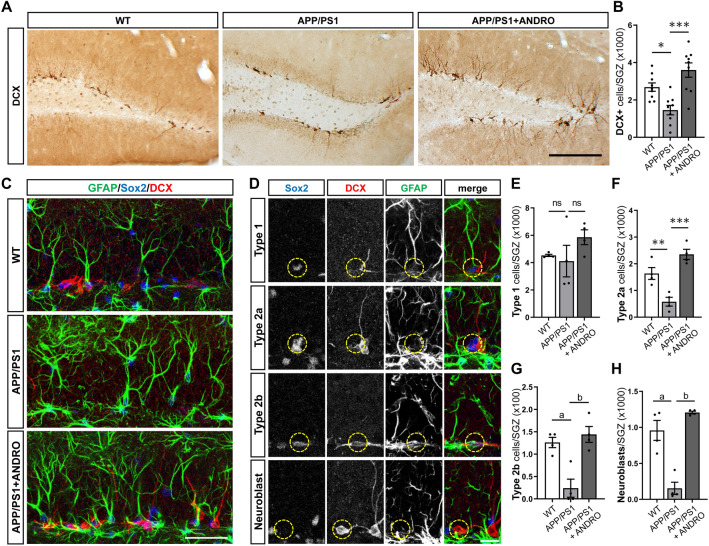
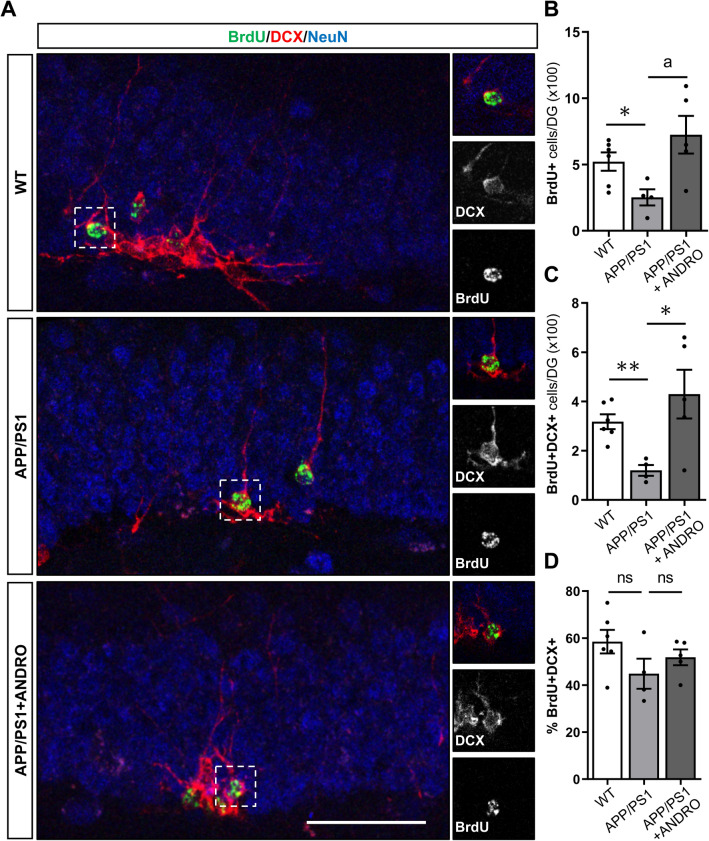
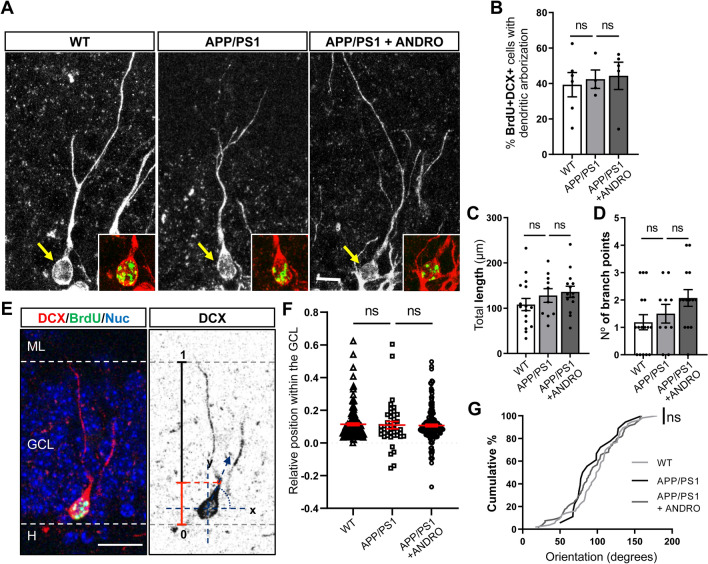
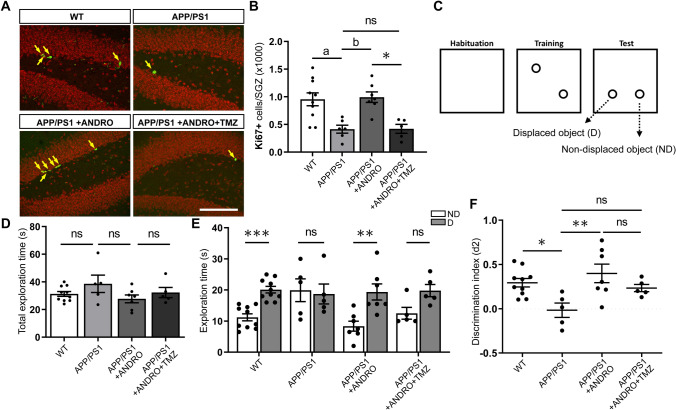
In Alzheimer´s disease (AD) there is a reduction in hippocampal neurogenesis that has been associated to cognitive deficits. Previously we showed that Andrographolide (ANDRO), the main bioactive component of Andrographis paniculate, induces proliferation in the hippocampus of the APPswe/PSEN1ΔE9 (APP/PS1) mouse model of AD as assessed by staining with the mitotic marker Ki67. Here, we further characterized the effect of ANDRO on hippocampal neurogenesis in APP/PS1 mice and evaluated the contribution of this process to the cognitive effect of ANDRO. Treatment of 8-month-old APP/PS1 mice with ANDRO for 4 weeks increased proliferation in the dentate gyrus as evaluated by BrdU incorporation. Although ANDRO had no effect on neuronal differentiation of newborn cells, it strongly increased neural progenitors, neuroblasts and newborn immature neurons, cell populations that were decreased in APP/PS1 mice compared to age-matched wild-type mice. ANDRO had no effect on migration or in total dendritic length, arborization and orientation of immature neurons, suggesting no effects on early morphological development of newborn neurons. Finally, ANDRO treatment improved the performance of APP/PS1 mice in the object location memory task. This effect was not completely prevented by co-treatment with the anti-mitotic drug TMZ, suggesting that other effects of ANDRO in addition to the increase in neurogenesis might underlie the observed cognitive improvement. Altogether, our data indicate that in APP/PS1 mice ANDRO stimulates neurogenesis in the hippocampus by inducing proliferation of neural precursor cells and improves spatial memory performance.


Conflict of interest statement

The authors declare no competing interests.

Figures

Figure 1
Figure 1
ANDRO increases cell proliferation in the dentate gyrus of APPswe/PSEN1ΔE9 mice. (A) Schematic representation of experimental procedure; 8-month-old APPswe/PSEN1ΔE9 mice were injected i.p. with 2 mg kg−1 ANDRO or vehicle solution 3 times a week for 4 weeks. Animals received a daily i.p. injection of 100 mg kg−1 BrdU the last 3 days of treatment and were sacrificed 24 h after the last BrdU injection (a) or received a daily i.p. injection of 100 mg kg−1 BrdU for 3 consecutive days and were sacrificed 14 days after the first BrdU injection (b). (B) Representative confocal images of the immunofluorescence of Ki67 in the dentate gyrus of control wild-type (WT), APPswe/PSEN1ΔE9 (APP/PS1) mice, and APP/PS1 mice treated with ANDRO. Images correspond to maximal projection of 10 µm z-stack. Scale Bar: 50 µm. Right panels show higher magnifications of single z-stack of dotted squares shown in left panels. Arrows indicate Ki67-positive (Ki67+) cells. The graph shows the quantification of the total number of Ki67+ cells in the subgranular zone (SGZ). Data are presented as mean ± SEM; WT = 9 mice; APP/PS1 = 9 mice; APP/PS1 + ANDRO = 9 mice. *p = 0.0445; ***p = 0.0005, one-way ANOVA followed by Bonferroni post-hoc test. (C) Representative confocal images of the immunofluorescence of BrdU in the dentate gyrus of APPswe/PSEN1ΔE9 mice injected with vehicle solution (APP/PS1) and APP/PS1 mice treated with ANDRO. Images correspond to maximal projection of 8 µm z-stack. Scale Bar: 50 µm. Right panels show higher magnifications of single z-stack of dotted squares shown in left panels. Arrows indicate BrdU-positive (BrdU+) cells. The graph shows the quantification of the total number of BrdU+ cells in the SGZ. Data are presented as mean ± SEM; N = 3 mice. * p = 0.0177, unpaired Student’s t-test.
Figure 2
Figure 2
ANDRO increases neural precursor cells and immature neurons in the dentate gyrus of APPswe/PSEN1ΔE9 mice. (A) Representative immunostaining of immature neuronal marker DCX in the dentate gyrus of control wild-type (WT), APPswe/PSEN1ΔE9 (APP/PS1) mice, and APP/PS1 mice treated with ANDRO. Scale Bar: 200 µm. (B) Quantification of the total number of DCX+ cells in the granular cell layer (GCL). Data are presented as mean ± SEM; WT = 9 mice; APP/PS1 = 9 mice; APP/PS1 + ANDRO = 9 mice. *p = 0.0204, ***p < 0.0001, one-way ANOVA followed by Bonferroni post-hoc test. (C) Immunostaining of GFAP, Sox2 and DCX in WT, APP/PS1 mice, and APP/PS1 mice treated with ANDRO. Scale Bar: 40 µm. (D) Representative immunostaining of type 1, type 2a, type 2b cells and neuroblasts in the dentate gyrus identified by immunostaining with GFAP, Sox2 and DCX, and by cell morphology. Scale Bar: 20 µm. (E–H) Quantification of the total number of type 1 (E), type 2a (F), type 2b cells (G) and neuroblasts (H) in the SGZ of WT, APP/PS1, and APP/PS1 mice treated with ANDRO. Data are presented as mean ± SEM; WT = 4 animals; APP/PS1 = 4 animals; APP/PS1 + ANDRO = 4 animals. ns, non-significantly different. In (F), **p = 0.0098; ***p = 0.003. In (G), ap = 0.0062; bp = 0.0021. In (H), ap = 0.0006; bp < 0.0001; one-way ANOVA followed by Bonferroni post-hoc test.
Figure 3
Figure 3
ANDRO does not affect neuronal differentiation in the dentate gyrus of APPswe/PSEN1ΔE9 mice. (A) Representative immunofluorescence staining of BrdU, and the neuronal markers DCX and NeuN in control wild-type (WT), APPswe/PSEN1ΔE9 (APP/PS1) mice, and APP/PS1 mice treated with ANDRO. Images correspond to maximal projection of 8 µm z-stack. Right panels show higher magnifications of single z-stack of dotted squares shown in left panels showing BrdU+DCX+ cells. Scale Bar: 50 µm. (BD) Quantification of the total number of BrdU+ (B) and BrdU+DCX+ (C) cells in the GCL, and the percentage of BrdU+ cells expressing DCX (%BrdU+DCX+) (D), in animals treated with vehicle or ANDRO. Data are presented as mean ± SEM; WT = 6 mice; APP/PS1 = 4 mice; APP/PS1 + ANDRO = 5 mice. *p = 0.0255, ap = 0.0272 (B); *p = 0.0298, **p = 0.0014 (C); ns, non-significantly different, unpaired Student’s t-test.
Figure 4
Figure 4
ANDRO does not affect early morphological development of newborn neurons. (A) Representative confocal images of BrdU+DCX+ cells showing dendritic arborization into the GCL towards the molecular layer in control wild-type (WT), APPswe/PSEN1ΔE9 (APP/PS1) mice, and APP/PS1 mice treated with ANDRO. Images correspond to maximal projection of 10 µm z-stack. Insets show z-stack of BrdU+DCX+ staining in cells indicated with the arrows (DCX: red; BrdU: green). Scale Bar: 10 µm (B) Quantification of the percentage of BrdU+DCX+ cells extending dendrites toward the molecular layer in WT, APP/PS1 mice and APP/PS1 mice treated with ANDRO. Data are presented as mean ± SEM; WT = 6 mice; APP/PS1 = 4 mice; APP/PS1 + ANDRO = 5 mice. ns, non-significantly different; one-way ANOVA test followed by Bonferroni post-hoc test. (C,D) Quantification of the total dendritic length (C) and number of branch points (D) of BrdU+DCX+ cells in WT, APP/PS1 and APP/PS1 mice treated with ANDRO. Data are presented as mean ± SEM; WT = 16 cells (N = 3 mice); APP/PS1 = 10 cells (N = 3 mice); APP/PS1 + ANDRO = 14 cells (N = 3 mice). One-way ANOVA test followed by Bonferroni post-hoc test. ns, non-significant. (E) Representative immunofluorescence of BrdU+DCX+ cell (left panel) and inverted DCX immunostaining (right panel) showing the schematic model of the analysis to assess the relative position of BrdU+DCX+ cells within the GCL, and the angular orientation of the initiation site (red dot), with the x-axis parallel to the GCL (0°–180°), the y axis pointing toward the hilus or ML (90° and 270°), and the origin at the center of the soma. (F) Quantification of the relative position of BrdU+DCX+ cells within the GCL. ns, non-significant, Mann–Whitney test. (G) Cumulative distribution plots of the angular orientation of the initiation site of BrdU+DCX+ cells. ns, non-significant, Kolmogorov–Smirnov test. (D,E): WT = 6 animals; APP/PS1 = 4 animals; APP/PS1 + ANDRO = 5 animals, N > 40 cells.
Figure 5
Figure 5
ANDRO improves spatial memory in APPswe/PSEN1ΔE9 mice. (A) Representative confocal images of the immunofluorescence of Ki67-positive (Ki67+, arrows) cells in the dentate gyrus of control wild-type (WT) mice, APPswe/PSEN1ΔE9 (APP/PS1) mice injected with vehicle, ANDRO or ANDRO + TMZ. Images correspond to maximal projection of 10 µm z-stack. Scale Bar: 50 µm. (B) Quantification of the total number of Ki67+ cells in the SGZ. One-way ANOVA test followed by Bonferroni post-hoc test. ap = 0.0185; bp = 0.0177; *p = 0.0139. ns, non-significant. (C) Schematic representation of the object location memory (OLM) test. (D) Quantification of the total exploration time in WT mice, APP/PS1 mice injected with vehicle, ANDRO or ANDRO + TMZ. ns, non-significant, One-way ANOVA test followed by Bonferroni post-hoc test. (E) Quantification of the time spent exploring the non-displaced (ND) and displaced (D) objects. ***p = 0.0002, **p = 0.0012, ns, non-significant. Mann–Whitney test. (F) Discrimination index (d2) calculated by dividing the difference of time spent to explore D and ND objects by the total time exploring both objects. *p = 0.0335, **p = 0.0067; ns, non-significantly different, one-way ANOVA test followed by Bonferroni post-hoc test. In (BF), WT = 10 animals; APP/PS1 = 5 animals; APP/PS1 + ANDRO = 7 animals; APP/PS1 + ANDRO + TMZ = 5 animals.

References

    1. Haque RU, Levey AI. Alzheimer's disease: A clinical perspective and future nonhuman primate research opportunities. Proc. Natl. Acad. Sci. U. S. A. 2019 doi: 10.1073/pnas.1912954116. - DOI - PMC - PubMed
    1. Serrano-Pozo A, Frosch MP, Masliah E, Hyman BT. Neuropathological alterations in Alzheimer disease. Cold Spring Harb. Perspect. Med. 2011;1:a006189. doi: 10.1101/cshperspect.a006189. - DOI - PMC - PubMed
    1. Selkoe DJ, Hardy J. The amyloid hypothesis of Alzheimer's disease at 25 years. EMBO Mol. Med. 2016;8:595–608. doi: 10.15252/emmm.201606210. - DOI - PMC - PubMed
    1. Moreno-Jimenez EP, et al. Adult hippocampal neurogenesis is abundant in neurologically healthy subjects and drops sharply in patients with Alzheimer's disease. Nat. Med. 2019;25:554–560. doi: 10.1038/s41591-019-0375-9. - DOI - PubMed
    1. Tobin MK, et al. Human hippocampal neurogenesis persists in aged adults and Alzheimer's disease patients. Cell Stem Cell. 2019;24:974–982 e973. doi: 10.1016/j.stem.2019.05.003. - DOI - PMC - PubMed

Publication types

MeSH terms