. 2021 Nov 25;11(1):22958.
doi: 10.1038/s41598-021-02489-4.

Upregulated type I interferon responses in asymptomatic COVID-19 infection are associated with improved clinical outcome

Affiliations

Upregulated type I interferon responses in asymptomatic COVID-19 infection are associated with improved clinical outcome

Kiran Iqbal Masood et al. Sci Rep. .

Abstract

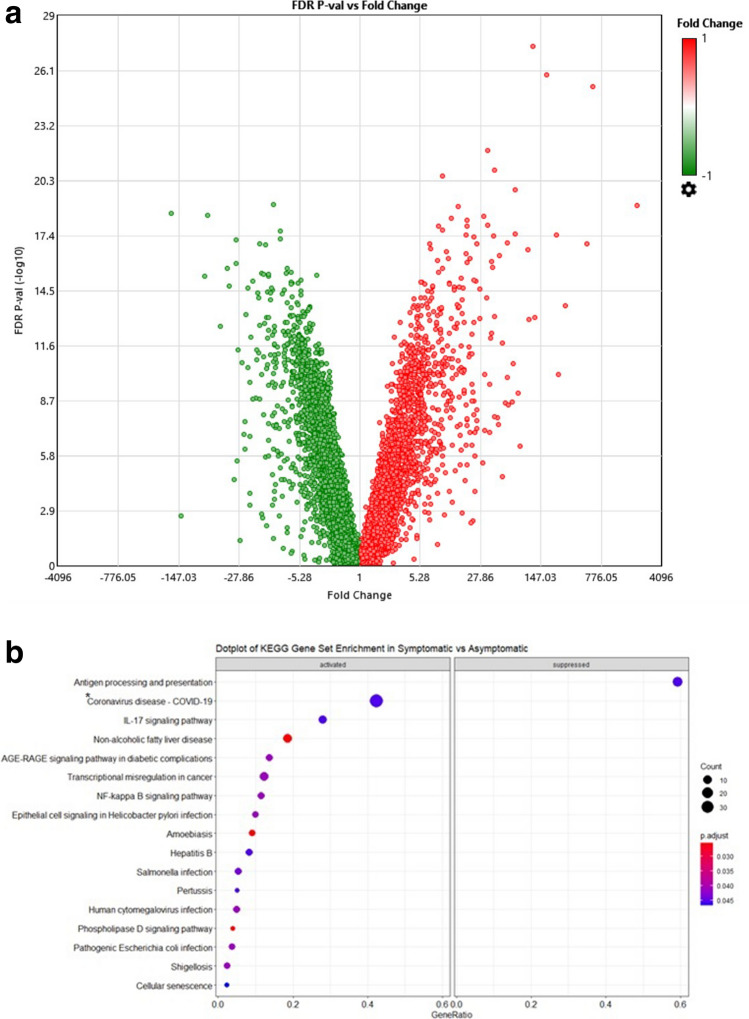
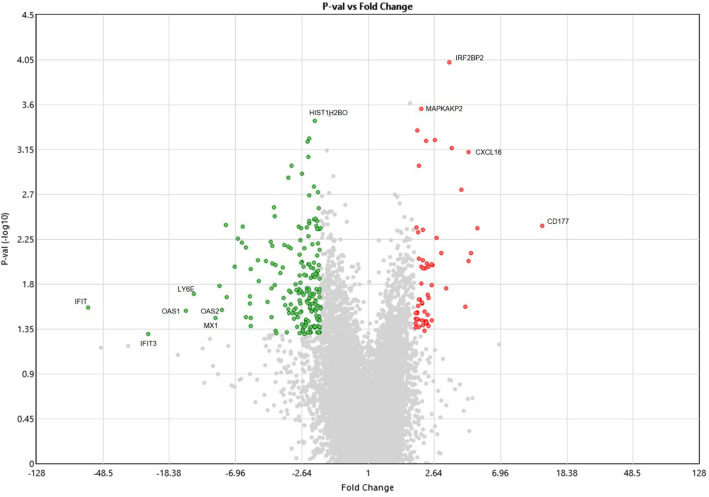
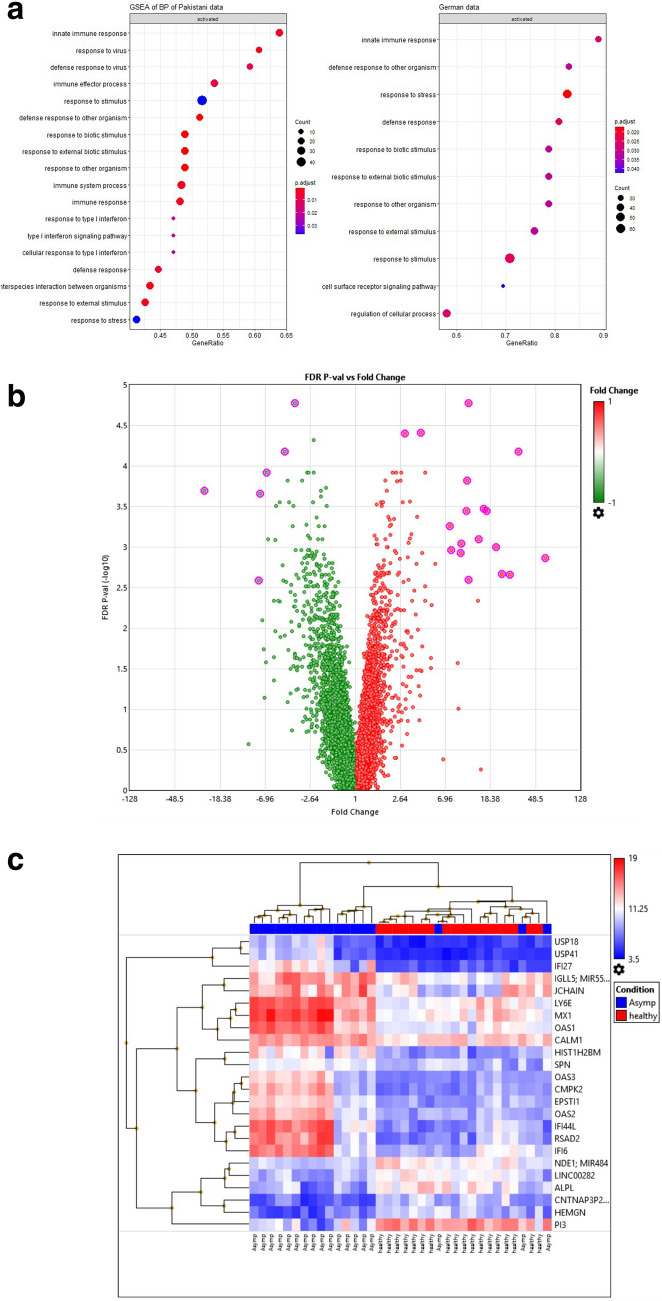
Understanding key host protective mechanisms against SARS-CoV-2 infection can help improve treatment modalities for COVID-19. We used a blood transcriptome approach to study biomarkers associated with differing severity of COVID-19, comparing severe and mild Symptomatic disease with Asymptomatic COVID-19 and uninfected Controls. There was suppression of antigen presentation but upregulation of inflammatory and viral mRNA translation associated pathways in Symptomatic as compared with Asymptomatic cases. In severe COVID-19, CD177 a neutrophil marker, was upregulated while interferon stimulated genes (ISGs) were downregulated. Asymptomatic COVID-19 cases displayed upregulation of ISGs and humoral response genes with downregulation of ICAM3 and TLR8. Compared across the COVID-19 disease spectrum, we found type I interferon (IFN) responses to be significantly upregulated (IFNAR2, IRF2BP1, IRF4, MAVS, SAMHD1, TRIM1), or downregulated (SOCS3, IRF2BP2, IRF2BPL) in Asymptomatic as compared with mild and severe COVID-19, with the dysregulation of an increasing number of ISGs associated with progressive disease. These data suggest that initial early responses against SARS-CoV-2 may be effectively controlled by ISGs. Therefore, we hypothesize that treatment with type I interferons in the early stage of COVID-19 may limit disease progression by limiting SARS-CoV-2 in the host.


Conflict of interest statement

The authors declare no competing interests.

Figures

Figure 1
Figure 1
Differential transcriptional expression between COVID-19 patients and uninfected Controls. (a) Principal component analysis helps to visualize the clustering of datasets into three groups: Symptomatic, n = 11 (Symp = purple), Asymptomatic, n = 18 (Asymp = red) and Controls, n = 18 (blue). (b) A barplot depicts the hierarchical clustering of differentially expressed genes (DEGs) as Up-regulated (red), Down-regulated (green) and Total (gray) genes within three comparative groups: Asymptomatic vs Controls (Asymp vs healthy), Asymptomatic vs Symptomatic (Asymp vs Symp) and Symptomatic vs Controls (healthy vs Symp). (c) Venn diagram depicts the overlapping DEGs observed between the COVID-19 Asymptomatic vs Symptomatic cases (medium orchid), Asymptomatic vs Controls (pink) and Symptomatic vs Controls (purple).
Figure 2
Figure 2
Symptomatic vs Asymptomatic COVID-19. (a) Volcano plot of Symptomatic vs Asymptomatic COVID-19 cases. The log2 (FC) (fold change) is plotted on the x-axis, and the negative log10 (FDR) (p-value) is plotted on the y-axis. The red points on the plot show Upregulated expression (n = 1939 genes), Downregulated genes (n = 1465) are shown in green. Analysis with the absolute value of log2 (FC) not less than 1 (FC = 2) and FDR values less than 0.05. (b) Dotplot of gene set enrichment analysis on KEGG molecular pathway applied on Symptomatic vs Asymptomatic COVID-19. KEGG molecular pathways on y-axis and gene ratio on x-axis. The greater the size of circle the greater the number of genes involved in a pathway the circles are colored based on p-adjusted value. ‘*’ ‘Coronavirus disease pathways’ ribosomal pathways, CXCL8 and NF-kB pathway.
Figure 3
Figure 3
Differential regulation of ISGs between severe and mild Symptomatic COVID-19 cases. Volcano plot of Symptomatic ‘Severe’ vs ‘Mild’ COVID-19 cases. The log2 (FC) (fold change) is plotted on the x-axis, and the negative log10 (FDR) (p-value) is plotted on the y-axis. The red points on the plot show Upregulated expression (n = 53 genes), Downregulated genes (n = 183) are shown in green. Analysis with the absolute value of log2 (FC) not less than 1 (FC = 2) and FDR values less than 0.05. Genes which have a p < 0.05 ANOVA with Benjamini–Hochberg FDR are illustrated. Selected highly differentially regulated genes are labelled.
Figure 4
Figure 4
Comparative transcriptomic profiles in Asymptomatic COVID-19 and healthy Controls. (a) Dotplot of gene set enrichment analysis (GSEA) on KEGG biological process applied on Asymptomatic COVID-19 and healthy Controls data. (b) Volcano plot of DEGs between Asymptomatics (n = 18) and Controls (n = 18) shows an overview of upregulated and suppressed genes. The log2 (FC) (fold change) is plotted on the x-axis, and the negative log10 (FDR) (p-value) is plotted on the y-axis. The red points on the plot show Upregulated- (n = 144) and Down-regulated genes (n = 277) are shown in green. Analysis with the absolute value of log2 (FC) not less than 1 (FC = 2) and FDR values less than 0.05. (c) Unsupervised hierarchical clustering of genes identified with FC > 7 and FDR P-val(− log10) > 2.5, highlighted in Fig. 3b is depicted. Each column represents condition of sample [Asymptomatic (blue), Healthy (red)] and each row represents a gene. The heat map indicates the level of gene expression, red is increased and blue indicates decreased expression. (d) A histogram of immune genes of DEGs with FC > 2 and FDR p < 0.05. The genes are plotted on x-axis and their related Fold-Change are plotted on y-axis with standard deviation shown as error bars.
Figure 5
Figure 5
Circulating levels of cytokines in plasma of COVID-19 cases and controls. Plasma from COVID-19 Asymptomatic (n = 12) and healthy Controls (n = 13) were tested using the Th1/Th2 25-plex Procartaplex assay. (A) IL-6, (B) TNF-α, (C) IL-1β, (D) IL-10, (E) IL-21, (F) IL-1Rα, (G) IL-1α, (H) IL-18, (I) IL-13, (J) IL-5 and (K) IFN-γ. Data is shown as median values (horizontal line) with IQR (10th–90th quartile). Data between group was analysed using the Mann–Whitney U non-parametric assay and p values < 0.05 are indicated as significantly different.
Figure 6
Figure 6
Differential activation of Interferon and cytokine genes across the COVID-19 severity spectrum. (a) Histogram of Interferon stimulated genes (ISGs) plotted on x-axis against avg(log2) values for severe (COVID-Sev), mild (COVID-Mild) and Asymptomatic (COVID-Asymp) cases. Higher avg(log2) values are exhibited by IFNAR2, MX1, OAS1 and SAMHD1. (b) Histogram of Cytokines/Chemokine genes plotted on x-axis against avg(log2) values for severe (COVID-Sev), mild (COVID-Mild) and Asymptomatic COVID-19 (COVID-Asymp). Higher avg(log2) values are exhibited by CCL5, IL1R2, NAMPT and PPBP. Significant p-values of COVID-Sev vs COVID-Asymp is labelled by * and significant p-values of COVID-Mod vs COVID-Asymp is donated by #.

Similar articles

Cited by

References

    1. JHU. COVID-19 Data Repository by the Center for Systems Science and Engineering (CSSE) at Johns Hopkins University. https://github.com/CSSEGISandData/COVID-19 (2021).
    1. Pakistan Bureau of Statistics . Social Indicators of Pakistan. Pakistan Bureau of Statistics; 2016.
    1. Government of Pakistan. COVID-19 Health Advisory Platform. Ministry of National Health Services Regulations and Coordination.https://covid.gov.pk/ (2021).
    1. Lai CC, et al. Global epidemiology of coronavirus disease 2019 (COVID-19): Disease incidence, daily cumulative index, mortality, and their association with country healthcare resources and economic status. Int. J. Antimicrob. Agents. 2020;55:105946. doi: 10.1016/j.ijantimicag.2020.105946. - DOI - PMC - PubMed
    1. Dil S, Dil N, Maken ZH. COVID-19 trends and forecast in the eastern mediterranean region with a particular focus on Pakistan. Cureus. 2020;12:e8582. doi: 10.7759/cureus.8582. - DOI - PMC - PubMed

Publication types

MeSH terms