. 2021 Nov 25;4(1):1336.
doi: 10.1038/s42003-021-02875-8.

C. elegans TFIIH subunit GTF-2H5/TTDA is a non-essential transcription factor indispensable for DNA repair

Affiliations

C. elegans TFIIH subunit GTF-2H5/TTDA is a non-essential transcription factor indispensable for DNA repair

Karen L Thijssen et al. Commun Biol. .

Abstract

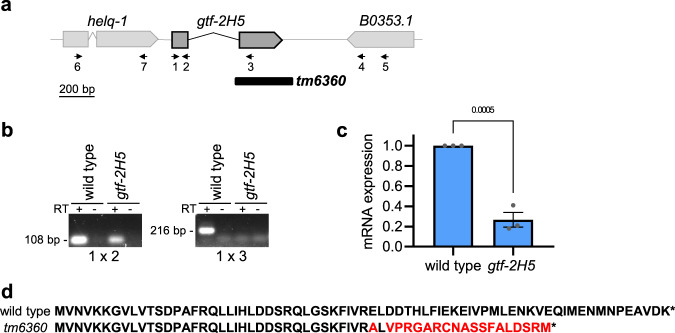
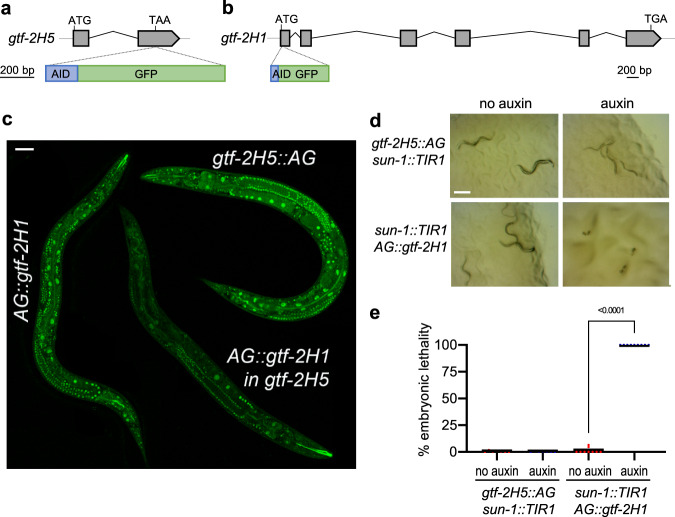
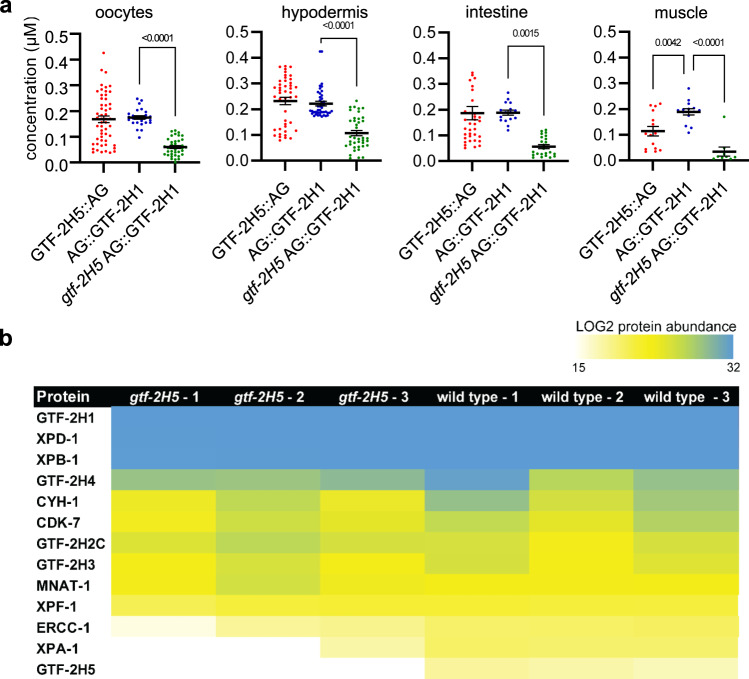
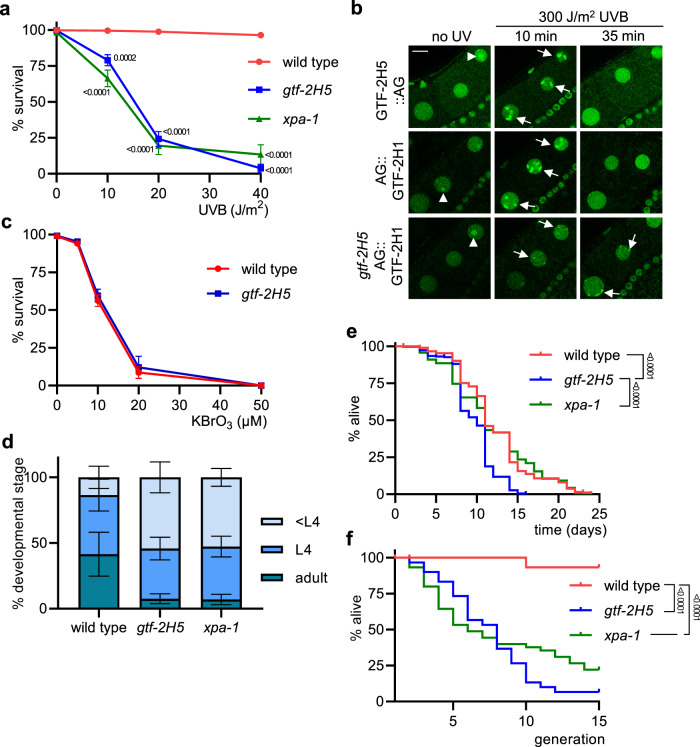
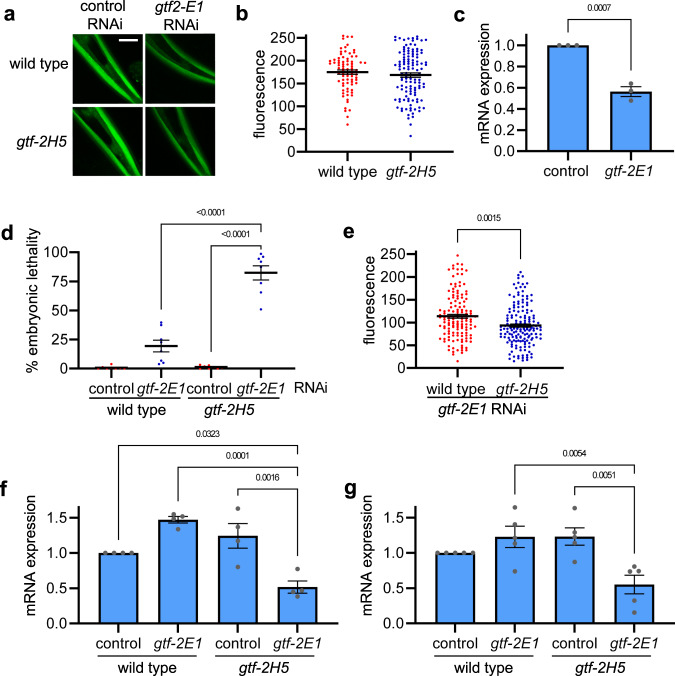
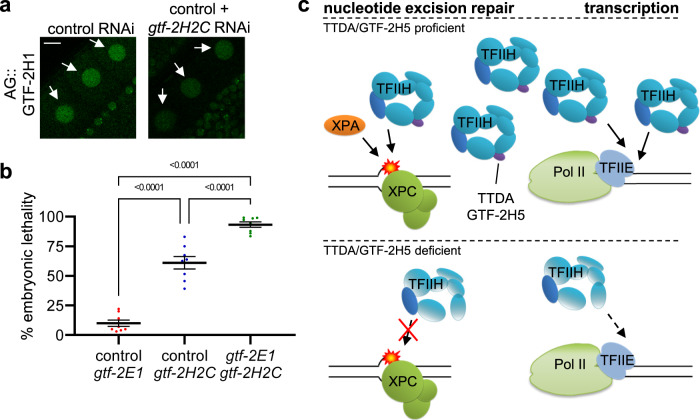
The 10-subunit TFIIH complex is vital to transcription and nucleotide excision repair. Hereditary mutations in its smallest subunit, TTDA/GTF2H5, cause a photosensitive form of the rare developmental disorder trichothiodystrophy. Some trichothiodystrophy features are thought to be caused by subtle transcription or gene expression defects. TTDA/GTF2H5 knockout mice are not viable, making it difficult to investigate TTDA/GTF2H5 in vivo function. Here we show that deficiency of C. elegans TTDA ortholog GTF-2H5 is, however, compatible with life, in contrast to depletion of other TFIIH subunits. GTF-2H5 promotes TFIIH stability in multiple tissues and is indispensable for nucleotide excision repair, in which it facilitates recruitment of TFIIH to DNA damage. Strikingly, when transcription is challenged, gtf-2H5 embryos die due to the intrinsic TFIIH fragility in absence of GTF-2H5. These results support the idea that TTDA/GTF2H5 mutations cause transcription impairment underlying trichothiodystrophy and establish C. elegans as model for studying pathogenesis of this disease.


Conflict of interest statement

The authors declare no competing interests.

Figures

Fig. 1
Fig. 1. The gtf-2H5(tm6360) allele encodes a truncated protein.
a Schematic depiction of gtf-2H5 locus with parts of flanking genes helq-1 and B0353.1. Numbered arrows indicate positions of primers used in RT-(q)PCR. Primer sequences are listed in Supplementary Table 2. The deletion of the tm6360 allele is indicated with a black box. b PCR with primer pairs 1 × 2 or 1 × 3, as indicated in a, on cDNA of wild type or gtf-2H5 animals. Lanes containing cDNA generated by reverse transcription of mRNA are labeled with ‘+’. As control, PCR on cDNA reaction samples without reverse transcriptase (RT) were included, labeled with ‘−‘. Full image of the gel is shown in Supplementary Fig. 4. c Relative mRNA expression levels of exon 1 of the gtf-2H5 transcript as determined by qPCR on wild type and gtf-2H5 mutant animals. mRNA levels were normalized to wild type. Results are plotted as average with SEM (error bars) of three independent experiments. p value indicating statistical significance is shown. d Amino acid sequence of wild type GTF-2H5 and of the truncated protein predicted to be expressed by the tm6360 gtf-2H5 allele. Red color indicate sequence that deviates from wild type. Numerical data are provided in Supplementary Data 2.
Fig. 2
Fig. 2. GTF-2H5 and GTF-2H1 are ubiquitously expressed but at different concentrations.
a Schematic depiction of the gtf-2H5 locus and C-terminal knockin site of the AID::GFP tag. b Schematic depiction of the gtf-2H1 locus and N-terminal knockin site of the AID::GFP tag. c Composite overview image generated by merging independent confocal scans of gtf-2H5::AG, AG::gtf-2H1 and gtf-2H5; AG::gtf-2H1. Scale bar: 50 µm. d Stereo microscope view of the offspring of gtf-2H5::AG and AG::gtf-2H1 animals expressing TIR1 under control of the sun-1 promoter grown in absence or presence of 1 mM auxin. Only auxin-induced depletion of AG::gtf-2H1 leads to embryonic lethality. Scale bar: 0.2 mm. e Quantification of the experiment described in d. Shown is a scatter dot plot of the average percentage embryonic lethality observed on at least seven plates for each condition in two independent experiments. p value indicating statistical significance is shown. Numerical data are provided in Supplementary Data 2.
Fig. 3
Fig. 3. TFIIH protein levels and composition in gtf-2H5 mutants.
a Quantification of GTF-2H5::AG and AG::GTF-2H1 concentration in nuclei of oocytes, hypodermal, intestinal and muscles cells of wild type and gtf-2H5 animals. Concentration was determined by comparison of the average fluorescence levels in the entire nucleus to the fluorescence of known concentrations of purified GFP. p values indicating statistical significance are shown. Numerical data are provided in Supplementary Data 2. b Heat map representation of protein abundance, based on summed peptide intensities (normalized to bait AG::GTF-2H1), of TFIIH subunits and NER proteins XPF-1, ERCC-1 and XPA-1 in three replicate AG::GTF-2H1 immunoprecipitation experiments analyzed by mass spectrometry.
Fig. 4
Fig. 4. gtf-2H5 animals are NER deficient and show diminished growth and lifespan.
a Germ cell and embryo survival assay after UVB irradiation of germ cells in young adult wild type, gtf-2H5 and xpa-1 animals. The percentages of hatched eggs (survival) after UVB irradiation are plotted against the applied UV-B doses. Results are plotted as average with SEM (error bars) of at least seven experiments. Number of animals counted, respectively for UV dose 0, 10, 20, 30 and 40 J/m2, for wild type n = 735, 820, 832 and 738; for gtf-2H5 n = 725, 495, 314 and 117; for xpa-1 n = 480, 284, 156 and 83. p values indicating statistical significant difference compared to wild type are shown. b Representative images showing real-time recruitment of GTF-2H5::AG or AG::GTF-2H1 to UVB-damaged chromosomes in oocytes of living wild type (upper and middle panel) or gtf-2H5 (lower panel) animals, before UVB irradiation (no UV) and 10 min and 35 min after 300 J/m2 UVB irradiation. Recruitment to paired homologous chromosomes are indicated with arrows. Nucleoli are indicated with an arrowhead. Scale bar: 10 µm. c Survival assay after incubation of wild type and gtf-2H5 L1/L2 larvae with increasing concentrations of KBrO3 for 24 h, which induces oxidative DNA damage. The percentages of non-arrested, developing larvae (survival) are plotted against the applied KBrO3 concentration. Results are plotted as average with SEM (error bars) of two independent experiments each performed in triplicate. Number of animals counted, respectively for KBrO3 dose 0, 5, 10, 20, and 50 µM, for wild type n = 637, 756, 707, 558 and 456; for gtf-2H5 n = 708, 688, 894, 505 and 467. d Quantification of larval growth of wild type, gtf-2H5 and xpa-1 animals by determining the percentage of adult, L4 and younger than L4 (<L4) animals observed 48 h after animals are laid as eggs at 25 °C. Results are plotted as average with SEM (error bars) of at least four independent experiments. Number of animals counted are for wild type n = 905, for gtf-2H5 n = 846 and for xpa-1 n = 456. e Post-mitotic lifespan analysis showing the percentage of alive adult wild type (n = 290), gtf-2H5 (n = 300) and xpa-1 (n = 285) animals per day. p values indicating statistical significance are shown. f Replicative lifespan analysis showing the percentage survival of successive generations of wild type, gtf-2H5 and xpa-1 animals if, in each generation, one animal is passaged. Depicted are cumulative results from at least two independent experiments (n = 15 per experiment). p values indicating statistical significance are shown. Numerical data are provided in Supplementary Data 2.
Fig. 5
Fig. 5. GTF-2H5 promotes transcription when this is challenged.
a Representative images of wild type and gtf-2H5 animals expressing AID::GFP under control of eft-3 promoter in body wall muscles, shown here in the head of C. elegans, grown on control or gtf-2E1 RNAi. Scale bar: 25 µm. b Scatter dot plot showing average and SEM of the relative GFP fluorescence levels in head muscle cells of wild-type and gtf-2H5 animals, as depicted in a. c Relative gtf-2E1 mRNA levels as determined by qPCR on animals grown on control or gtf-2E1 RNAi. Results are normalized to control RNAi and plotted as average with SEM (error bars) of three independent experiments. d Scatter dot plot showing the average percentage with SEM of embryonic lethality observed on eight plates in two independent experiments with either wild type animals or gtf-2H5 animals (both also carrying the eft-3::GFP transgene used in a and b, grown on control or gtf-2E1 RNAi food. Number of animals counted for wild type are n = 617 (control RNAi), n = 570 (gtf-2E1 RNAi) and for gtf-2H5 n = 597 (control RNAi), n = 419 (gtf-2E1 RNAi). e Scatter dot plot showing average and SEM of the relative GFP fluorescence levels in head muscle cells of wild-type and gtf-2H5 animals grown on gtf-2E1 RNAi food, as depicted in a. f Relative cdc-42 mRNA levels as determined by qPCR on wild type or gtf-2H5 animals grown on control or gtf-2E1 RNAi. Results are normalized to wild type on control RNAi and plotted as average with SEM (error bars) of four independent experiments. g Relative pmp-3 mRNA levels as determined by qPCR on wild type or gtf-2H5 animals grown on control or gtf-2E1 RNAi. Results are normalized to wild type on control RNAi and plotted as average with SEM (error bars) of five independent experiments. p values indicating statistical significance are shown. Numerical data are provided in Supplementary Data 2.
Fig. 6
Fig. 6. Synthetic lethality between GTF-2H2C and GTF-2E1 and model for GTF-2H5 activity.
a Representative images of AG::GTF-2H1 fluorescence in oocyte nuclei (indicated by arrows) of AG::gtf-2H1 knockin animals grown on control RNAi or a 1:1 mixture of control and gtf-2H2C RNAi food. Scale bar: 10 µm. b Scatter dot plot showing the average percentage with SEM of embryonic lethality observed on eight plates in two independent experiments with wild type animals grown on 1:1 mixtures of control RNAi with gtf-2E1 RNAi food (n = 574), control RNAi with gtf-2H2C RNAi food (n = 1009) or gtf-2E1 RNAi and gtf-2H2C RNAi food (n = 730). p value indicating statistical significance is shown. Numerical data are provided in Supplementary Data 2. c Model for TTDA/GTF-2H5 involvement in nucleotide excision repair and transcription initiation. In wild type cells (upper part), TTDA/GTF-2H5 is the smallest subunit of a fully functional TFIIH complex, which exists in sufficiently high concentrations to promote nucleotide excision repair together with XPC and XPA and transcription initiation by RNA polymerase II (Pol II) together with TFIIE (and other not depicted repair and transcription factors). In TTDA/GTF-2H5 deficient cells (lower part), the TFIIH complex is not efficiently recruited and active in nucleotide excision repair. Also, as the complex is unstable and exists in low concentrations, it can only support transcription initiation if this is not too demanding.

References

    1. Compe E, Egly JM. Nucleotide excision repair and transcriptional regulation: TFIIH and beyond. Annu. Rev. Biochem. 2016;85:265–290. - PubMed
    1. Luo J, et al. Architecture of the human and yeast general transcription and DNA repair factor TFIIH. Mol. Cell. 2015;59:794–806. - PMC - PubMed
    1. Compe E, Genes CM, Braun C, Coin F, Egly JM. TFIIE orchestrates the recruitment of the TFIIH kinase module at promoter before release during transcription. Nat. Commun. 2019;10:1–14. - PMC - PubMed
    1. Ohkuma Y, Roeder RG. Regulation of TFIIH ATPase and kinase activities by TFIIE during active initiation complex formation. Nature. 1994;368:160–163. - PubMed
    1. Coin F, Bergmann E, Tremeau-Bravard A, Egly JM. Mutations in XPB and XPD helicases found in xeroderma pigmentosum patients impair the transcription function of TFIIH. EMBO J. 1999;18:1357–1366. - PMC - PubMed

Publication types

MeSH terms