. 2021 Oct 25;11(22):15800-15814.
doi: 10.1002/ece3.8250. eCollection 2021 Nov.

Waste not, want not: Microsatellites remain an economical and informative technology for conservation genetics

Affiliations

Waste not, want not: Microsatellites remain an economical and informative technology for conservation genetics

Samantha S Hauser et al. Ecol Evol. .

Abstract

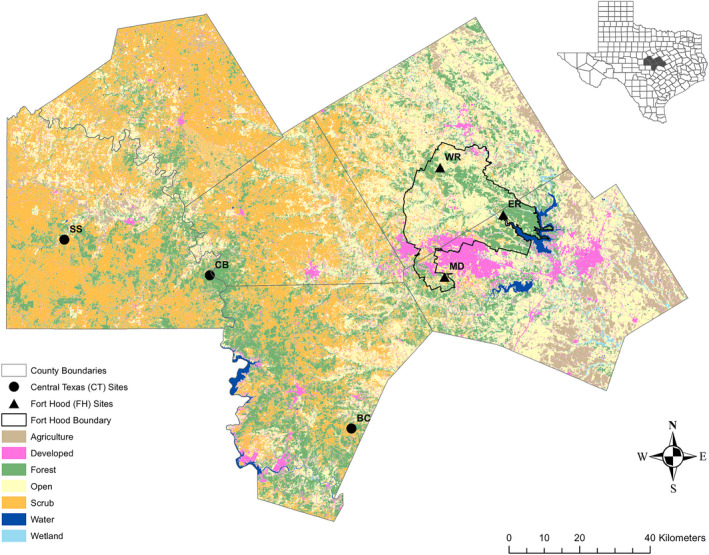
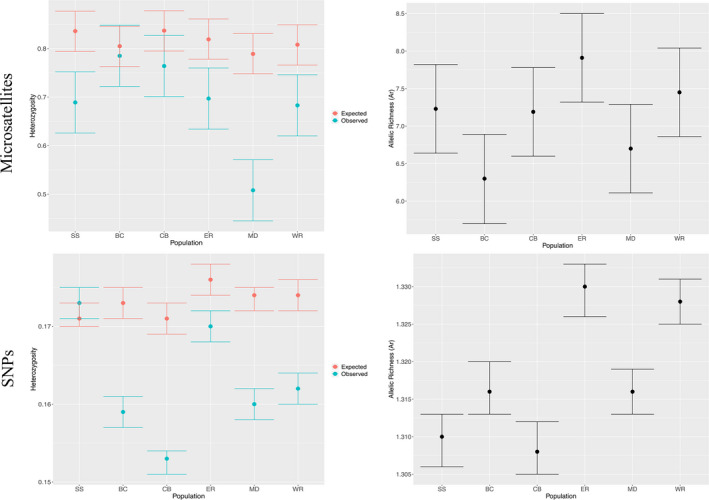
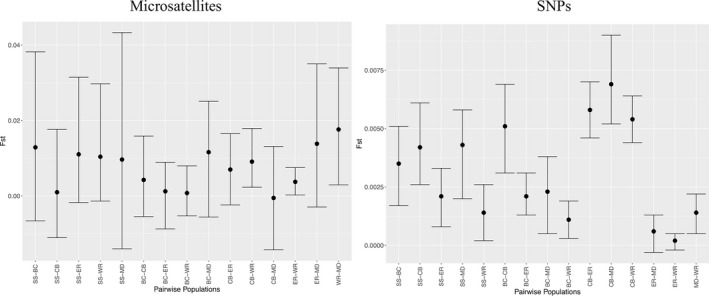
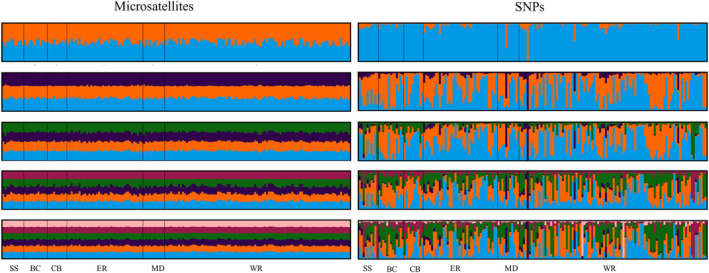
Comparisons of microsatellites and single-nucleotide polymorphisms (SNPs) have found that SNPs outperform microsatellites in population genetic analyses, questioning the continued utility of microsatellites in population and landscape genetics. Yet, highly polymorphic markers may be of value in species that have reduced genetic variation. This study repeated previous analyses that used microsatellites with SNPs developed from ddRAD sequencing in the black-capped vireo source-sink system. SNPs provided greater resolution of genetic diversity, population differentiation, and migrant detection but could not reconstruct parentage relationships due to insufficient heterozygosities. The biological inferences made by both sets of markers were similar: asymmetrical gene flow from source sites to the remaining sink sites. With the landscape genetic analyses, we found different results between the two molecular markers, but associations of the top environmental features (riparian, open habitat, agriculture, and human development) with dispersal estimates were shared between marker types. Despite the higher precision of SNPs, we find that microsatellites effectively uncover population processes and patterns and are superior for parentage analyses in this species with reduced genetic diversity. This study illustrates the continued applicability and relevance of microsatellites in population genetic research.

Keywords: genomics; molecular markers; next‐generation sequencing; parentage; population structure; resistance surfaces.


Conflict of interest statement

The authors have no conflicts of interest to report.

Figures

FIGURE 1
FIGURE 1
Black‐capped vireo study sites in central Texas (black circles) including Balcones Canyonlands (BC), Colorado Bend State Park (CB), San Saba Property (SS), and on Fort Hood (black triangles) including East Range combined (ER), Maxdale (MD), and West Range combined (WR). The six landscape cover types depicted as follows: agricultural croplands in brown, human development in magenta, forest in green, open habitat (including grazing lands) in yellow, scrub in orange, water bodies in navy blue, and wetlands in light blue
FIGURE 2
FIGURE 2
Genetic diversity estimates (dots) with 95% confidence intervals (error bars) per black‐capped vireo population: BC, CB, ER, MD, SS, WR. Observed and expected heterozygosity (blue and orange, respectively) per population in the left panel and allelic richness (A r, in black) per population on the right panel. Estimates in which their 95% confidence intervals overlap are not statistically different
FIGURE 3
FIGURE 3
Pairwise F ST estimates (dots) with 95% confidence intervals (error bars) between black‐capped vireo populations: BC, CB, ER, SS, MD, WR. Estimates that overlap with 0 are not statistically significant and estimates in which 95% confidence intervals overlap are not statistically different from one another
FIGURE 4
FIGURE 4
Weak to no population structuring among Blackbcapped vireo populations (BC, CB, SS, ER, MD, and WR). STRUCTURE barplots for k values (number of unique clusters) 2 through 4. Each vertical line represents the genetic signature of an individual with colors representing each cluster
FIGURE 5
FIGURE 5
No signature of isolation by distance at an individual (left panel) or population level (right panel). The relationship between genetic similarity (proportion of shared alleles; Dps) on the y‐axis and Euclidean distance (in meters; m) on the x‐axis

References

    1. Adamack, A. T. , & Gruber, B. (2014). PopGenReport: Simplifying basic population genetic analyses in R. Methods in Ecology and Evolution, 5(4), 384–387.
    1. Ahrens, C. W. , Rymer, P. D. , Stow, A. , Bragg, J. , Dillon, S. , Umbers, K. D. L. , & Dudaniec, R. Y. (2018). The search for loci under selection: Trends, biases and progress. Molecular Ecology, 27(6), 1342–1356. 10.1111/mec.14549 - DOI - PubMed
    1. Altman, N. , & Krzywinski, M. (2016). Points of significance: P values and the search for significance. Nature Methods, 14(1), 3–4. 10.1038/nmeth.4120 - DOI
    1. Andrews, K. R. , & Luikart, G. (2014). Recent novel approaches for population genomics data analysis. Molecular Ecology, 23(7), 1661–1667. 10.1111/mec.12686 - DOI - PubMed
    1. Athrey, G. , Barr, K. R. , Lance, R. F. , & Leberg, P. L. (2012). Birds in space and time: Genetic changes accompanying anthropogenic habitat fragmentation in the endangered black‐capped vireo (Vireo atricapilla). Evolutionary Applications, 5(6), 540–552. - PMC - PubMed

LinkOut - more resources