. 2021 May 7;11(9):5148-5165.
doi: 10.1021/acscatal.1c00438. Epub 2021 Apr 14.

Tools and Methods for Investigating Synthetic Metal-Catalyzed Reactions in Living Cells

Affiliations

Tools and Methods for Investigating Synthetic Metal-Catalyzed Reactions in Living Cells

Dat P Nguyen et al. ACS Catal. .

Abstract

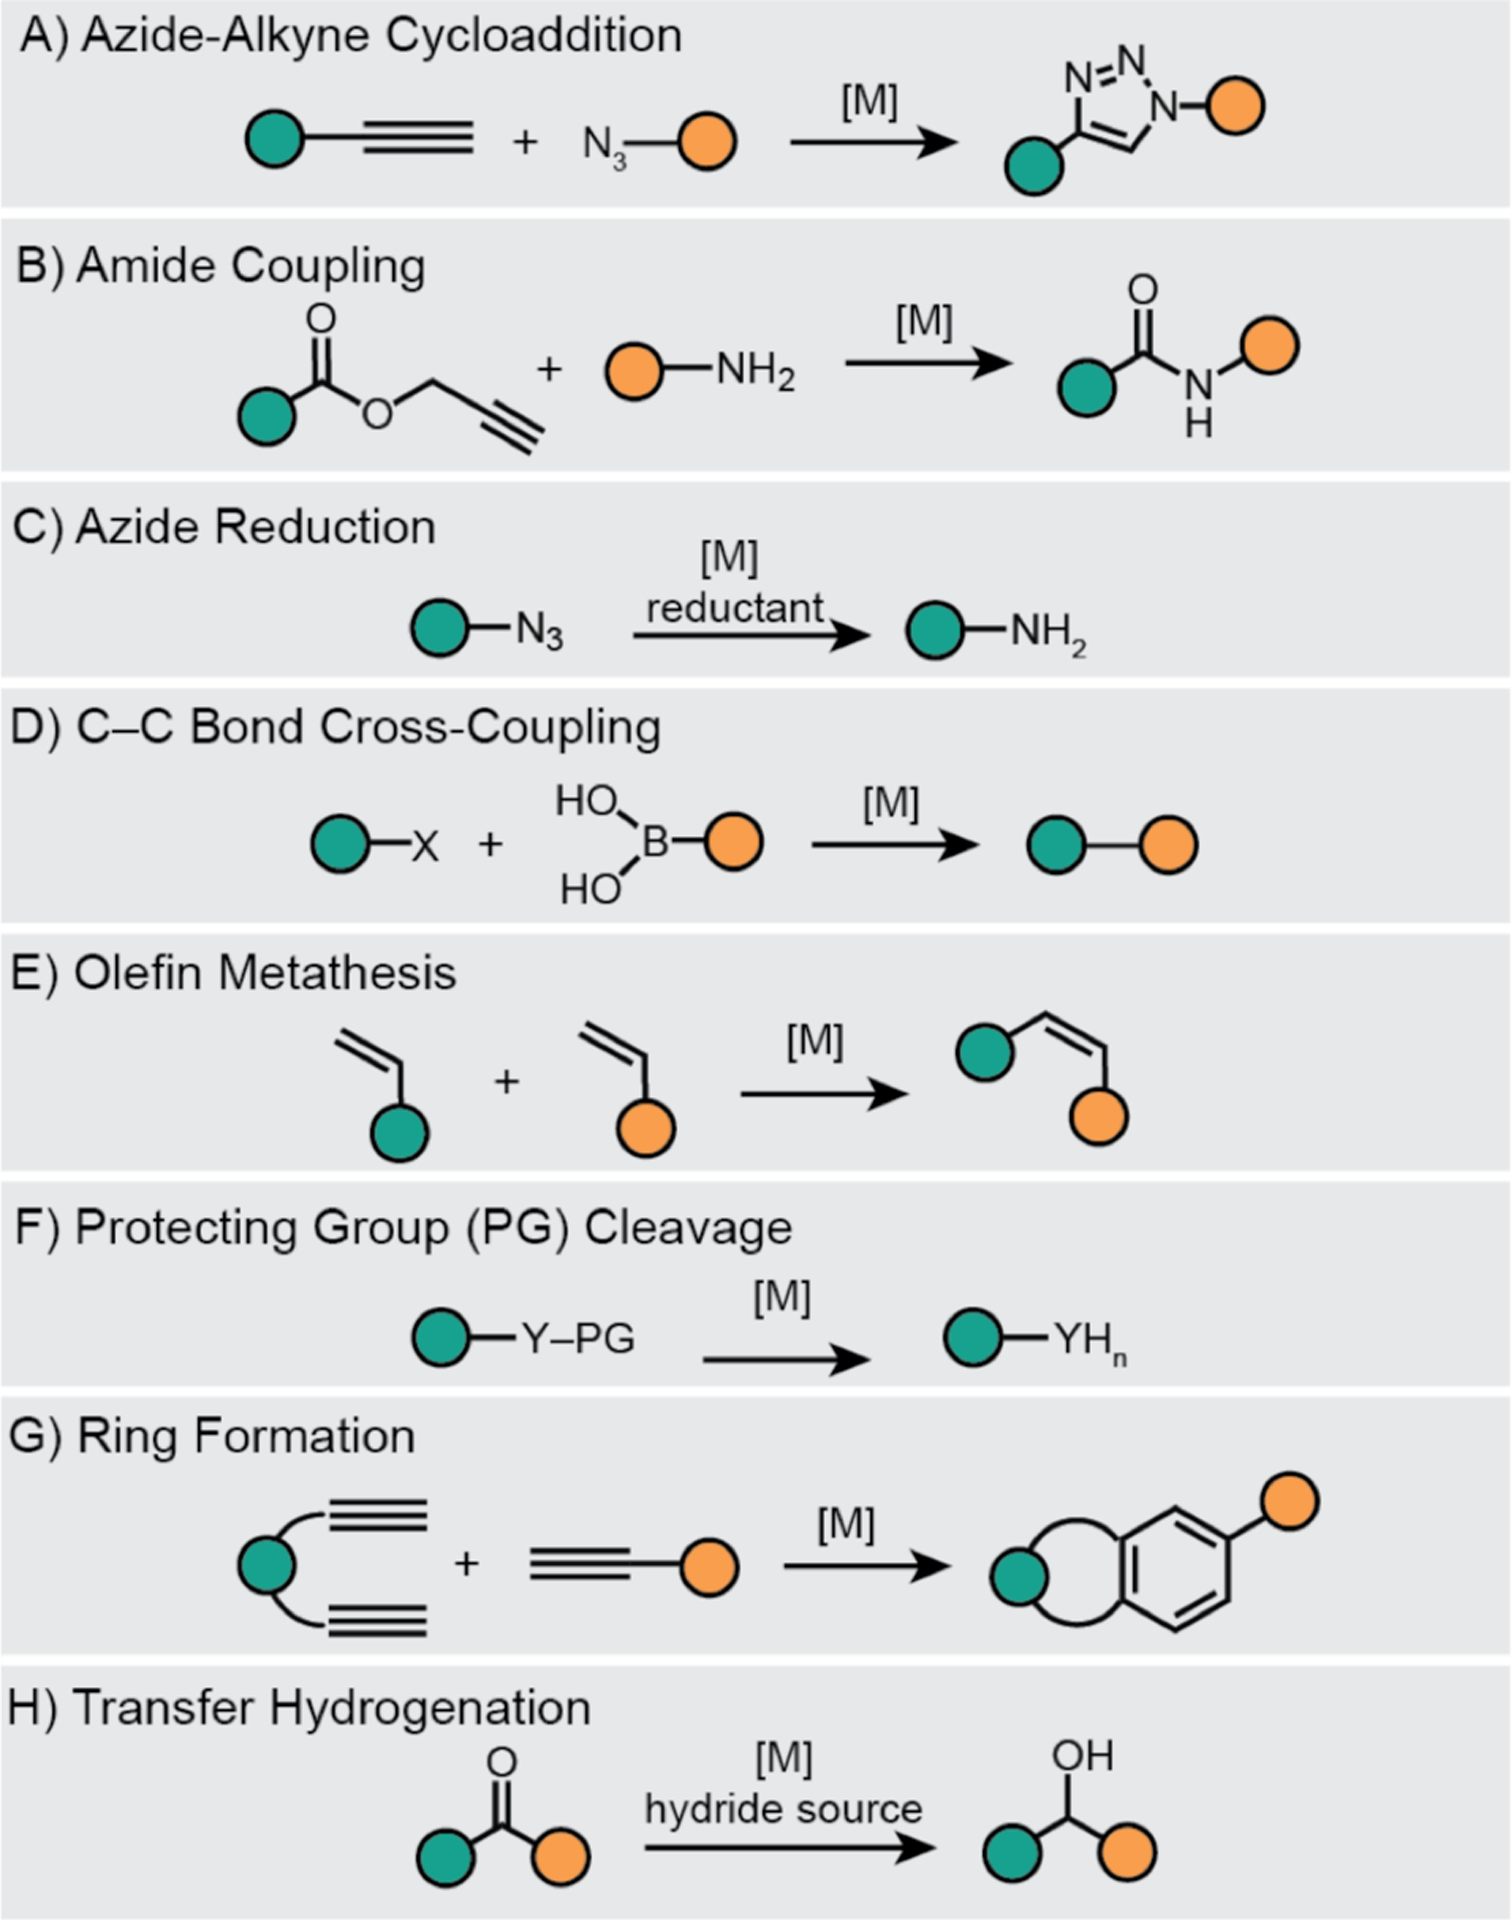
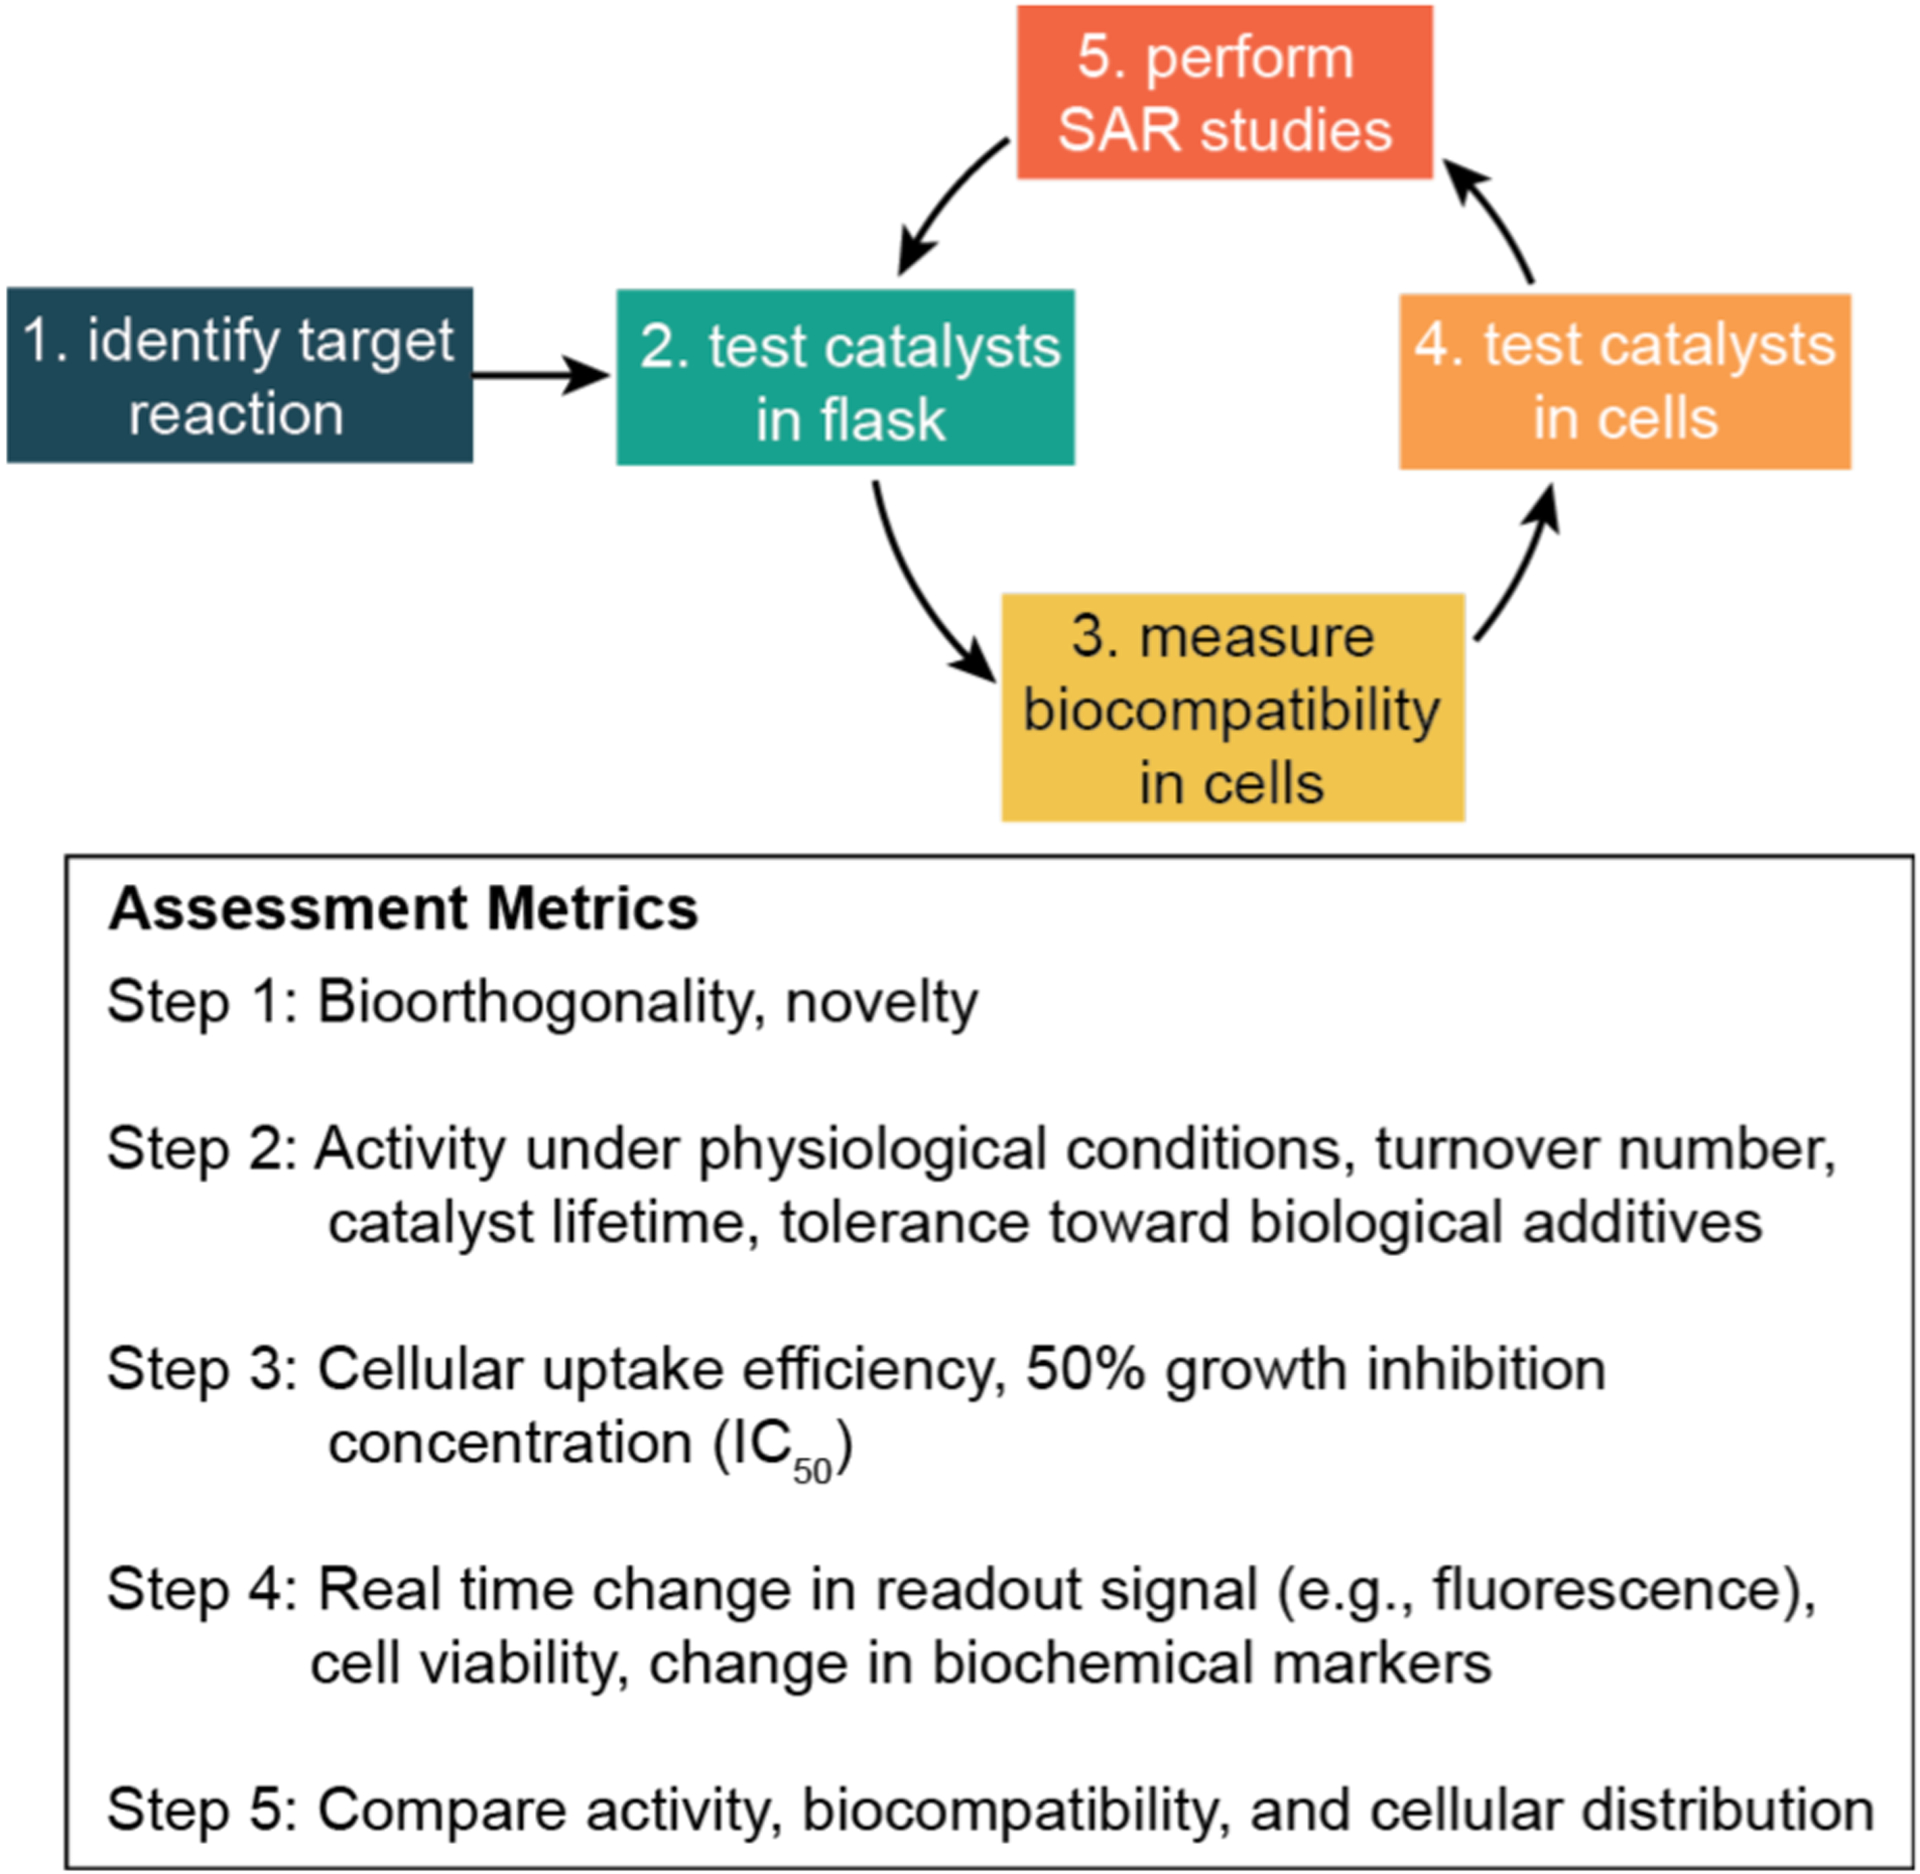
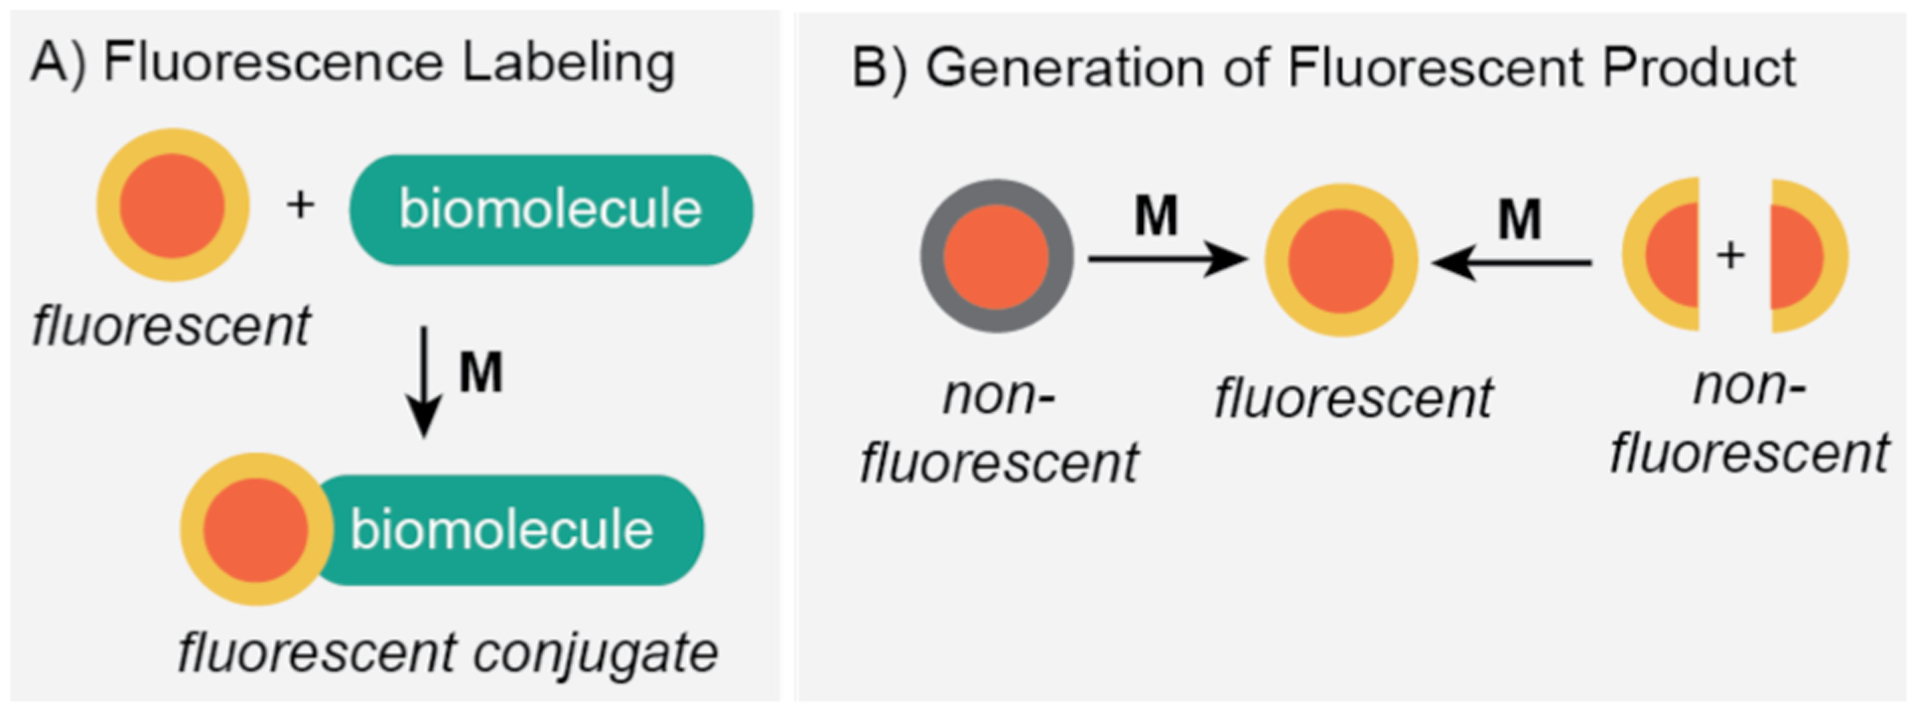
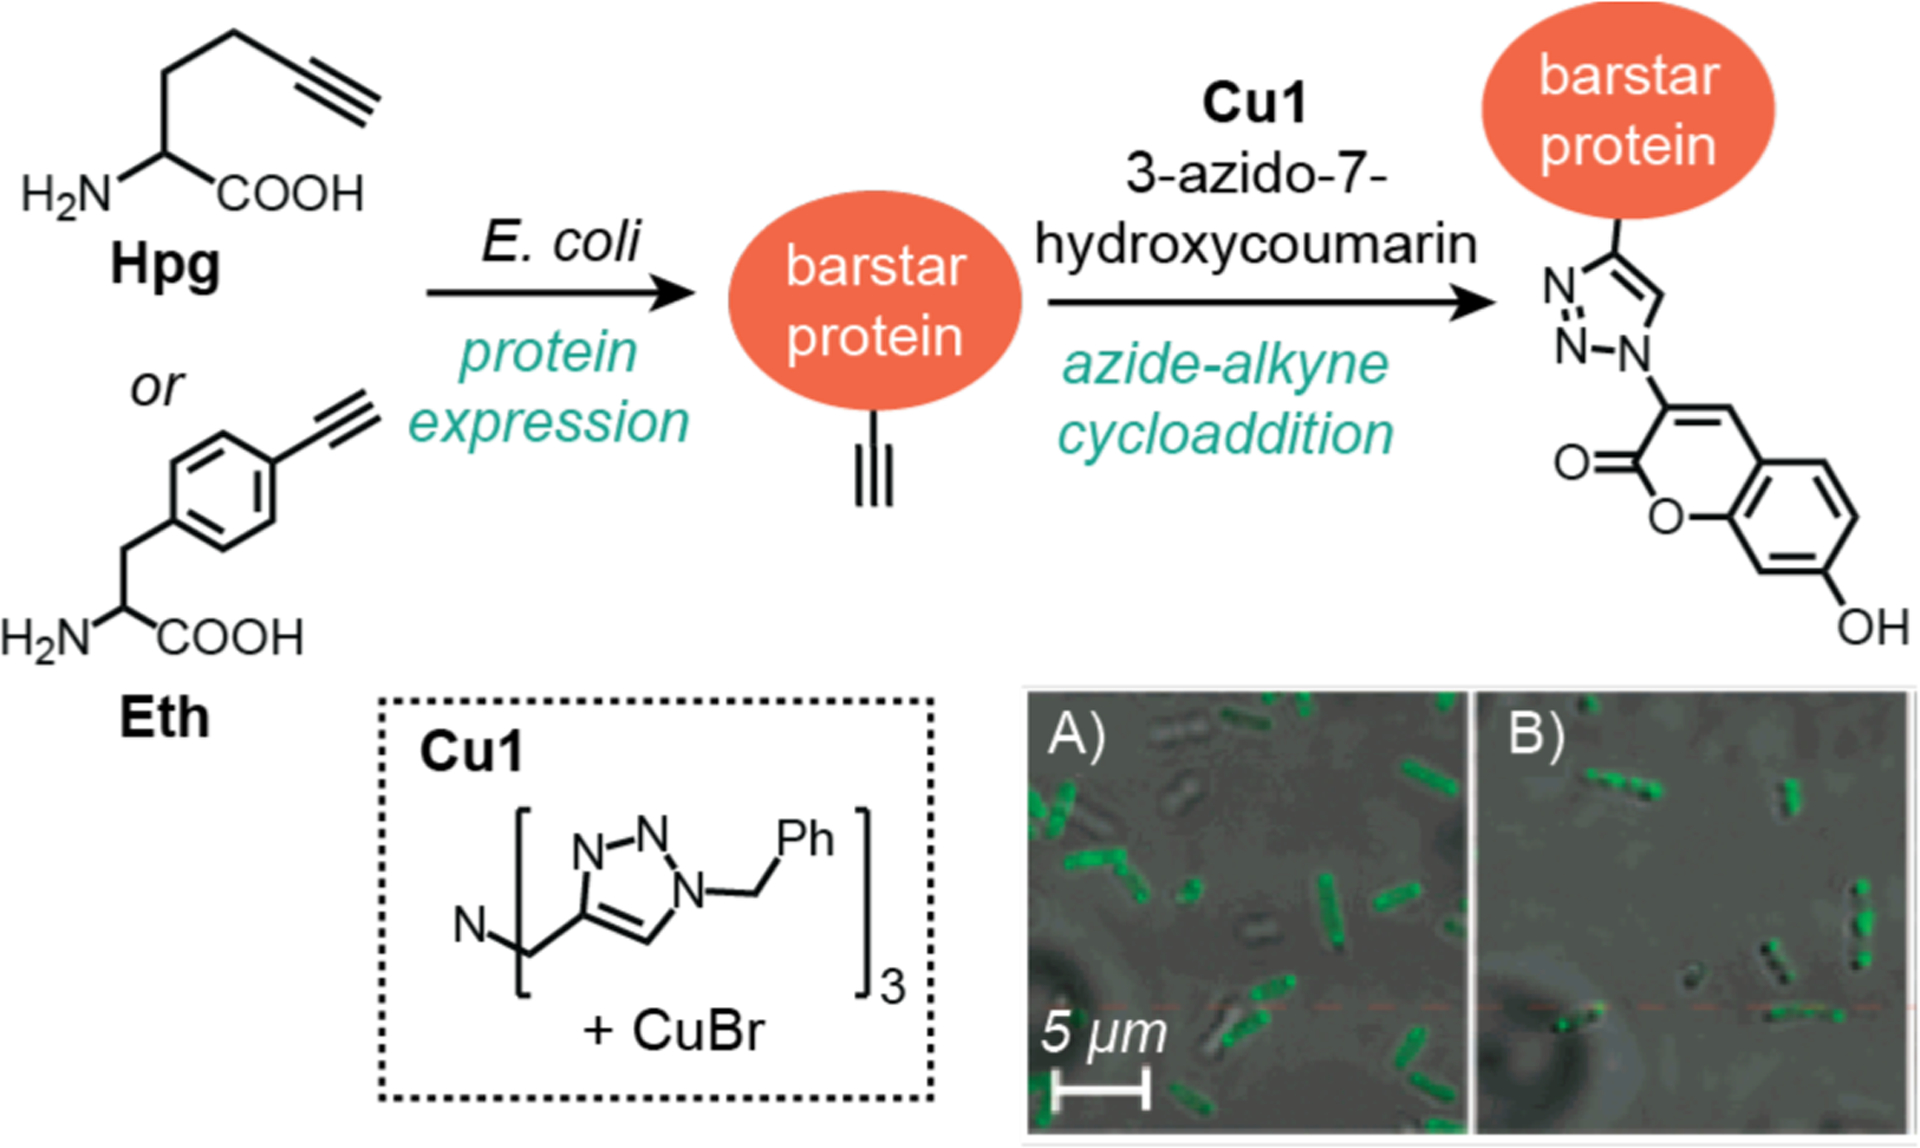
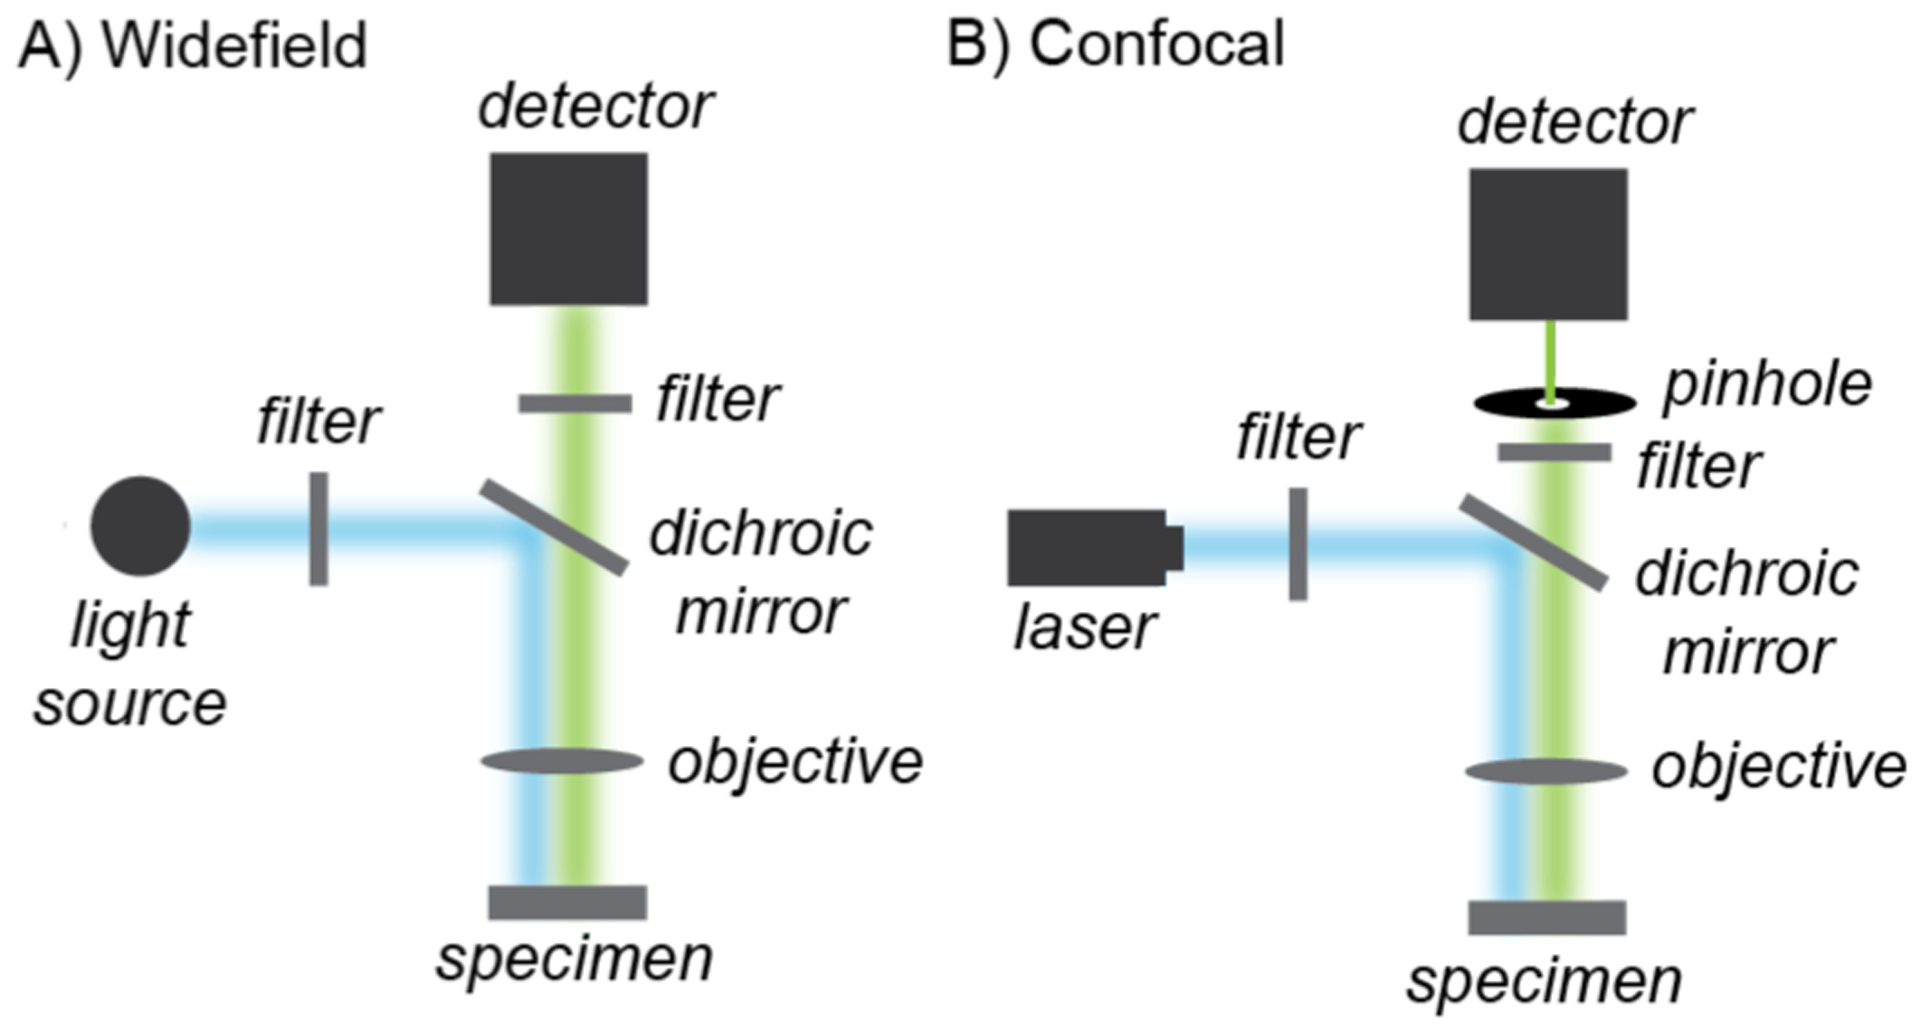
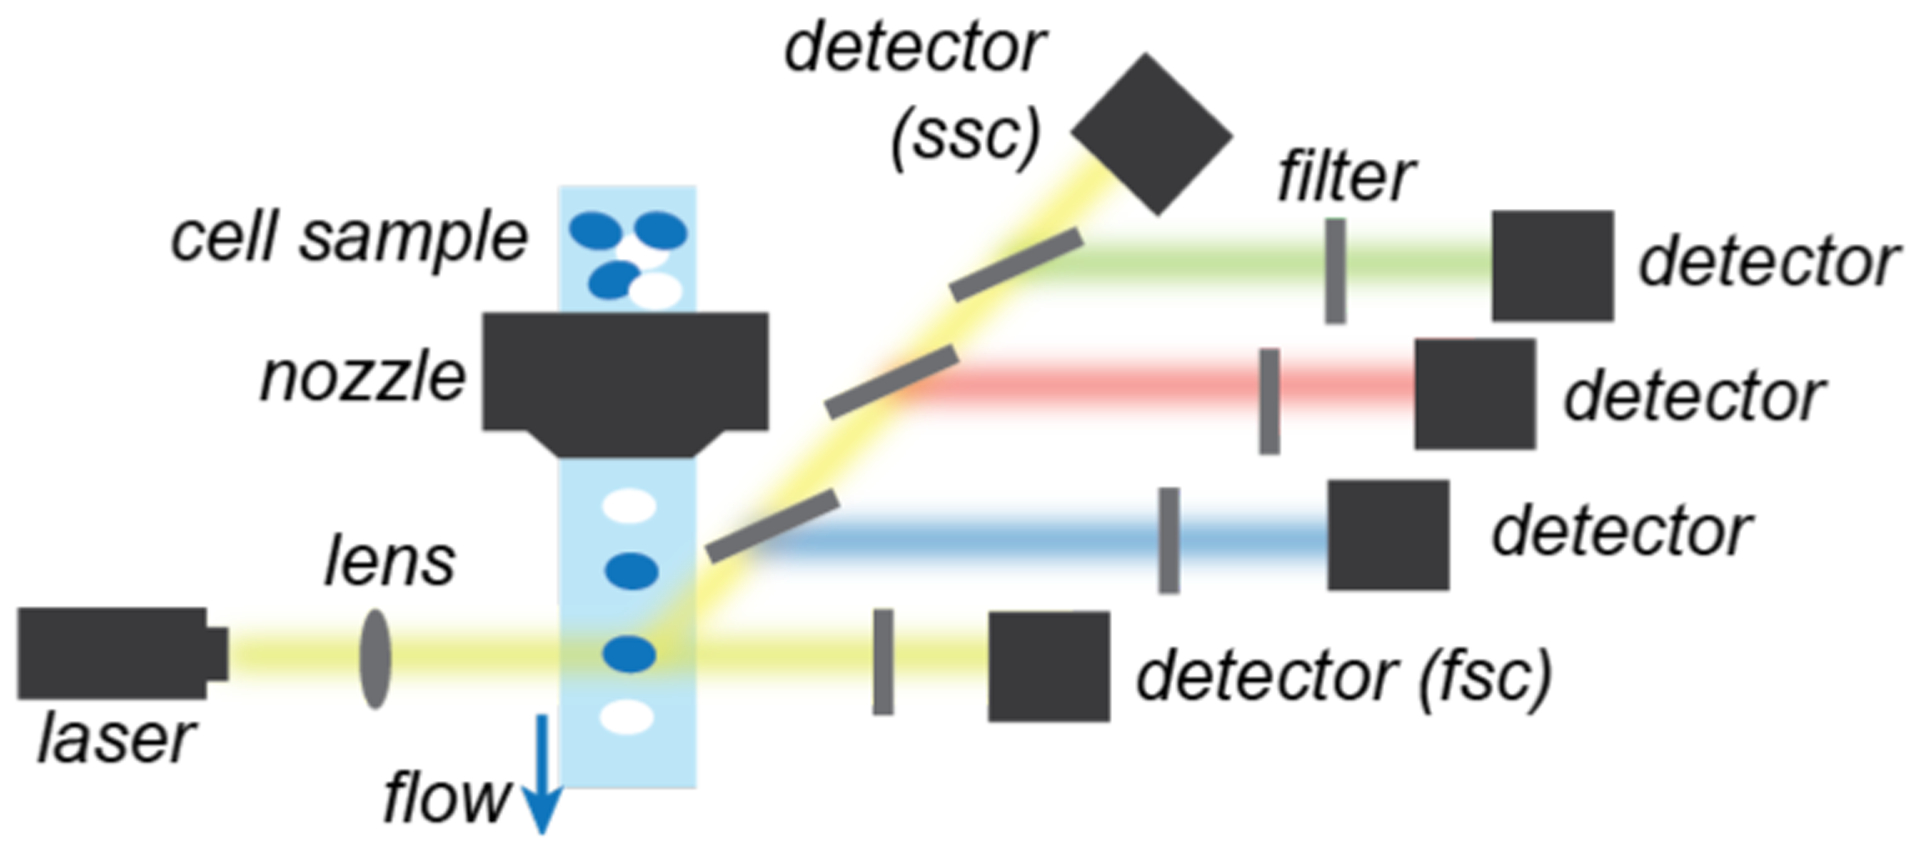
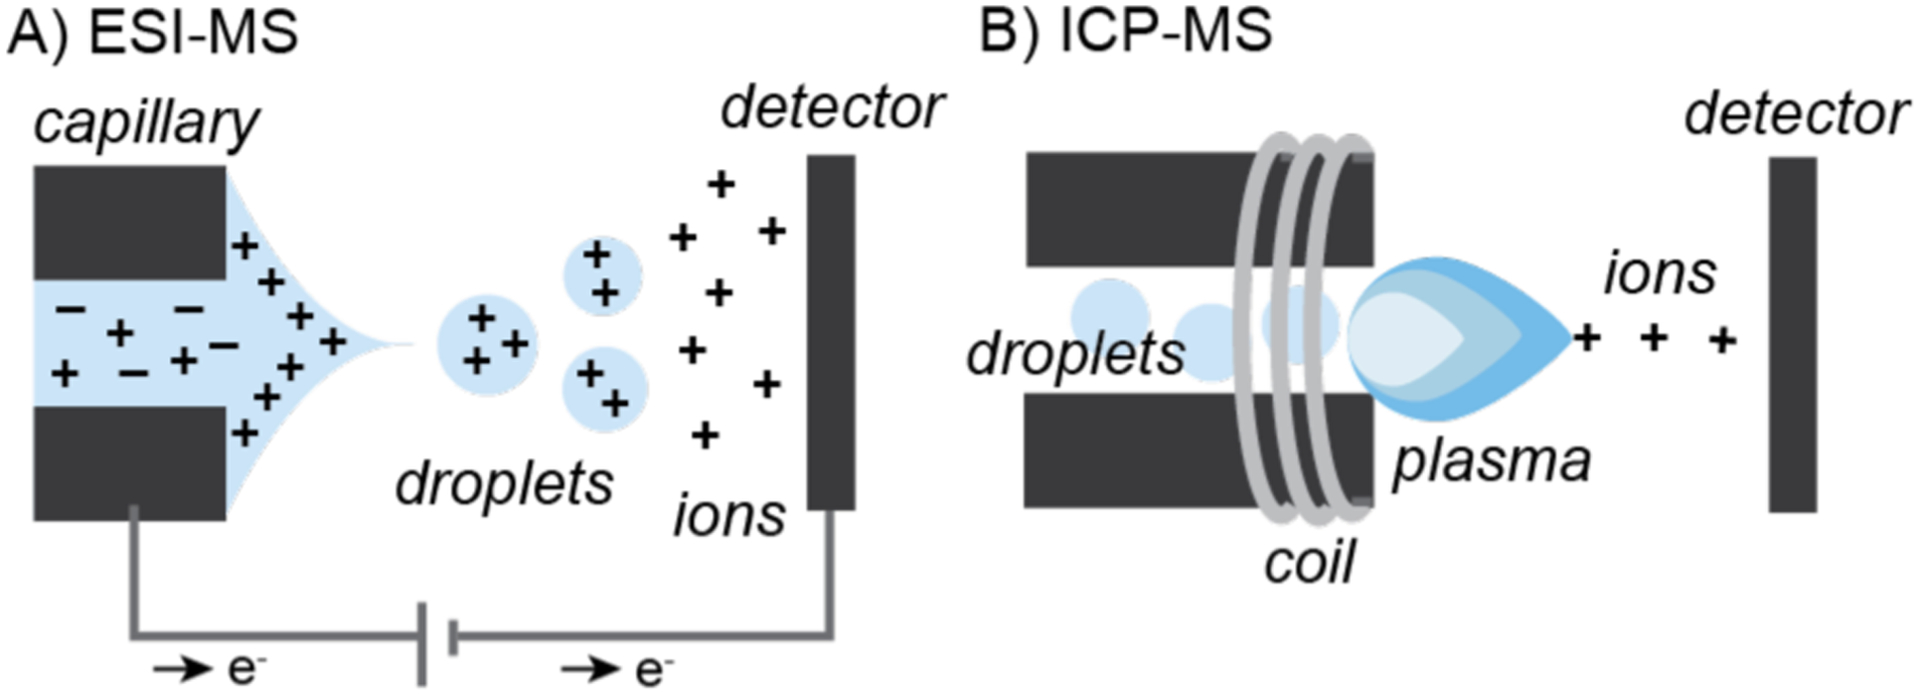
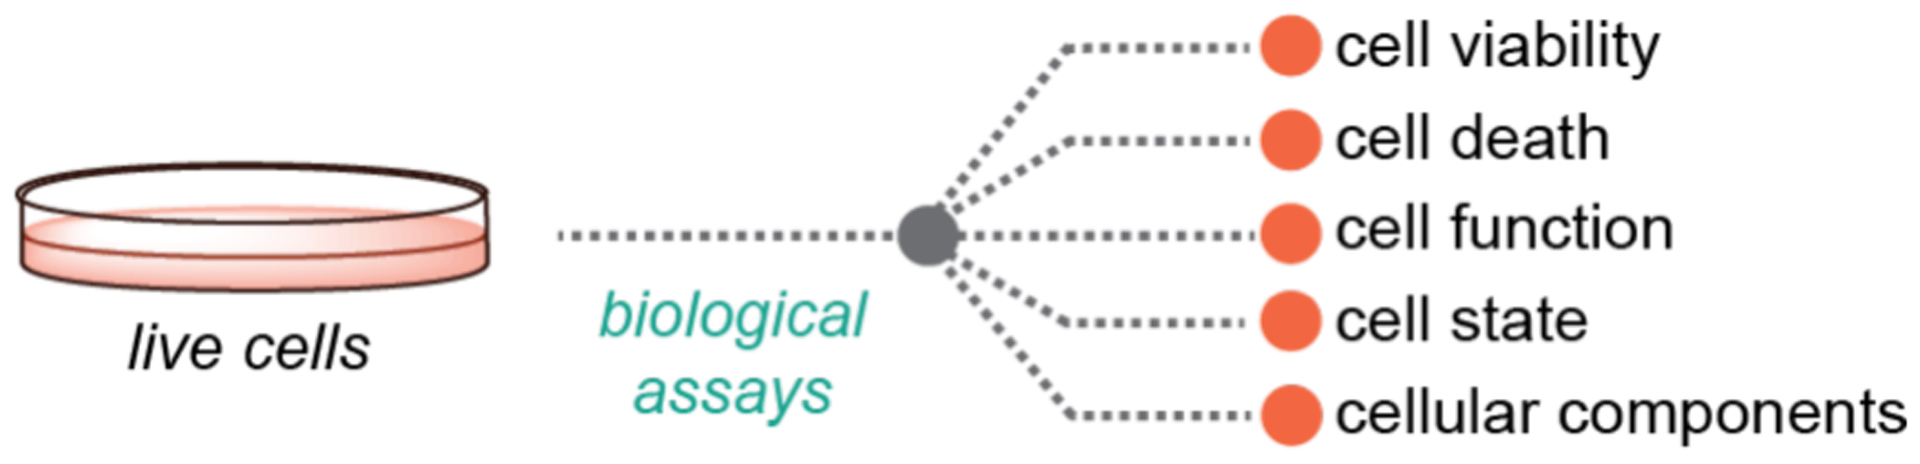
Although abiotic catalysts are capable of promoting numerous new-to-nature reactions, only a small subset has so far been successfully integrated into living systems. Research in intracellular catalysis requires an interdisciplinary approach that takes advantage of both chemical and biological tools as well as state-of-the-art instrumentations. In this perspective, we will focus on the techniques that have made studying metal-catalyzed reactions in cells possible using representative examples from the literature. Although the lack of quantitative data in vitro and in vivo has somewhat limited progress in the catalyst development process, recent advances in characterization methods should help overcome some of these deficiencies. Given its tremendous potential, we believe that intracellular catalysis will play a more prominent role in the development of future biotechnologies and therapeutics.

Keywords: bioassays; biocompatible; bioorthogonal; flow cytometry; intracellular; mass spectrometry; microscopy.


Conflict of interest statement

The authors declare no competing financial interest.

Figures

Scheme 1.
Scheme 1.
Synthetic metal-catalyzed reactions performed inside living cells and organisms. The teal and orange circles represent different organic substituents. [M] = synthetic metal catalyst, X = halide, Y = O or N.
Scheme 2.
Scheme 2.
Typical workflow for the discovery and evaluation of biocompatible metal catalysts. SAR = structure-activity relationship.
Scheme 3.
Scheme 3.
Strategies employed to study metal-catalyzed reactions in living systems by fluorescent microscopy: A) fluorescence labeling; and B) generation of fluorescent product. M = synthetic metal catalyst.
Scheme 4.
Scheme 4.
Studies by Tirrell and coworkers demonstrating the use of copper catalysts to promote azide-alkyne cycloaddition in E. coli. The fluorescence microscope images show cells containing barstar with Hpg (A) or Eth (B) after treatment with CuBr and 3-azido-7-hydroxycoumarin. Cells were treated with substrate and catalyst for 14–15 h and then washed prior to imaging. Microscope images adapted with permission from ref . Copyright 2005 American Chemical Society.
Scheme 5.
Scheme 5.
Studies by Meggers and coworkers demonstrating the use of ruthenium catalysts to promote allyl carbamate cleavage in HeLa cells. The confocal fluorescence microscope images show the formation of increasing amounts of rhodamine 110 (2) after reaction of 1 with Ru1 and PhSH. Cells were treated with substrate for 30 min, washed, and then treated with catalyst and thiophenol prior to imaging. Red = membrane dye, green = 2. Microscope images adapted with permission from ref . Copyright 2006 John Wiley and Sons.
Scheme 6.
Scheme 6.
Studies by Shin, Ahn, and coworkers demonstrating the use of palladium salt to promote propargyl ether cleavage in zebrafish. The widefield fluorescence microscope images (right) show five-day old zebrafish incubated with 4 and different concentrations of PdCl2 (0–20 μM). The zebrafish were treated with substrate for 30 min, washed, and then treated with catalyst for 30 min prior to imaging. Microscope images adapted with permission from ref . Copyright 2010 The Royal Society of Chemistry.
Scheme 7.
Scheme 7.
Studies by Bradley and coworkers demonstrating the use of palladium nanoparticles to promote C–C bond cross coupling in HeLa cells. The fluorescence microscope image (bottom right) obtained from merging the red (mitochondrial stain MitoTracker Deep Red), blue (nuclear stain Hoechst 33342), and green (compound 7) channels in fixed cells; orange indicates co-localization between the mitochondrial stain and 7. Cells were treated with catalyst for 24 h, washed, treated with substrates for 48 h, washed, and then fixed with paraformaldehyde for 30 min prior to imaging. Pd1 = palladium(0) nanoparticles prepared from amino-functionalized polystyrene, Pd(OAc)2, and hydrazine. Microscope image adapted with permission from ref . Copyright 2011 Springer Nature.
Scheme 8.
Scheme 8.
Studies by Do and coworkers demonstrating the use of organometallic iridium catalysts to promote transfer hydrogenation in NIH-3T3 cells. The plot shows change in integrated fluorescence from confocal images of cells after different treatments, relative to that observed from treatment with only aldehyde 8. Cells were treated with substrate for 4 h, washed, and then treated with catalyst (and pyruvate in one treatment group) for 2 h prior to imaging.
Scheme 9.
Scheme 9.
Studies by Tirrell and coworkers demonstrating the use of copper catalysts to promote azide-alkyne cycloaddition on E. coli cell surfaces. The plots show flow cytometry data from: A) mutant cells containing OmpC-met; B) wild-type cells containing OmpC-azide; C) mutant cells containing OmpC-azide; and D) a mix population of mutant cells containing OmpC-azide and cells containing OmpC(–) (without added Met). Cu2 = CuSO4/tripodal ligand. Flow cytograms adapted with permission from ref . Copyright 2003 American Chemical Society.
Scheme 10.
Scheme 10.
Flow cytograms obtained from studies of mutant E. coli containing either OmpC(−) or OmpC-azide after reaction with 11 using either CuSO4/TCEP (A) or CuBr (B) as the copper source. The cells were stained using avidin Alexa Fluor 488. Flow cytograms adapted with permission from ref . Copyright 2004 American Chemical Society.
Scheme 11.
Scheme 11.
Studies by Bradley and coworkers demonstrating the use of copper nanoparticles to promote azide-alkyne cycloaddition in SKOV-3 cells. The plots show flow cytometry data from: A) cell proliferation assays (cell cycle profiles) and B) apoptosis assays. PI = propidium iodide. Cu3 = copper(0) nanoparticles prepared from amino-functionalized resin, Cu(OAc)2, and hydrazine. Flow cytograms adapted with permission from ref . Copyright 2016 John Wiley and Sons.
Scheme 12.
Scheme 12.
Studies by Bradley and coworkers demonstrating the use of palladium catalysts to promote propargyl carbamate cleavage in PC-3 cells. The plots show flow cytometry data from: A) untreated cells; B) cells treated with 15; and C) cells treated with 15 and Pd2. Cy5 = sulfonated cyanine fluorescent dye. Flow cytograms adapted with permission from ref . Copyright 2017 The Royal Society of Chemistry.
Scheme 13.
Scheme 13.
Studies by Chen and coworkers demonstrating the use of palladium catalysts to promote propargyl-carbamate cleavage in HeLa cells. The data are shown for A) distribution of Pd in different cell fractions measured by ICP-MS and B) characterization of the GFPY40-Lys protein measured by LC-MS/MS. The MS data were adapted with permission from ref . Copyright 2014 Springer Nature.
Scheme 14.
Scheme 14.
Studies by Chen and coworkers demonstrating the use of palladium catalysts to promote propargyl-carbamate cleavage in CHO cells. The selected ion recording obtained from LC-MS showing the decrease of 17 (A) and increase of 18 (B). Pd3 = palladium(0) nanoparticles prepared from Na2PdCl4 and NaBH4. The MS data were adapted with permission from ref . Copyright 2015 John Wiley and Sons.
Scheme 15.
Scheme 15.
Studies by Mascareñas and coworkers demonstrating the use of ruthenium catalysts to promote allyl-carbamate cleavage in HeLa cells. The ICP-MS data showing the amounts of ruthenium found in the mitochondria and cytosol from cells treated with different catalysts are provided in the bottom table.
Scheme 16.
Scheme 16.
Studies by Cai and coworkers demonstrating the use of copper catalysts to promote azide-alkyne cycloaddition in OVCAR5 cells. The reaction efficiency was determined using LC-MS/MS by quantifying the amount of 20, the triazole product fragment generated via acid hydrolysis. Cu4 = copper(II) complex prepared from a tripodal ligand-peptide conjugate and CuSO4.
Scheme 17.
Scheme 17.
Studies by Mascareñas and coworkers demonstrating the use of ruthenium catalysts to promote allyl alcohol isomerization in HeLa cells. Analysis by LC-MS showed that product 22 increased over time (A). Quantification of 22 and ruthenium concentration in cells allowed determination of turnover number (B). Plots adapted with permission from ref . Copyright 2019 American Chemical Society.
Scheme 18.
Scheme 18.
Studies by Sadler and coworkers demonstrating the use of ruthenium catalysts to promote transfer hydrogenation in A2780 cells. An SRB cell viability assay was used to measure IC50 (A) and an NAD+/NADH assay was used to measure redox balance (B). Data were adapted with permission from ref . Copyright 2015 Springer Nature.
Scheme 19.
Scheme 19.
Studies by Sadler and coworkers demonstrating the use of osmium catalysts to promote transfer hydrogenation in A2780 cells. An SRB cell viability assay was used to measure IC50 of S,S-Os1 (A) and a D-lactate assay was used to measure the intracellular concentration of D-lactate (B). Data were adapted with permission from ref . Copyright 2018 Springer Nature.
Scheme 20.
Scheme 20.
Studies by Balskus and coworkers demonstrating the use of ruthenium catalysts to promote allyl-carbamate cleavage in E. coli mutant cells. Image of bacterial cultures (A) and growth curves based on optical density measurements (B). Data were adapted with permission from ref . Copyright 2013 John Wiley and Sons.
Chart 1.
Chart 1.
Simplified schematic of widefield (A) and confocal (B) fluorescence microscopy.
Chart 2.
Chart 2.
Simplified schematic of typical fluorescence flow cytometers. Abbreviations: fsc = forward scatter, ssc = side scatter.
Chart 3.
Chart 3.
Simplified schematics of A) electrospray-ionization (ESI) and B) inductively-coupled plasma (ICP) mass spectrometry (MS).
Chart 4.
Chart 4.
Examples of biological assays available to study metal-catalyzed reactions in cells.

Similar articles

Cited by

References

    1. Oparin AI The Origin of Life and the Origin of Enzymes. Adv. Enzymol. Relat. Areas Mol. Biol 1965, 347–380. - PubMed
    1. Schopf JW; Kudryavtsev AB; Czaja AD; Tripathi AB Evidence of Archean Life: Stromatolites and Microfossils. Precambrian Res. 2007, 158, 141–155.
    1. Djokic T; Van Kranendonk MJ; Campbell KA; Walter MR; Ward CR Earliest Signs of Life on Land Preserved in ca. 3.5 Ga Hot Spring Deposits. Nat. Commun 2017, 8, 15263. - PMC - PubMed
    1. Robertson AJB The Early History of Catalysis. Platin. Met. Rev 1975, 19, 64–69.
    1. Hartwig JF Organotransition Metal Chemistry; University Science Books: Mill Valley, California, 2010.