. 2021 Oct 30;24(12):103396.
doi: 10.1016/j.isci.2021.103396. eCollection 2021 Dec 17.

Proteostasis regulated by testis-specific ribosomal protein RPL39L maintains mouse spermatogenesis

Affiliations

Proteostasis regulated by testis-specific ribosomal protein RPL39L maintains mouse spermatogenesis

Qianxing Zou et al. iScience. .

Abstract

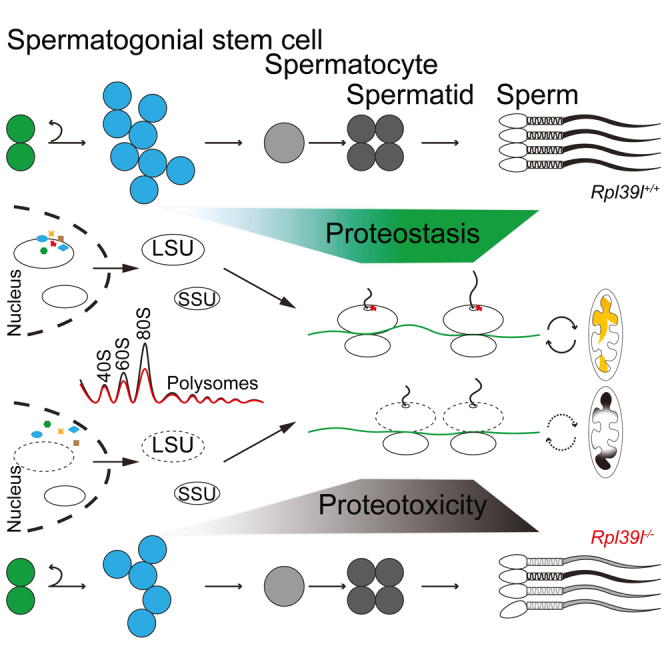
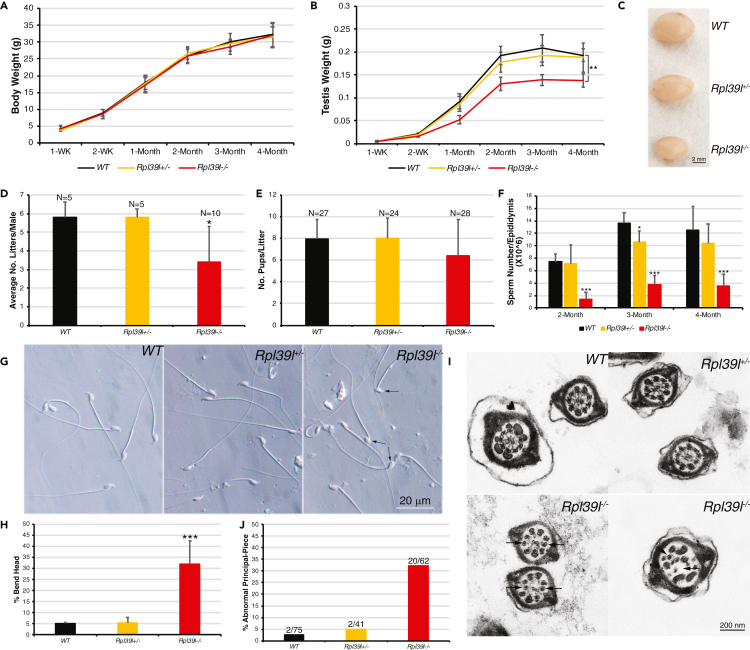
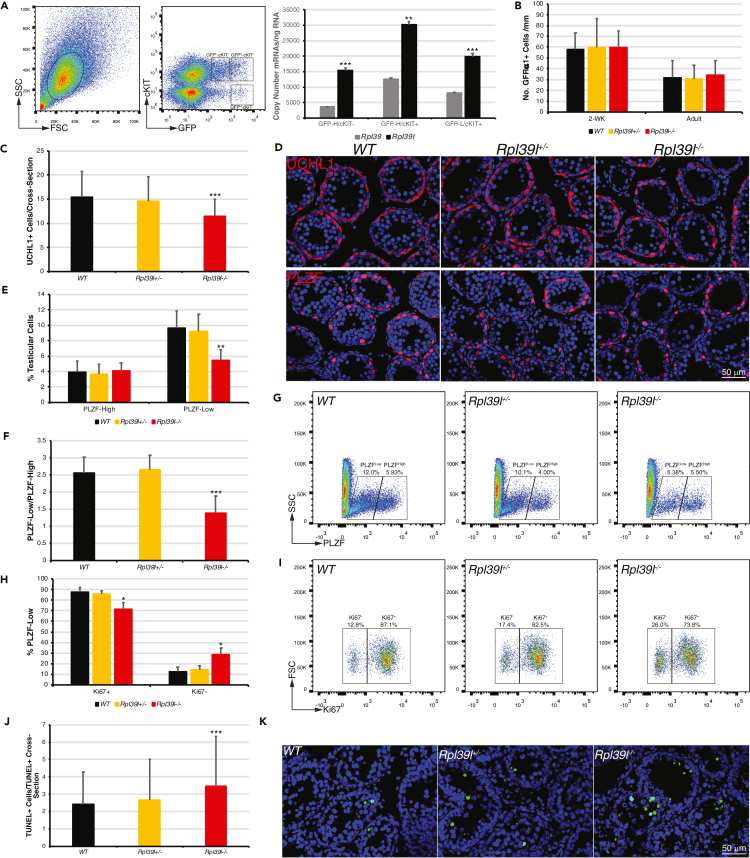
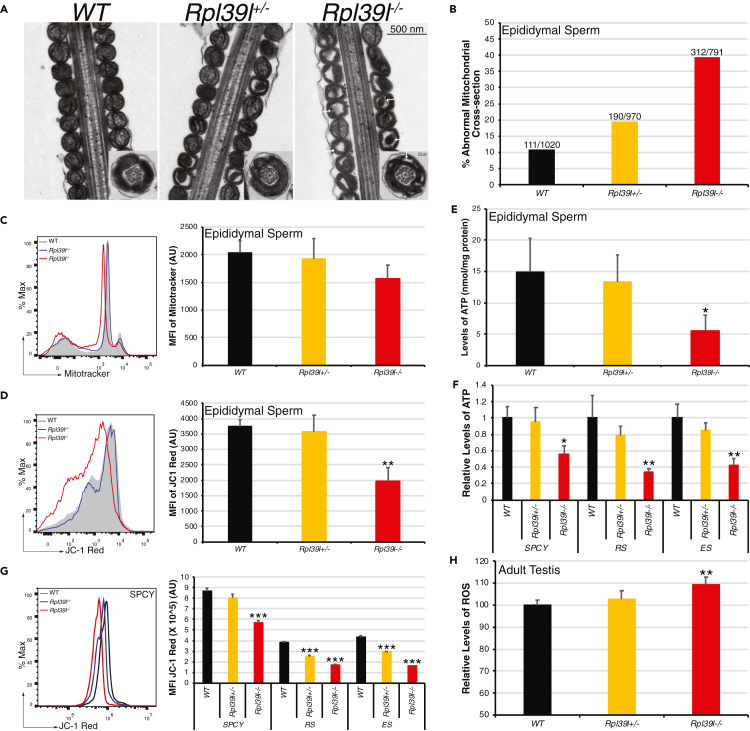
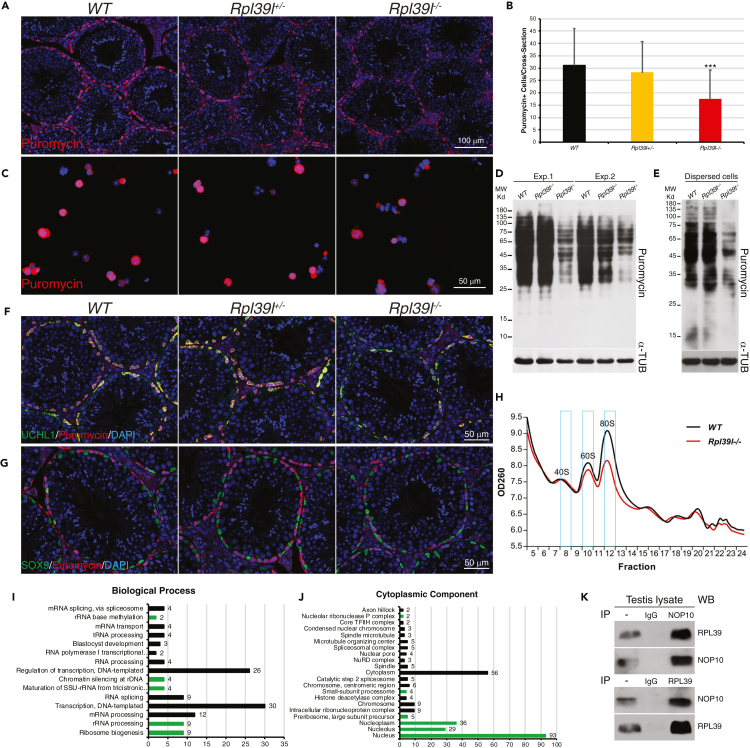
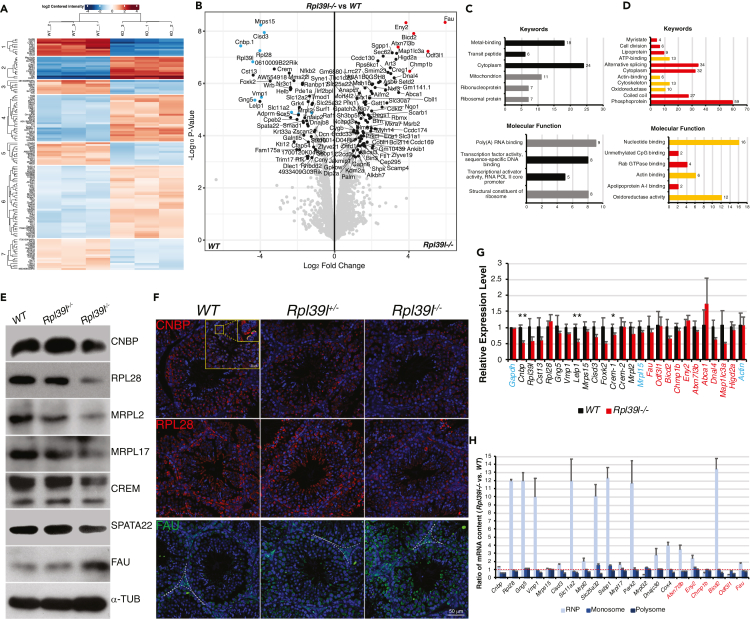
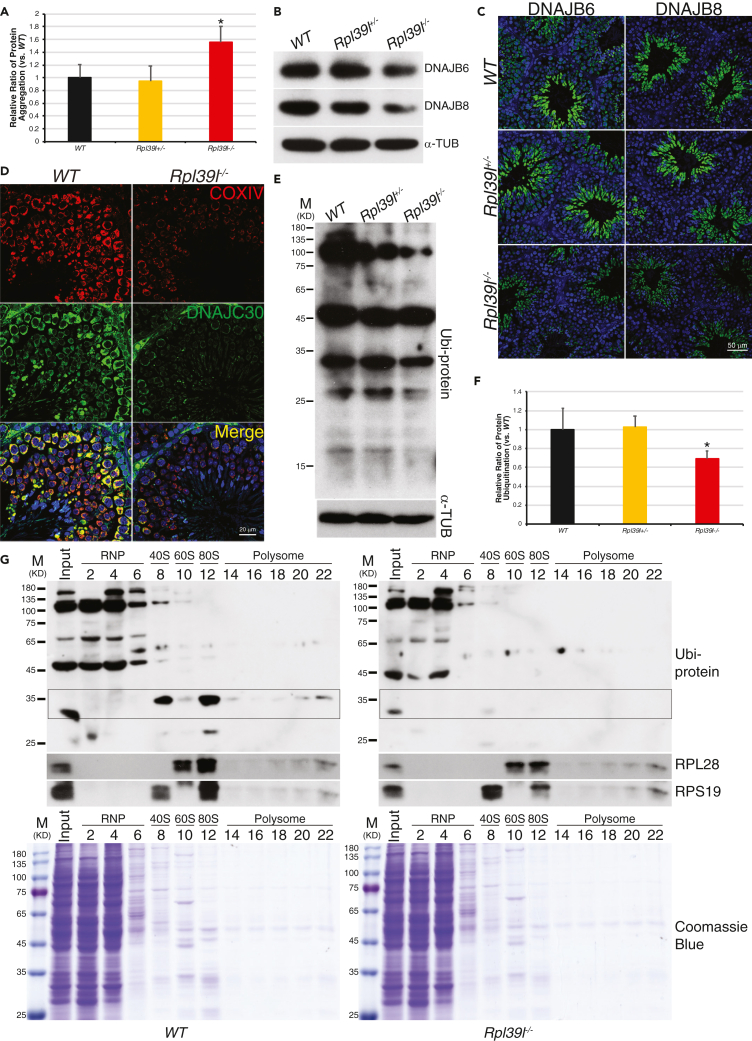
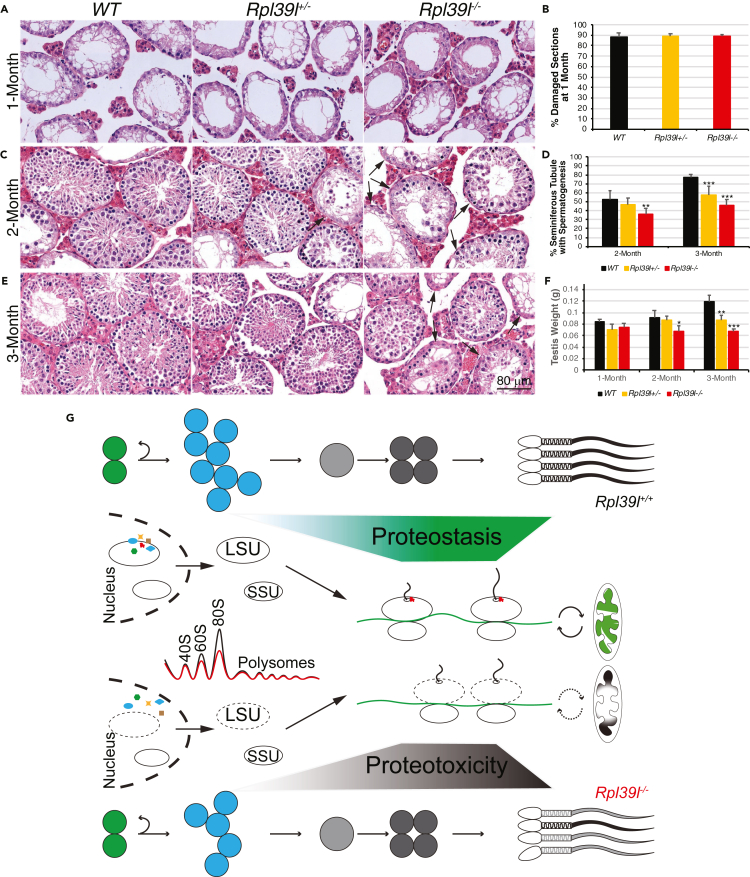
Maintaining proteostasis is important for animal development. How proteostasis influences spermatogenesis that generates male gametes, spermatozoa, is not clear. We show that testis-specific paralog of ribosomal large subunit protein RPL39, RPL39L, is required for mouse spermatogenesis. Deletion of Rpl39l in mouse caused reduced proliferation of spermatogonial stem cells, malformed sperm mitochondria and flagella, leading to sub-fertility in males. Biochemical analyses revealed that lack of RPL39L deteriorated protein synthesis and protein quality control in spermatogenic cells, partly due to reduced biogenesis of ribosomal subunits and ribosome homeostasis. RPL39/RPL39L is likely assembled into ribosomes via H/ACA domain containing NOP10 complex early in ribosome biogenesis pathway. Furthermore, Rpl39l null mice exhibited compromised regenerative spermatogenesis after chemical insult and early degenerative spermatogenesis in aging mice. These data demonstrate that maintaining proteostasis is important for spermatogenesis, of which ribosome homeostasis maintained by ribosomal proteins coordinates translation machinery to the regulation of cellular growth.

Keywords: Developmental biology; Male reproductive endocrinology; Molecular biology.


Conflict of interest statement

The authors declare no competing interests.

Figures

None
Graphical abstract
Figure 1
Figure 1
Deletion of Rpl39l causes sub-fertility in male mice (A) Body weights of post-natal male mice. N ≥ 5 mice at each time point. (B) Testis weights of post-natal male mice. N ≥ 5 mice at each time point. (C) Images of testes from mice with different genotypes. Scale bar: 2 mm. (D) Average number of litters produced by male mice with different genotypes. (E) Average number of pups per litter. (F) Average numbers of sperm retrieved from cauda epididymis. N ≥ 5 mice. (G) Images of epididymal sperm. Arrows indicate bend heads of Rpl39l null sperm. Scale bar: 20 μm. (H) Percent of sperm with bend heads in total sperm counted from images as in (G). N = 3 experimental repeats. (I) TEM images of sperm tail cross-sections. Arrows indicate missing or dis-oriented ODF and axoneme of Rpl39l null sperm. Scale bar: 200 nm. (J) Percent of abnormal principal-piece cross-sections. Numbers of cross-sections containing malformed ODF and axoneme were counted from TEM images as shown in (I). One-way ANOVA Tukey’s test, ∗p < 0.05, ∗∗p < 0.01, ∗∗∗p < 0.001.
Figure 2
Figure 2
Reduced proliferation of spermatogonial stem cells (SSCs) caused by Rpl39l deletion (A) SSCs from 2-week-old OG2 mice were sorted from intact cells (left panel, circled) using GFP expression and cKIT immunostaining (middle panel). Copy numbers of Rpl39l and Rpl39 transcripts were compared using quantitative RT-PCR (right panel). N = 3 experimental repeats, paired-sample Student’s t-test, ∗∗p < 0.01, ∗∗∗p < 0.001. (B) GFRα1+ SSCs per unit length of seminiferous tubules in 2-week-old and adult mice. N ≥ 40 1-mm long seminiferous tubules. (C) UCHL1+ spermatogonia per cross-section of 2-week-old mouse testes. N ≥ 183. (D) Confocal images of testis sections of 2-week-old mice immunostained for UCHL1 (upper panels) or PLZF (lower panels). Scale bar: 50 μm. (E) Percent of PLZFHigh and PLZFLow SSCs in total testicular cells from 2-week-old mice. N ≥ 7 testes. (F) Ratio of PLZFLow to PLZFHigh SSCs in 2-week-old mice. N ≥ 7 testes. (G) FACS for PLZF+ SSCs from 2-week-old mice. (H) Percent of Ki67-labeled PLZFLow SSCs from 2-week-old mice. N ≥ 3 testes. (I) FACS for Ki67-labeled PLZFLow SSCs from 2-week-old mice. (J) TUNEL+ cells per cross-section containing TUNEL+ cells. N ≥ 203. (K) Confocal images of TUNEL assays on mouse testis sections. Scale bar: 50 μm. One-way ANOVA Tukey’s test, ∗p < 0.05, ∗∗p < 0.01, ∗∗∗p < 0.001.
Figure 3
Figure 3
Rpl39l deletion compromises structure and functions of sperm mitochondria (A) TEM images of mid-piece longitudinal sections of sperm tail. Arrows indicate mitochondria with hollowed matrix and cristae condensates. Insets: cross-sections of sperm mitochondria. Scale bar: 500 nm. (B) Percent of abnormal mitochondrial cross-sections in the mid-piece of sperm tail. Numbers indicate cross-sections containing disorganized matrices in total mitochondrial cross-sections counted from TEM images as shown in (A). (C) Flow cytometry (left) and the average intensity of MitoTracker Red signals (right) from stained epididymal sperm. N ≥ 3 testes. (D) Flow cytometry (left) and the average intensity of JC-1 Red signals (right) in epididymal sperm stained with JC-1. N ≥ 3 testes. (E) Cellular ATP of epididymal sperm. N = 5 cauda epididymides. (F) Relative contents of cellular ATP in spermatogenic cells separated by BSA gravity sedimentation, using wild type cells as the control. N = 3 mice. (G) Flow cytometry (left, only spermatocytes shown) and the average intensity of JC-1 (right) in spermatogenic cells. N = 3 testes. In (F) and (G), SPCY: spermatocytes, RS: round spermatids, ES: elongating spermatids. In (C), (D) and (G), MFI: mean fluorescence intensity, AU: arbitrary unit. (H) Relative levels of ROS in adult testes. N ≥ 4 mice. One-way ANOVA Tukey's test, ∗p < 0.05, ∗∗p < 0.01, ∗∗∗p < 0.001.
Figure 4
Figure 4
Decreased protein synthesis and ribosome large subunits in the absence of RPL39L (A) Confocal images of testis cross-sections immunostained with anti-puromycin following in vivo labeling. Scale bar: 100 μm. (B) Puromycin+ cells per cross-section as shown in (A) N ≥ 41, One-way ANOVA Tukey’s test, ∗∗∗p < 0.001. (C) Confocal images of dispersed testicular cells immunostained with anti-puromycin following in vitro labeling. Scale bar: 50 μm. (D) Western blotting of testis lysates following in vivo puromycin labeling. Shown are two experimental repeats. (E) Western blotting of testicular cell lysates following in vitro puromycin labeling. α-TUBULIN was used as loading control in (D) and (E). (F and G) Confocal images of testis sections immunostained with anti-puromycin and anti-UCHL1 (F) or anti-SOX9 (G) following in vivo puromycin labeling. Cell nuclei were stained with DAPI. Scale bars: 50 μm. (H) Sucrose gradient sedimentation of testis lysates. Peaks of 40S SSU, 60S LSU and 80S monosomes are indicated with blue boxes. (I and J) GO analyses of proteins pulled-down by both GST-RPL39 and GST-RPL39L. GO groups relevant to ribosome biogenesis are indicated in green. (K) Co-immunoprecipitation of testis lysates with pan-anti-RPL39 or anti-NOP10. NOP10 is common to both GST-RPL39 and GST-RPL39L pull-downs.
Figure 5
Figure 5
Differentially expressed spermatogenic proteome caused by Rpl39l deletion (A) Heatmap of differentially expressed proteins (DEPs) between wild type and Rpl39l–/– testes. Shown are three experimental repeats. DEPs are clustered into seven clusters according to their similarities in changes. Red: upregulated DEPs, Blue: downregulated DEPs. (B) Volcano plot of DEPs between wild type and Rpl39l–/– testes. Blue and red indicate top DEPs down- or up-regulated in Rpl39l–/– testes, respectively. (C and D) GO analyses of DEPs. Down-regulated GO groups relevant to ribosomes and mitochondria are shown in grey (C). Up-regulated GO groups relevant to metabolism and cytoskeleton are shown in yellow (D). (E) Western blotting of testis lysates for selected top DEPs. α-TUBULIN was used as loading control. (F) Immunostaining of testis sections. Insets show ER and acrosomal localizations of CNBP in spermatocytes and elongating spermatids from a different cross-section. Green: PNA. Blue: DAPI. Scale bar: 50 μm. Scale bar in inset: 20 μm. (G) Quantitative RT-PCR of genes encoding DEPs. Gapdh, Actin and Mrpl15 were used as controls. N = 3 testes, paired-sample Student’s t-test, ∗p < 0.05, ∗∗p < 0.01. (H) Changes of mRNA distributions. RNAs were extracted from sucrose gradient fractions representing RNPs, monosomes and polysomes and relative mRNAs in each fraction were compared using quantitative RT-PCR. Most mRNAs were found to accumulate in RNPs in Rpl39l–/– testes as indicated by the ratio above 1 (red dotted line). Genes encoding decreased (black) or increased (red) DEPs are indicated in G and (H)
Figure 6
Figure 6
Aberrant protein quality control in spermatogenic cells lacking RPL39L (A) Increased protein aggregations in Rpl39l–/– testis. N = 3 testes, One-way ANOVA Tukey’s test, ∗p < 0.05. (B) Western blotting of testis lysates. α-TUBULIN was used as loading control. (C) Immunostaining of testis sections. Scale bar: 50 μm. (D) Immunostaining of testis sections. DNAJC30 co-localizes with mitochondrial COXIV and both were decreased in Rpl39l–/– testes. Scale bar: 50 μm. (E) Western blotting of testis lysates. α-TUBULIN was used as loading control. (F) Quantitation of protein ubiquitination measured from Western blotting as shown in (E). N = 5 experimental repeats, One-way ANOVA Tukey’s test, ∗p < 0.05. (G) Western blotting of sucrose gradient fractions. Decreased protein ubiquitination was found in ribosome subunits, monosomes and polysomes, especially in boxed area. Coomassie blue staining of the same samples are shown below.
Figure 7
Figure 7
Reduced regenerative spermatogenesis in Rpl39l null testes (A) Hematoxylin/Eosin (H/E) staining of testis sections at 1-month post-busulfan injection. (B) Percent of cross-sections containing mainly empty lumens at 1-month post-busulfan injection. N = 6 testes. (C) H/E staining of testis sections at 2 months after busulfan injection. Arrows indicate damaged seminiferous tubules. (D) Percent of seminiferous tubules containing developing spermatogenic cells after 2 and 3 months after busulfan injection. N = 6 testes. (E) H/E staining of testis sections at 3 months after busulfan injection. Arrows indicate damaged seminiferous tubules. (F) Testis weight measurements at different times after busulfan injection. N = 3 testes. One-way ANOVA Tukey’s test, ∗p < 0.05, ∗∗p < 0.01, ∗∗∗p < 0.001. (G) Proposed model of proteostasis regulated by RPL39L maintains normal spermatogenesis, in which Rpl39l deletion may interrupt biogenesis of ribosome subunits, leading to reduced protein synthesis and aberrant protein quality control. The poor quality of proteins synthesized may introduce proteotoxicity and compromise normal spermatogenesis, including decreased SSC proliferation and abnormal spermiogenesis, thus producing sperm with poor qualities of morphology and motility.

Similar articles

Cited by

References

    1. Albert B., Kos-Braun I.C., Henras A.K., Dez C., Rueda M.P., Zhang X., Gadal O., Kos M., Shore D. A ribosome assembly stress response regulates transcription to maintain proteome homeostasis. Elife. 2019;8:e45002. - PMC - PubMed
    1. An H., Harper J.W. Ribosome abundance control via the ubiquitin-proteasome system and autophagy. J. Mol. Biol. 2020;432:170–184. - PMC - PubMed
    1. Badertscher L., Wild T., Montellese C., Alexander L.T., Bammert L., Sarazova M., Stebler M., Csucs G., Mayer T.U., Zamboni N., et al. Genome-wide RNAi screening identifies protein modules required for 40s subunit synthesis in human cells. Cell. Rep. 2015;13:2879–2891. - PubMed
    1. Balch W.E., Morimoto R.I., Dillin A., Kelly J.W. Adapting proteostasis for disease intervention. Science. 2008;319:916–919. - PubMed
    1. Balchin D., Hayer-Hartl M., Hartl F.U. In vivo aspects of protein folding and quality control. Science. 2016;353:aac4354. - PubMed