

Microglial PD-1 stimulation by astrocytic PD-L1 suppresses neuroinflammation and Alzheimer's disease pathology
- PMID: 34825707
- PMCID: PMC8672180
- DOI: 10.15252/embj.2021108662
Microglial PD-1 stimulation by astrocytic PD-L1 suppresses neuroinflammation and Alzheimer's disease pathology
Abstract
Chronic neuroinflammation is a pathogenic component of Alzheimer's disease (AD) that may limit the ability of the brain to clear amyloid deposits and cellular debris. Tight control of the immune system is therefore key to sustain the ability of the brain to repair itself during homeostasis and disease. The immune-cell checkpoint receptor/ligand pair PD-1/PD-L1, known for their inhibitory immune function, is expressed also in the brain. Here, we report upregulated expression of PD-L1 and PD-1 in astrocytes and microglia, respectively, surrounding amyloid plaques in AD patients and in the APP/PS1 AD mouse model. We observed juxtamembrane shedding of PD-L1 from astrocytes, which may mediate ectodomain signaling to PD-1-expressing microglia. Deletion of microglial PD-1 evoked an inflammatory response and compromised amyloid-β peptide (Aβ) uptake. APP/PS1 mice deficient for PD-1 exhibited increased deposition of Aβ, reduced microglial Aβ uptake, and decreased expression of the Aβ receptor CD36 on microglia. Therefore, ineffective immune regulation by the PD-1/PD-L1 axis contributes to Aβ plaque deposition during chronic neuroinflammation in AD.
Keywords: APP; PD-1 knockout mice; PS1 mice; innate immune system; microglia.
© 2021 The Authors. Published under the terms of the CC BY NC ND 4.0 license.
Conflict of interest statement
MTH is a clinical advisory board member at IFM Therapeutics, scientific advisory board member at Alector, and associate editor of Neurology and Neuroinflammation, and received honoraria for oral presentations from Pfizer, Novartis, Roche, AbbVie, and Biogen. All other authors declare that they have no conflict of interest.
Figures
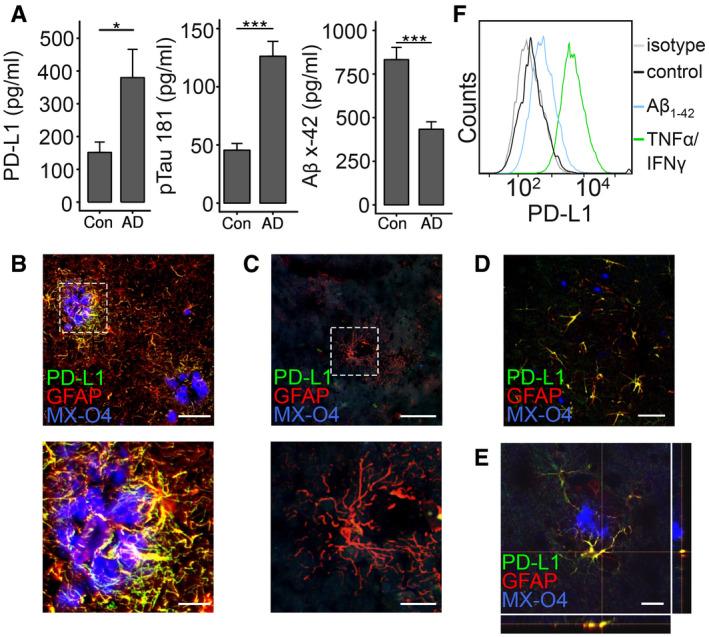
- A
ELISA quantification of PD‐L1, pTau 181, and Aβx‐42 in the CSF of control and AD patients (n = 10 ± SEM, Student's t‐test, *P < 0.05 and ***P < 0.001, PD‐L1: t = 2.47 df = 18, Aβx‐42: t = 4.83 df = 18, pTau 181: t = 5,768 df = 18).
- B, C
(B) Colocalization of PD‐L1 and GFAP in AD and (C) in control patients (MX‐O4 = amyloid deposits, upper picture: bar = 100 µm, lower picture: bar = 30 µm).
- D
Immunohistochemical detection of PD‐L1 and GFAP in 9‐month‐old female APP/PS1 mice (bar = 50 µm).
- E
Immunohistochemical detection of PD‐L1 and GFAP in 4‐month‐old female APP/PS1 mice (bar = 20 µm).
- F
Induction of PD‐L1 on astrocytes using 1 μM aggregated Aβ1‐42 or 10 μg/ml TNF‐α/100 U/μl IFN‐γ analyzed by flow cytometry.
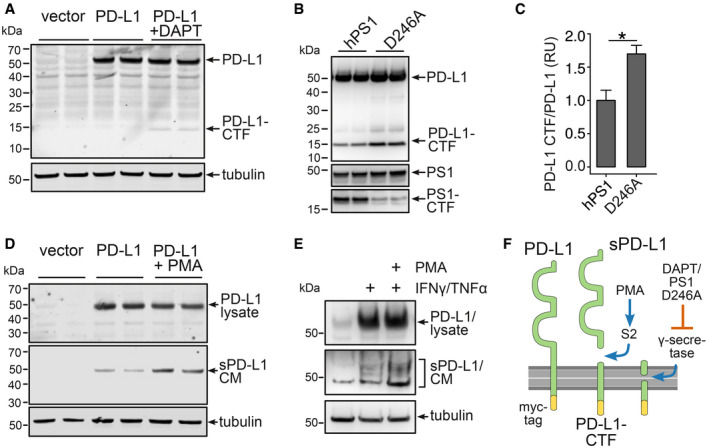
C6 cells expressing PD‐L1‐myc treated with the γ‐secretase inhibitor DAPT for 18 h. PD‐L1 was detected using a myc antibody.
Immunoblot of HEK293 cells expressing PD‐L1‐myc and presenilin 1 (hPS1) or a presenilin 1 dominant negative mutant (hPS1 D246A).
Evaluation of three independent experiments of B (n = 3, mean + SEM, Student's t‐test, *P = 0.012, t = 3.4803, df = 4).
18 h 1 μM PMA treatment of C6 cells expressing PD‐L1‐myc. Secretion of PD‐L1 in the conditioned medium (CM) was detected using antibody AF1019.
Mouse astrocytes were incubated for 48 h with 1 μM PMA and 10 μg/ml TNF‐α/100 U/μl IFN‐γ. Lysates and the CM were immunoblotted using antibody AF1019.
Scheme of PD‐L1 secretion: PMA‐induced S2 cleavage results in the formation of sPD‐L1 and a C‐terminal fragment (PD‐L1‐CTF), that is cleaved by γ‐secretase.
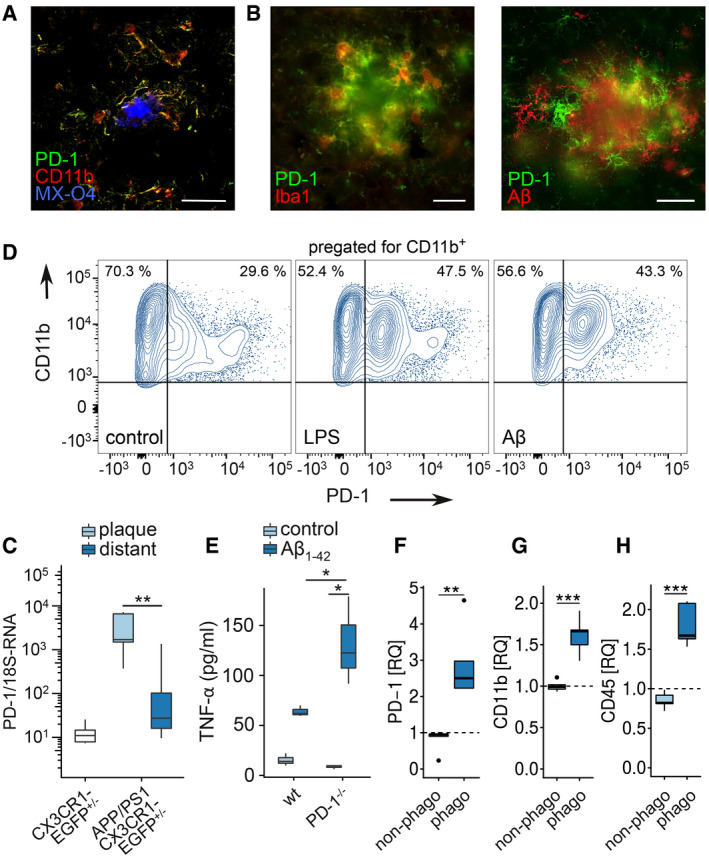
- A
Colocalization of PD‐1 and CD11b (MX‐04 = methoxy‐XO4, stains amyloid deposits) in AD by immunohistochemistry (bar = 50 µm).
- B
Colocalization of PD‐1 and Iba1 or PD‐1 and Aβ in a female APP/PS1 mouse at 9 months of age by immunohistochemistry (bar = 20 µm).
- C
PD‐1 mRNA quantification in laser‐dissected microglia from CX3CR1‐EGFP+/− mice (wt) or plaque‐associated (plaque) and plaque‐distant (distant) microglia from APP/PS1 CX3CR1‐EGFP+/− mice (n = 6, Mann–Whitney test, **P = 0.0043, W = 35).
- D
Induction of PD‐1 on CD11b+ microglia in vitro using 1 μM Aβ or 100 ng/ml LPS, analyzed by flow cytometry.
- E
ELISA analysis of TNF‐α secretion by wild‐type (wt) and PD‐1−/− microglia induced by 0.5 µM Aβ1‐42 for 6 h in vitro (n = 3 biological replicates, one‐way ANOVA (df = 1, F = 8.29, P = 0.021), Tukey's HSD, *P < 0.05).
- F–H
Microglia from methoxy‐XO4‐injected, 8‐month‐old female, wild‐type (wt), and APP/PS1 mice were analyzed (F) for PD‐1 (n = 5 biological replicates per group, one‐way ANOVA (df = 2, F = 13.99, P = 0.0013), Tukey's HSD, **P < 0.01), (G) for CD11b (n = 5 biological replicates per group, one‐way ANOVA (df = 2, F = 30.06, P = 5.47 × 10⁻⁵), Tukey's HSD, ***P < 0.001), and (H) for CD45 by flow cytometry (n = 5 biological replicates per group, one‐way ANOVA (df = 1, F = 24.96, P = 0.00013), Tukey's HSD, ***P < 0.001) and normalized to the expression of wild‐type mice (represented by dashed lines).
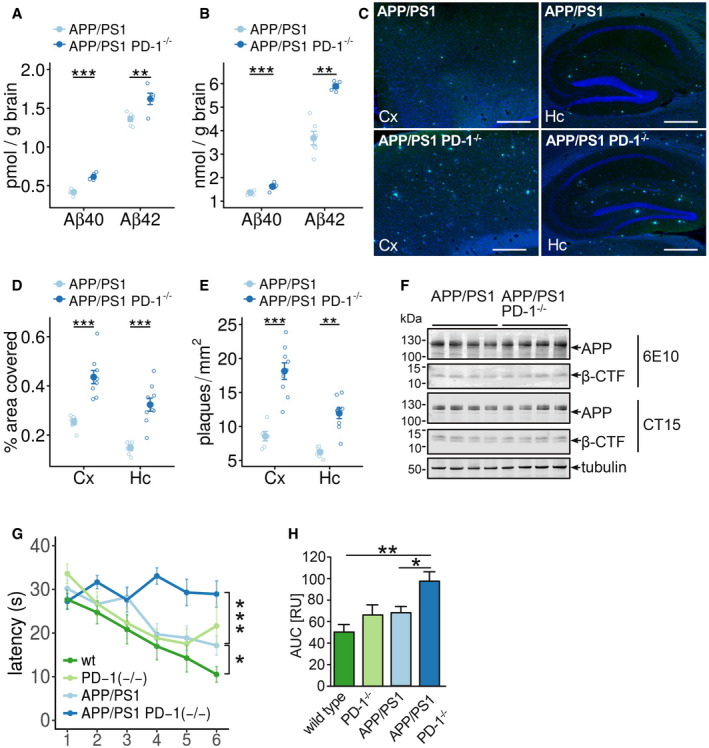
- A, B
ELISA of the (A) RIPA‐soluble fraction of female APP/PS1 and APP/PS1 PD‐1−/− mice for Aβx‐40 (biological replicates with n = 6 for APP/PS1 and n = 5 for APP/PS1 PD‐1−/−, mean ± SEM, one‐way ANOVA (df = 1, F = 0.6, P = 0.45), Tukey's HSD, **P < 0.01, ***P < 0.001) and (B) of the SDS‐soluble fraction (biological replicates with n = 6 for APP/PS1 and n = 5 for APP/PS1 PD‐1−/−, mean ± SEM, one‐way ANOVA (df = 1, F = 32.8, P = 2 × 10⁻⁵), Tukey's HSD, **P < 0.01, ***P < 0.001).
- C
Thioflavin T histochemistry from sagittal brain sections in the hippocampus (Hc), and cortex (Cx) of female APP/PS1 and APP/PS1 PD‐1−/− mice. Nuclei were stained using Hoechst 33342 (bar = 500 μm).
- D, E
Mice were analyzed for (D) percentage of the covered areas (5 sections per mouse analyzed with the mean representing an individual data point; biological replicates with n = 6 for APP/PS1 and n = 9 for APP/PS1 PD‐1−/−, mean ± SEM, one‐way ANOVA (df = 1, F = 0.905, P = 0.90), Tukey's HSD, ***P < 0.001) and (E) the number of plaques per mm2 (5 sections per mouse analyzed with the mean representing an individual data point; biological replicates with n = 6 for APP/PS1 and n = 9 for APP/PS1 PD‐1−/−, mean ± SEM, one‐way ANOVA (df = 1, F = 4.08, P = 0.054), Tukey's HSD, **P < 0.01, ***P < 0.001).
- F
Western blot analysis of brain lysates from female APP/PS1 and APP/PS1 PD‐1−/− mice for the expression of APP and APP C‐terminal fragments using antibodies 6E10 (transgene expression) and CT15 (transgene and endogenous expression). Tubulin was used as a loading control.
- G
Time needed to reach the hidden platform (latency in seconds) in the Morris water maze test (mean ± SEM of biological replicates with n = 12 for wt, n = 5 for PD‐1−/−, n = 7 for APP/PS1, and n = 8 for APP/PS1 PD‐1−/−, one‐way ANOVA (df = 3, F = 17.72, P = 1 × 10⁻⁹), Tukey's HSD, *P < 0.05, ***P < 0.001).
- H
Analysis of the area under the curve (mean + SEM of biological replicates with n = 12 for wt, n = 5 for PD‐1−/−, n = 12 for APP/PS1, and n = 8 for APP/PS1 PD‐1−/−, ANOVA (df = 3, F = 6.98, P = 0.001), *P < 0.05 and **P < 0.01).
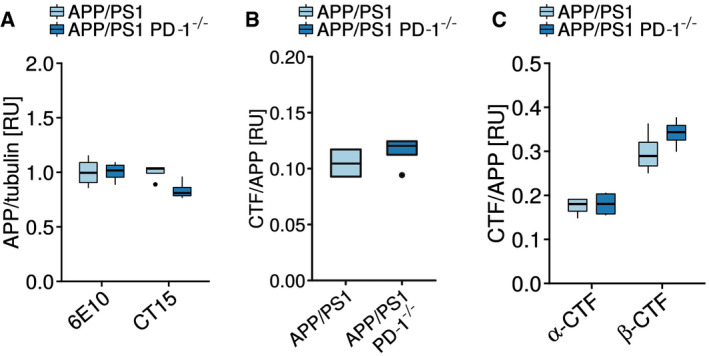
Quantification of the APP expression normalized to tubulin shown in Fig 4F (biological replicates with n = 4 mice per group, one‐way ANOVA (df = 1, F = 2.776, P = 0.122), Tukey’s post hoc test).
Quantification of the 6E10 Western blot and the calculation of the APP C‐terminal fragment (CTF)‐to‐APP ratio shown in Fig 4F (biological replicates with n = 4 mice per group, Student's t‐test (t = 0.9435, df = 6), P = 0.3818).
Quantification of the CT15 Western blot and the calculation of the APP α‐C‐terminal fragment (α‐CTF)‐to‐APP and the APP β‐C‐terminal fragment (β‐CTF)‐to‐APP ratio shown in Fig 4F (biological replicates with n = 4 mice per group, ANOVA (df = 1, F = 1.184, P = 0.298), Tukey HSD).
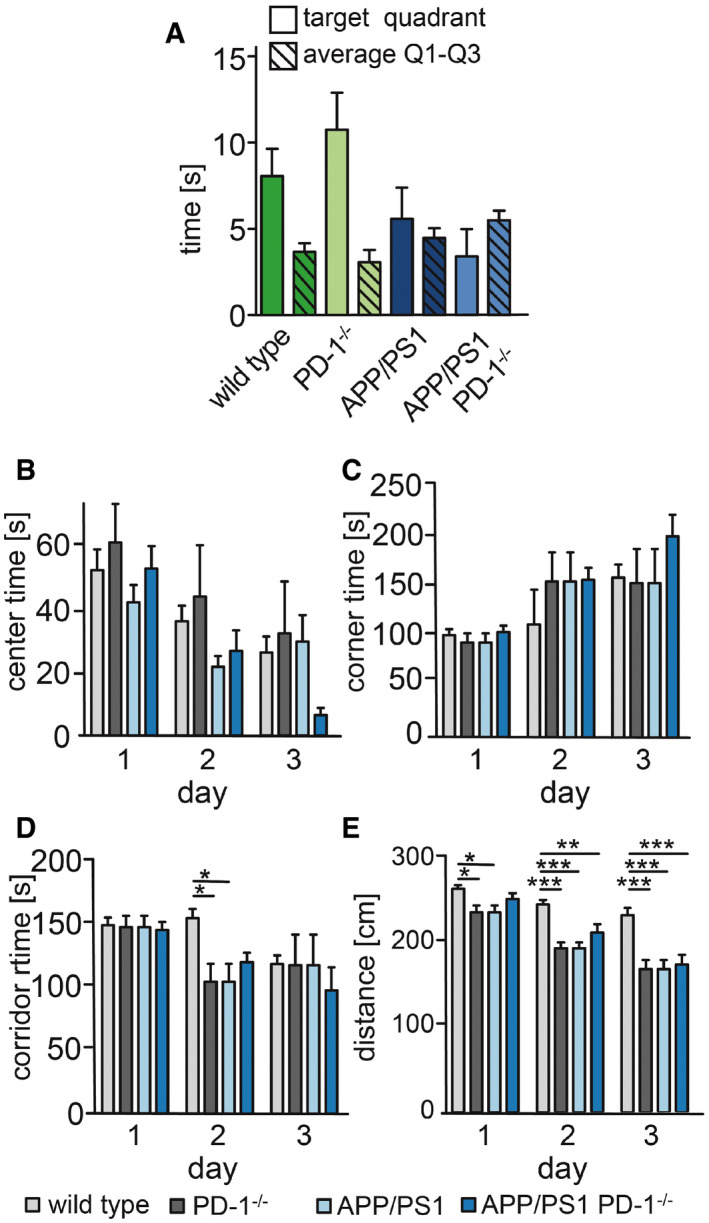
- A
Mice were tested one day after the last trial day for 30 s in the absence of the platform in quadrant 4. The time in the quadrants was measured and averaged for quadrants 1–3.
- B–E
Evaluation of the open field testing for (B) time spend in the center (center time) (ANOVA (F = 0.83, df = 6, P = 0.54), Bonferroni test), (C) corner time (ANOVA (F = 0.47, df = 6, P = 0.93), Bonferroni test), (D) corridor time (ANOVA (F = 1.487, df = 6, P = 0.193), Bonferroni test, *P < 0.05), and (E) distance (ANOVA (F = 0.83, df = 6, P = 0.54), Bonferroni test, *P < 0.05, **P < 0.01, and ***P < 0.001).
- A
In vitro phagocytosis of FAM‐Aβ1‐42 by wild‐type or PD‐1−/− microglia for up to 6 h (mean ± SEM of a technical quadruplicate, Student's t‐test, **P < 0.01 and ***P < 0.001, representative result of an n = 2 biological replicate).
- B
In vitro phagocytosis of FAM‐Aβ1‐42 by wild‐type microglia cultured in astrocyte‐conditioned medium (ACM) from wild‐type or PD‐L1−/− astroglial cultures (mean ± SEM of a technical quadruplicate, Student's t‐test, *P < 0.05 and ***P < 0.001, representative result of an n = 2 biological replicate).
- C
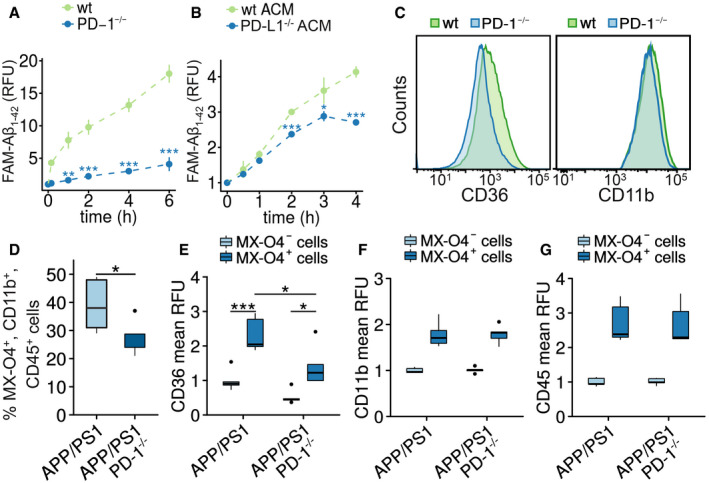
Flow cytometry analysis of microglia from wild‐type and PD‐1−/− mice for the expression of CD36 and CD11b.
- D
Quantification of microglial in vivo phagocytosis in female APP/PS1 and APP/PS1 PD‐1−/− mice at 8.5 months of age after intraperitoneal injection of methoxy‐XO4 (biological replicates with n = 5 for APP/PS1 and n = 4 for APP/PS1 PD‐1−/− mice, Student's t‐test (t = 2.1808, df = 6.9829), *P < 0.05).
- E–G
Relative expression of the cell surface marker (E) CD36 (biological replicates with n = 5 for APP/PS1 and n = 4 for APP/PS1 PD‐1−/− mice, ANOVA (df = 1, F = 0.002, P = 0.94), Tukey's HSD, *P < 0.05, ***P < 0.001), (F) CD11b (biological replicates with n = 5 for APP/PS1 and n = 4 for APP/PS1 PD‐1−/− mice), and (G) CD45 on methoxy‐XO4+ versus methoxy‐XO4− microglia in APP/PS1 and APP/PS1 PD‐1−/− mice normalized to methoxy‐X04‐negative cells from APP/PS1 mice (biological replicates with n = 5 for APP/PS1 and n = 4 for APP/PS1 PD‐1−/− mice).
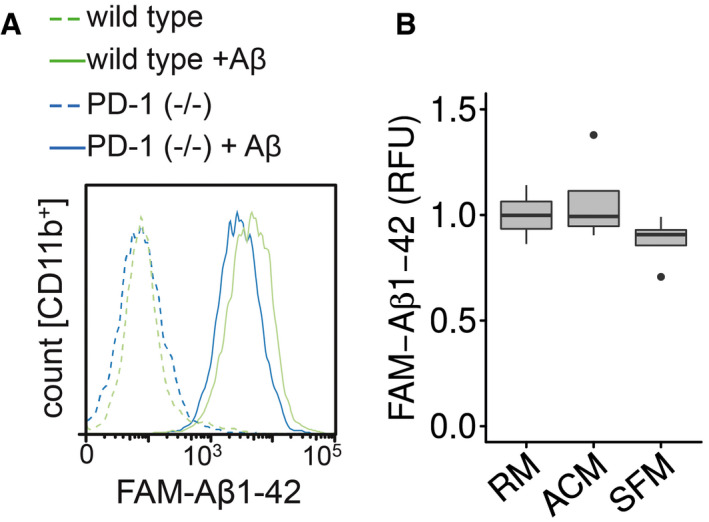
Microglia from wild‐type or PD‐1−/− mice were incubated with FAM‐Aβ1‐42, and the increase in fluorescence was measured in the CD11b+ cells.
Microglia were preincubated for 1 h with regular medium (RM), astrocyte‐conditioned medium (ACM), or serum‐free medium (SFM) followed by the addition of 0.5 μM FAM‐Aβ1‐42 for 4 h (median (central band) with interquartile range (IQR; boxes) and ± 1.5xIQR (whiskers) of one experiment in technical quadruplicates, one‐way ANOVA (df = 2, F = 1.493, P = 0.275), Tukey’s HSD).
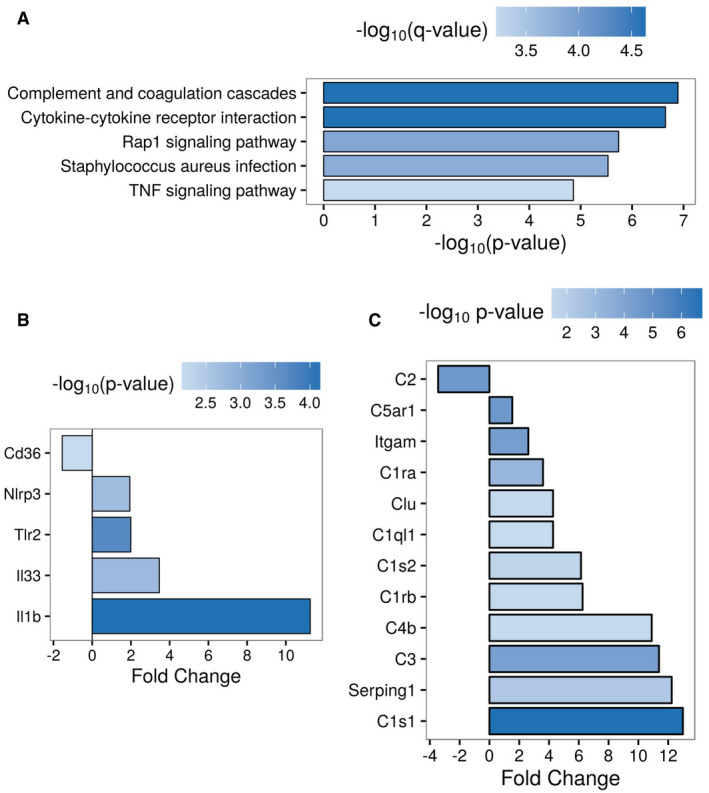
Top 5 enriched KEGG pathways of differentially expressed genes (abs(fold change) > 2, P < 0.01, Benjamini–Hochberg‐adjusted) in PD‐1−/− vs. wild‐type microglia.
Different expression of inflammasome‐related genes (abs(fold change) > 1.5, P < 0.05, Benjamini– Hochberg‐adjusted) in PD‐1−/− vs. wild‐type microglia.
Different expression of complement system‐related genes (abs(fold change) > 1.5, P < 0.05, Benjamini–Hochberg‐adjusted) in PD‐1−/− vs. wild‐type microglia.
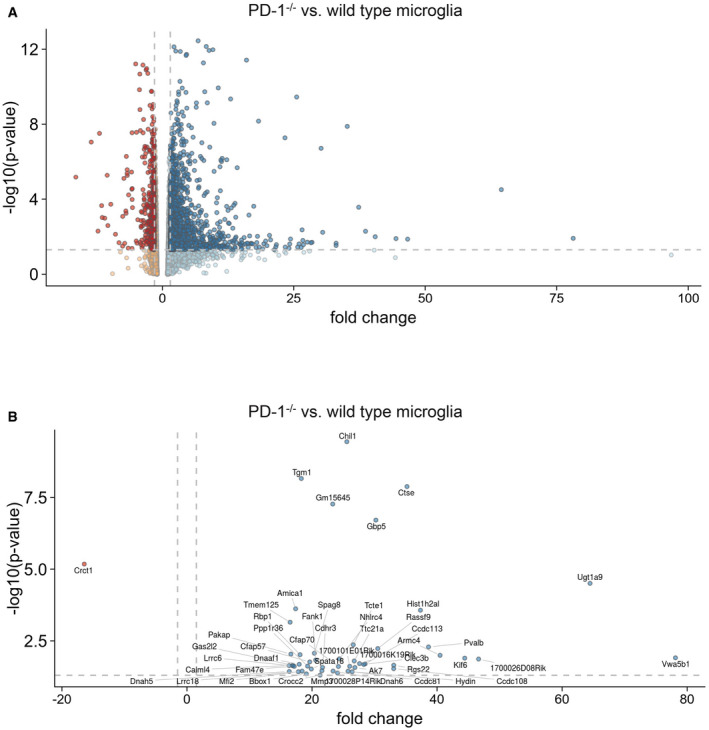
Gene expression in microglia from wild‐type or PD‐1−/− mice presented as a Volcano plot. Dark data points represent more than 1.5 times up‐ or downregulated genes that have a P‐value of 0.05 or less (one‐way ANOVA, dashed lines represent fold change ± 1.5 and P = 0.05).
Same as A but only the top 50 regulated genes are depicted (one‐way ANOVA, dashed lines represent fold change ± 1.5 and P = 0.05).
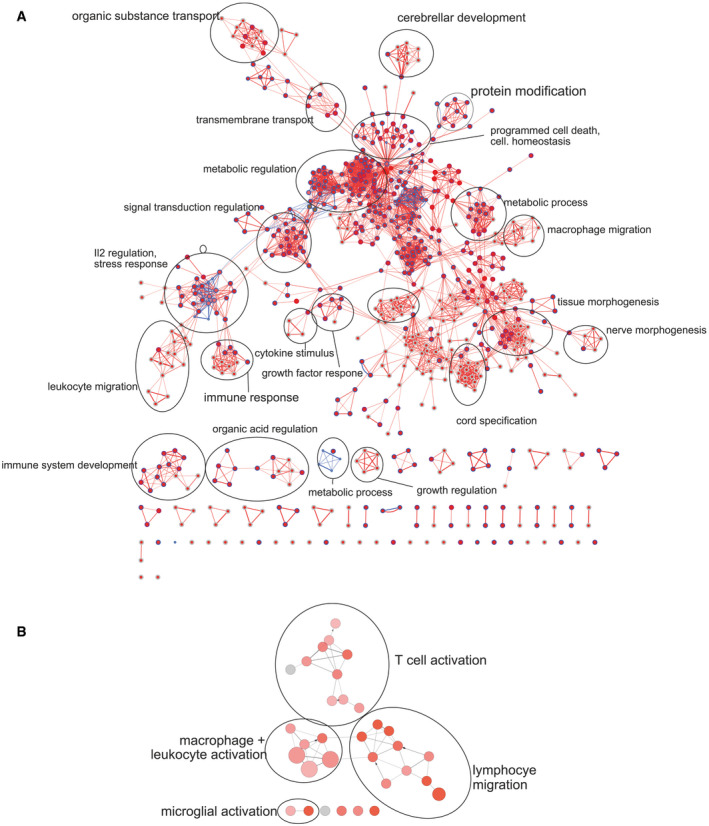
Visualization of gene ontology enrichment analysis (GOEA) of DE genes (PD‐1−/− vs. wild‐type microglia: blue = downregulated genes, red = upregulated genes) using BiNGO and the EnrichmentMap plugin.
ClueGO network analysis of “Immune System Process” GO terms of DE genes (PD‐1−/− vs. wild‐type microglia: red = upregulated genes).
References
-
- Baruch K, Deczkowska A, Rosenzweig N, Tsitsou‐Kampeli A, Sharif AM, Matcovitch‐Natan O, Kertser A, David E, Amit I, Schwartz M (2016) PD‐1 immune checkpoint blockade reduces pathology and improves memory in mouse models of Alzheimer's disease. Nat Med 22: 135–137 - PubMed
Publication types
MeSH terms
Substances
Associated data
- Actions
LinkOut - more resources
Full Text Sources
Other Literature Sources
Medical
Molecular Biology Databases
Research Materials
