. 2021 Nov 26;6(65):eabe3981.
doi: 10.1126/sciimmunol.abe3981. Epub 2021 Nov 26.

Germline biallelic mutation affecting the transcription factor Helios causes pleiotropic defects of immunity

Affiliations

Germline biallelic mutation affecting the transcription factor Helios causes pleiotropic defects of immunity

Tala Shahin et al. Sci Immunol. .

Abstract

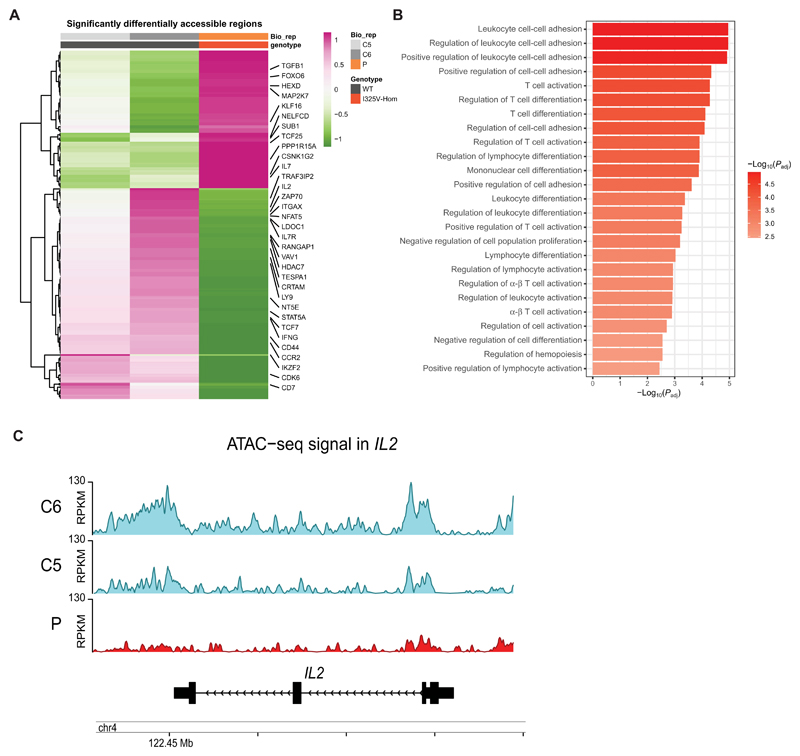
Helios, a member of the Ikaros family of transcription factors, is predominantly expressed in developing thymocytes, activated T cells, and regulatory T cells (Tregs). Studies in mice have emphasized its role in maintenance of Treg immunosuppressive functions by stabilizing Foxp3 expression and silencing the Il2 locus. However, its contribution to human immune homeostasis and the precise mechanisms by which Helios regulates other T cell subsets remain unresolved. Here, we investigated a patient with recurrent respiratory infections and hypogammaglobulinemia and identified a germline homozygous missense mutation in IKZF2 encoding Helios (p.Ile325Val). We found that HeliosI325V retains DNA binding and dimerization properties but loses interaction with several partners, including epigenetic remodelers. Whereas patient Tregs showed increased IL-2 production, patient conventional T cells had decreased accessibility of the IL2 locus and consequently reduced IL-2 production. Reduced chromatin accessibility was not exclusive to the IL2 locus but involved a variety of genes associated with T cell activation. Single-cell RNA sequencing of peripheral blood mononuclear cells revealed gene expression signatures indicative of a shift toward a proinflammatory, effector-like status in patient CD8+ T cells. Moreover, patient CD4+ T cells exhibited a pronounced defect in proliferation with delayed expression of surface checkpoint inhibitors, suggesting an impaired onset of the T cell activation program. Collectively, we identified a previously uncharacterized, germline-encoded inborn error of immunity and uncovered a cell-specific defect in Helios-dependent epigenetic regulation. Binding of Helios with specific partners mediates this regulation, which is ultimately necessary for the transcriptional programs that enable T cell homeostasis in health and disease.


Conflict of interest statement

Competing interests:

The authors declare that they have no competing interests.

Figures

Fig. 1
Fig. 1. Identification of a homozygous missense variant in IKZF2.
(A) Family pedigree of the patient under study. The 17-year-old male patient (II-4) is the only affected member (filled square) but has a sibling who died in utero (small circle). (B) Chromatograms from Sanger sequencing showing the segregation of the C>T variant in IKZF2 in the four family members, leading to an isoleucine to valine amino acid change. (C) Illustration of the Helios transcription factor, with four N-terminal zinc fingers responsible for DNA binding to the consensus sequence and two C-terminal zinc fingers that form the homo/heterodimerization domain. Location of the missense variant (ENST00000457361.1:c.973A>G, ENSP00000410447.1:p.Ile325Val) is shown (red arrow). IKbs, Ikaros binding site. (D) Conservation of the isoleucine amino acid at position 325 of the human transcript, across several species (red rectangular box).
Fig. 2
Fig. 2. Aberrant immune phenotype in the index patient with biallelic Helios mutation.
(A) Flow cytometry plots of CD3 versus CD19 markers in the patient and a control. The three following graphs to the right compare the percentages of T cells (CD3+), B cells (CD19+), and NK cells (CD16+CD56dim; gated on CD3CD19) in lymphocytes between the patient (P; red) and controls [C; adult controls are shown in black; two age-matched controls are shown in blue (n = 8 to 16)]. (B) Graphs showing the frequency of naive B cells (IgD+CD27), CSM B cells (IgDCD27+), non-SM B cells (IgD+CD27+), transitional B cells (CD21++CD38+), and plasmablasts (CD38++CD27+) in patient and controls. (C) Graphs showing the frequency of CD4+ and CD8+ T cells as a percentage of CD3+ T cells (left) and the frequency of CD4+ (middle) and CD8+ (right) naïve (CCR7+CD45RA+), central memory (CM; CCR7+CD45RA), effector memory (EM; CCR7CD45RA), and terminally differentiated effector memory (Temra; CCR7CD45RA+) cells within CD4+ and CD8+ populations, respectively. (D) Frequency of CD8+CD57+ T cells as a percentage of CD3+ T cells. (E) Percentage of Tregs (CD25+FOXP3+) within the CD4+ T cell population (left), the expression of Helios shown as the mean fluorescence intensity (MFI) within the Treg population (center), and overlaid histograms showing Helios expression in the Tregs of patient versus control, including an IgG control for each in gray (left). IgG, immunoglobulin G. (F) Frequency of TFH cells (CXCR5+CD45RA) as a percentage of CD4+ T cells. (G) Percentage of γδ T cells (left), iNKT cells (TCR-Vα24+TCR-Vβ11+; middle), and MAIT cells (CD161+TCR Vα72+; right) within the CD3+ T cell population. The patient's values were taken at two time points (13 and 14 years).
Fig. 3
Fig. 3. Effects of p.I325V mutation on Helios function.
(A) EMSA showing the ability of Helios WT and I325V mutant to form dimers and multimers (arrows) and bind to the IK-bs1 probe, an Ikaros consensus-binding sequence. Representative image of seven independent experiments. EV, empty vector. (B) Immunofluorescence staining of NIH3T3 cells transfected with Helios WT or mutant using an anti-Helios antibody, showing the formation of foci at PC-HC regions. Graph on the right shows the quantification of number of foci per cell (n = 239 to 422). Results represent three independent experiments; unpaired t test was done showing no significant difference. (C) Co-IP experiments after cotransfection of HEK293T cells with Strep-HA-Helios WT, I325V mutant, or an EV together with FLAG-Helios-WT, mutant, or Ikaros. IP was performed with Strep-beads, and Western blot analysis was done by running both the IP and whole-cell lysate (input) on a gel and blotting with HA, FLAG, and GAPDH antibodies. Results are representative of three to five independent experiments. (D) Co-IP as in (C) after cotransfection with HA-HDAC1 and blotting with HDAC1 and Helios antibodies. Blot representative of six independent experiments.
Fig. 4
Fig. 4. Mutant Helios shows altered interactome.
(A) Representation of all high-confidence BioID interactors of HeliosWT and HeliosI325V, clustered into modules based on the protein complexes they are associated with using CORUM (47). Interactors that are missing, gained, or significantly reduced in HeliosI325V are indicated in red, yellow, or orange, respectively. (B) Venn diagram representing number of shared, lost, and gained interactors by HeliosI325V compared with HeliosWT. (C) GO analysis using Enrichr (48) for biological processes of the missing and significantly reduced (≥25% reduction) proteins from (A), with bars indicating the number of proteins associated with each GO term.
Fig. 5
Fig. 5. Altered transcriptional state of Helios-mutant patient PBMCs.
(A) Low-dimensional projection (UMAP plot) of the combined scRNA-seq dataset comprising 25,081 cells from the patient (P) and four controls (two adults, C1: male, C2: female; and two age-matched, C3: male, C4: female). Numbers indicate clusters (graph-based clustering) and colors correspond to cell type (manual curation). (B) UMAP plot [same coordinates as in (A)] showing the distribution of patient cells (orange) within the clusters compared with controls (shades of gray). (C) Heatmap showing differentially expressed genes within cluster 2c between cells from the patient and those from all four controls (Padj < 0.05, |logFC| ≥ 0.25). (D) Heatmap showing differentially expressed genes between clusters 2a and 5. The complete results of the marker genes and DGE analysis for each comparison are available in tables S5 and S6. (E and F) Heatmap showing differentially expressed genes between sorted (E) naïve B cells (CD19+CD27IgD+) and (F) Tregs (CD4+CD25hiCD127) from PBMCs of the patient and three male healthy controls, with three replicates each (Padj < 0.05, |log2FC| ≥ 1). (G) Cytokine production assay, measuring intracellular IL-2 and IFNγ in Tregs(gated for CD4+CD25+FOXP3+) after 6 hours of stimulation with PMA and ionomycin.
Fig. 6
Fig. 6. Patient T cells have defective proliferation and reduced IL-2 production.
(A) Representative histograms displaying the dilution of the violet proliferation dye (VPD450) in CD4+ and CD8+ T cells from the patient and a control after 3 and 8 days of stimulation with CD3/CD28 beads. P, patient; C, control. (B) Summary bar graphs showing the percentage of proliferated or (C) percentage of CD4+ and CD8+ T cells that have up-regulated CD25 at day 3, upon stimulation with CD3/ CD28 beads, in the patient (P; red), sister (S; orange), and controls (C; black, n = 6). Three independent experiments were done. (D) Summary graphs showing the percentage of CD4+ or CD8+ T cells that have up-regulated the checkpoint inhibitors PD-1 and TIGIT after stimulation with CD3/CD28 beads at basal state (before stimulation), days 2, 4, and 7 after stimulation. (P, patient, red; and C, controls, black, n = 3). (E) Bar graphs showing the percentage of CD4+ and memory CD8+ T cells that produced IL-2 after stimulation of PBMCs with PMA/ionomycin for 5 hours. (F) Amount of IL-2 (in micro-grams per milliliter) released into the medium after stimulating PBMCs with CD3/CD28 beads for 24 hours. The sister (orange) is included with the controls in (E) and (F) (C; n = 3 to 8). IL-2 production in CD4+ T cells of the patient was done in two independent experiments. (G) Bar graphs showing the percentage of cell death in T lymphoblasts, measured by annexin V and propidium iodide staining, after withdrawing IL-2 from the growth medium. Results are from two experiments. (H) Percentage of CD8+ T cells expressing IL-2 after stimulation of T lymphoblasts with PMA/ionomycin for 20 hours, including the T lymphoblast clone that had the IKZF2 gene CRISPR-edited to express WT alleles (P-WT, blue bar on graph). Each data point represents an independent experiment. Error bars in all summary bar graphs show the means with SEM.
Fig. 7
Fig. 7. HeliosI325V leads to global chromatin changes and less accessibility for the IL2 locus upon T cell activation.
(A) Heatmap of significantly differentially accessible regions in controls- and patient-derived T lymphoblast cells upon T cell activation. Highlighted are key genes that have been shown to be involved in IL-2 signaling. Values are scored across rows, z scores (1 indicates that the regions of the corresponding genes are transcriptionally accessible, whereas −1 indicates that the regions are not accessible). (B) Top 25 significantly [Padj < 0.05] enriched GO Biological Process terms for genes from less chromatin accessible regions in patient-derived cells compared with normal donors. (C) Comparison of ATAC-seq signal tracks for IL2 gene locus between patient and two normal donors (ND). Reads per kilobase per million mapped (RPKM) reads normalized tracks.

References

    1. John LB, Ward AC. The Ikaros gene family: Transcriptional regulators of hematopoiesis and immunity. Mol Immunol. 2011;48:1272–1278. - PubMed
    1. Heizmann B, Kastner P, Chan S. The Ikaros family in lymphocyte development. Curr Opin Immunol. 2018;51:14–23. - PubMed
    1. Fan Y, Lu D. The Ikaros family of zinc-finger proteins. Acta Pharm Sin B. 2016;6:513–521. - PMC - PubMed
    1. Georgopoulos K. The making of a lymphocyte: The choice among disparate cell fates and the IKAROS enigma. Genes Dev. 2017;31:439–450. - PMC - PubMed
    1. Sridharan R, Smale ST. Predominant interaction of both Ikaros and Helios with the NuRD complex in immature thymocytes. J Biol Chem. 2007;282:30227–30238. - PubMed

Publication types