. 2022 Mar:164:58-68.
doi: 10.1016/j.yjmcc.2021.11.011. Epub 2021 Nov 24.

Improved epicardial cardiac fibroblast generation from iPSCs

Affiliations

Improved epicardial cardiac fibroblast generation from iPSCs

Alexander J Whitehead et al. J Mol Cell Cardiol. 2022 Mar.

Abstract

Since the initial isolation of human embryonic stem cells and subsequent discovery of reprogramming methods for somatic cells, thousands of protocols have been developed to create each of the hundreds of cell types found in-vivo with significant focus on disease-prone systems, e.g., cardiovascular. Robust protocols exist for many of these cell types, except for cardiac fibroblasts (CF). Very recently, several competing methods have been developed to generate these cells through a developmentally conserved epicardial pathway. Such methods generate epicardial cells, but here we report that prolonged exposure to growth factors such as bFGF induces fibroblast spindle-like morphology and similar chromatin architecture to primary CFs. Media conditions for growth and assays are provided, as well as suggestions for seeding densities and timepoints for protein harvest of extracellular matrix. We demonstrate marker expression and matrix competency of resultant cells as shown next to primary human cardiac fibroblasts. These methods provide additional guidance to the original protocol and result in an increasingly stable phenotype.

Keywords: ATAC-sequencing; Cardiac fibroblast; Differentiation; Epicardial; iPSC.


Conflict of interest statement

Declaration of competing interest

The authors declare no competing financial interests.

Figures
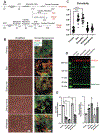
Fig. 1.
Fig. 1.. Comparison of CF differentiation protocols.
A. Schematic of various cardiac fibroblast differentiations, highlighting differences within and between developmental origins. B. Brightfield (left) images of Promocell primary ventricular cardiac fibroblasts and the resultant cells from each protocol after being cultured in Promocell Fibroblast Growth Medium at 25 k/cm2 for three days (n = 3, cultured in triplicate, repeated twice). Immunofluorescent staining of CFs (25 k/cm2) after 3 days of culture in assay media for fibronectin-EDA (green), αSMA (red), and DAPI (blue). C. Quantification of cell circularity between fibroblast differentiations. 10 cells were traced in three images for each group, p < 0.05 using a one-way ANOVA. D. Representative western blot for type I collagen, fibronectin-EDA, and beta Actin of mRIPA soluble CF lysate (50 k/cm2) cultured for 3 days in assay media (n = 3, samples differentiated in triplicate). E. Densitometry of western blots, bands normalized to beta actin and primary groups between blots. n = 3, significance is defined as p < 0.05 by one-way ANOVA.
Fig. 2.
Fig. 2.. Differentiation and characterization of PSC-derived CFs.
A. Brightfield images (top row, black and white) of cells on days 0, 6, 12, and 32, respectively. Immunofluorescent staining of transcription factors (bottom row, left three), and CF markers (yellow box, colored images) of iPSC-derived lines. Scale bars represent 100 μm. N = 3 performed in parallel in triplicate. B. Immunofluorescent staining of CF markers in assay medium (top row) or growth medium (bottom row), using iPSC-derived CFs (scale bars are 200 μm). C. Media comparisons using Promocell primary CFs (scale bars are 100 μm). N = 3 performed in parallel in triplicate. D. qPCR readout of ACTA2 after 10 ng/mL of TGF-β in 1% serum-containing growth medium. E. Flow cytometry FSC-Area vs αSMA fluorescent intensity of untreated (control) or TGF-β (10 ng/mL) after three days. Antibodies were titrated from 0.625 to 7 μL/100 k cells. Geometric mean (right) of each population and significance calculated using a regression slope test, p < 0.01.
Fig. 3.
Fig. 3.. Vimentin and PDGFR α expression are hallmarks of differentiated CFs.
A. Immunofluorescent staining of primary and derived CFs. DAPI, PDGFRα, and TCF21 were co-stained (left) and vimentin is shown with DAPI background. B. Quantification of vimentin and PDGFRα intensity per cell from immunostained samples. N = 3 samples, 3–4 images per sample. Testing performed using a non-parametric one-way ANOVA, p < 0.05. Tukey post-hoc test performed between primary (red lines) and Whitehead samples (blue lines) vs others. C. Flow cytometry histograms of PDGFRα fluorescence across groups demonstrating gate placement right of unstained controls. Quantification of percent PDGFRα+ cells (right) over samples.
Fig. 4.
Fig. 4.. ATAC sequencing of differentiation stages.
A. Principal component analysis and correlation heatmap of iPSC-derived cells and Cell Biologics Primary CFs. Primary cells are from the same donor cultured for either 1 or 4 passages. N = 2 per condition, once per iPSC clone for differentiated cells. B. Number of differentially accessible regions from HOMER DESEQ2 output (q < 0.05) when comparing sample groups (n = 2 for differentiated cells and Cell Biologics samples, and N = 3 for primary donor samples from Hocker et al.). There was a total of 70,507 peaks in the merged peakset. C. ATAC sequencing principal component analysis including pseudo-bulk samples from Hocker et al. Cell types clustered together and labels were color coded based on cell identity while point color designates origin of cell, either primary or iPSC-derived. D. Integrative Genomics Viewer (IGV) snapshots of αSMA gene (ACTA2) peaks, including iPSC-derived (n = 2 per cell type), Cell Biologics (n = 2), and ventricular primary pseudo-bulk cardiomyocyte and fibroblast cells (n = 3) from Hocker et al. Tracks displayed are reads per genomic content (RPGC) normalized bigwig files and color-coded by cell type.

References

    1. Wynn TA, Fibrotic disease and the TH1/TH2 paradigm, Nat. Rev. Immunol 4 (2004) 583–594, 10.1038/nri1412. - DOI - PMC - PubMed
    1. Herum KM, Choppe J, Kumar A, Engler AJ, McCulloch AD, Mechanical regulation of cardiac fibroblast profibrotic phenotypes, Mol. Biol. Cell 28 (2017) 1871–1882, 10.1091/mbc.E17-01-0014. - DOI - PMC - PubMed
    1. Rayahin JE, Buhrman JS, Zhang Y, Koh TJ, Gemeinhart RA, High and low molecular weight hyaluronic acid differentially influence macrophage activation, ACS Biomater. Sci. Eng 1 (2015) 481–493, 10.1021/acsbiomaterials.5b00181. - DOI - PMC - PubMed
    1. Irwin EF, Saha K, Rosenbluth M, Gamble LJ, Castner DG, Healy KE, Modulus-dependent macrophage adhesion and behavior, J. Biomater. Sci. Polym. Ed 19 (2008) 1363–1382, 10.1163/156856208786052407. - DOI - PubMed
    1. Landry NM, Rattan SG, Dixon IMC, An improved method of maintaining primary murine cardiac fibroblasts in two-dimensional cell culture, Sci. Rep 9 (2019) 1–13, 10.1038/s41598-019-49285-9. - DOI - PMC - PubMed

Publication types