. 2022 Feb 1:526:112-130.
doi: 10.1016/j.canlet.2021.11.026. Epub 2021 Nov 23.

PKCθ-mediated serine/threonine phosphorylations of FAK govern adhesion and protrusion dynamics within the lamellipodia of migrating breast cancer cells

Affiliations

PKCθ-mediated serine/threonine phosphorylations of FAK govern adhesion and protrusion dynamics within the lamellipodia of migrating breast cancer cells

Lucie Chadelle et al. Cancer Lett. .

Abstract

The cytoskeleton and cell-matrix adhesions constitute a dynamic network that controls cellular behavior during development and cancer. The Focal Adhesion Kinase (FAK) is a central actor of these cell dynamics, promoting cell-matrix adhesion turnover and active membrane fluctuations. However, the initial steps leading to FAK activation and subsequent promotion of cell dynamics remain elusive. Here, we report that the serine/threonine kinase PKCθ participates in the initial steps of FAK activation. PKCθ, which is strongly expressed in aggressive human breast cancers, controls the dynamics of cell-matrix adhesions and active protrusions through direct FAK activation, thereby promoting cell invasion and lung metastases. Using various tools for in vitro and live cell studies, we precisely decipher the molecular mechanisms of FAK activation. PKCθ directly interacts with the FAK FERM domain to open FAK conformation through PKCθ's specific V3 domain, while phosphorylating FAK at newly identified serine/threonine residues within nascent adhesions, inducing cell dynamics and aggressive behavior. This study thus places PKCθ-directed FAK opening and phosphorylations as an original mechanism controlling dynamic, migratory, and invasive abilities of aggressive breast cancer cells, further strengthening the emerging oncogenic function of PKCθ.

Keywords: Cancer cell migration and invasion; Cell dynamics; FAK; PKCθ; Phosphorylation.


Conflict of interest statement

COMPETING FINANCIAL INTERESTS

The authors declare no competing financial interests.

DECLARATION OF INTERESTS

The authors declare that they have no known competing financial interests or personal relationships that could have appeared to influence the work reported in this paper.

Figures

Figure 1.
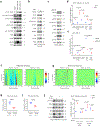
Figure 1.. PKCθ controls adhesion and protrusion dynamics.
a. Time-lapse images of GFP-Paxillin in MCF7 and MDA-MB-231 cells showing the dynamics of adhesions and protrusions (white arrows). b–e, j–k. Heatmap from the indicated time periods of one representative breast cancer cell expressing GFP-Paxillin in order to show the status of adhesion (b, d, j) or protrusion (c, e, k) dynamics: (b, c) MCF7 cells vs MDA-MB-231 cells (d, e) MCF7-PKCθ-CA Tet-Off cell cultured without chemotaxis in the presence (cont: +Dox) or absence of Dox (PKCθ-CA: −Dox) (j, k) MDA-MB-436 cell expressing sicont or siPKCθ. Each row represents a series of the relative adhesion or protrusion area from 30 sections of a breast cancer cell at the indicated time periods. Positions from 1 to 30 plotted on the x-axis correspond to the section. For all heatmap images, RGB color bars have been used to label the range of the signal dynamics of either focal adhesion area or protrusion area. f, l, g, m. Quantification of the average adhesion (f, l) or protrusion (g, m) dynamic variation from the indicated cells. Data are presented as average values (± s.d.) and the p-values were calculated using the student’s t-test. n is the number of analyzed cells from 3 independent experiments. The cells have been chosen in an unbiased manner. h, i. WCEs from either (h) MCF7 cells stably expressing active PKCθ under tetracycline control (MCF7-PKCθ-CA Tet-Off) treated with (−) or without Doxycycline (Dox) (+) or (i) MDA-MB-436 cells transfected with a pool of two different siRNAs targeting the PRKCQ gene, were subjected to immunoblotting analysis.
Figure 2.
Figure 2.. PKCθ silencing reduces the aggressive properties of highly invasive breast cancer cells.
a. MDA-MB-231 and MDA-MB-436 cells, transfected as in Fig.1i, were either plated in 12-well plates for immunoblotting analysis (bottom panel) or subjected to an invasion assay (top panel) for 16 h. Cells that invaded to the lower side of filter were quantified by MTT assay using spectrometric determination of the optical density at 540 nm and normalized by the OD540 obtained with the total cells. Data are presented as average values (± s.d.) and the p-values were calculated using the student’s t-test (n=3 independent experiments performed in triplicate). b. MDA-MB-231 and MDA-MB-436 cells, transfected as in Fig.1i, were subjected to a 3-D Matrigel invasion assay. After 7 days, colonies were photographed at a magnification of x40. Images are representatives of 3 independent experiments. c-d. Bioluminescent images of lung metastasis in athymic nude mice that were injected intravenously with MDA-MB-231-LM2-4175 cells stably expressing either shCont or shPKCθ or shPKCθ-3-UTR-A at week 5 post-injection. e-f. Quantitative analysis of bioluminescence in lung metastasis as shown in c-d. Dot plot represents the bioluminescence signal (± s.e.m) for each group at the endpoint (week 5 post-injection). The p-value was calculated using the student’s t-test. n is the number of mice used for each group. g. PKCθ immunohistochemistry of representative breast cancers with aggressive (strong staining, score 3) or indolent (no staining, score 0) behavior. Scale bars represent 50 μm. h. PKCθ expression in 10 human breast cancers with aggressive or indolent behavior. * % corresponds to the percentage of tumor cells stained over one tumor section. ** Semi-quantitative evaluation of intensity. A score of 0 means no staining, 1 weak, 2 intermediate, and 3 strong staining. GIST (Gastrointestinal Stromal Tumor) was used as a positive control. TNBC (Triple Negative Breast Cancer).
Figure 3.
Figure 3.. PKCθ controls the cell dynamic network via the FAK signaling.
a. Whole-cell extracts (WCEs) from the low invasive (MCF7) and highly invasive (MDA-MB-436, MDA-MB-231) breast cancer cell lines were analyzed using immunoblotting with antibodies against FAK, pY397-FAK, pY576/577-FAK, pY925-FAK, Src, pY416-Src, Paxillin, pY118-Paxillin, PKCθ and actin, which was used to confirm equal loading. b-c. WCEs from (b) MCF7-PKCθ-CA Tet-Off treated with (−) or without Doxycycline (Dox) (+) or (c) MDA-MB-231 cells transfected as in Fig. 1i were subjected to immunoblotting analysis. d-e. Dot plot analysis representing the indicated phospho signals normalized to the corresponding total protein (average values ± s.d.) from Fig. 2b and 2c (n=2 independent experiments). f-g. Heatmap from the indicated time periods of one representative MCF7-PKCθ-CA Tet-Off cell expressing siCont or siFAK-5’UTR in the absence of Dox and expressing GFP-Paxillin in order to show the status of adhesion (f) or protrusions (g) dynamics, as described in Fig. 1. h-i. Quantification of the average adhesion (h) and protrusion (i) dynamic variation from the indicated condition. Data are presented as average values (± s.d.) and the p-values were calculated using the student’s t-test. n is the number of analyzed cells from 3 independent experiments. The cells have been chosen in an unbiased manner. j. WCEs from MCF7-PKCθ-CA Tet-Off cells, transfected with siRNA targeting the FAK gene in the presence or absence of Dox, were subjected to immunoblotting analysis using antibodies against Src, pY416-Src, Paxillin, pY118-Paxillin, FAK and actin. The dot plot represents the indicated phospho signals normalized to the corresponding total protein (average values ± s.d.) (n=2 independent experiments).
Figure 4.
Figure 4.. PKCθ enhances the number of assembling and disassembling adhesions while reducing stable adhesions.
a. Time-lapse images of GFP-Paxillin in MCF7-PKCθ-CA Tet-Off cells with or without Dox showing the stable (white arrows), assembling (red arrows) and disassembling (yellow arrows) adhesions. b-e. Percentage of stable, assembling and disassembling adhesions calculated from the movies of the indicated breast cancer cells expressing GFP-Paxillin: (b) MCF7-PKCθ-CA Tet-Off cell cultured without chemotaxis in the presence (cont: +Dox) or absence of Dox (PKCθ-CA: −Dox) (c) MCF7-PKCθ-CA Tet-Off cell cultured under directional migration in the presence (cont: +Dox) or absence of Dox (PKCθ-CA: −Dox) (d) MDA-MB-436 cell expressing sicont or siPKCθ (e) MCF7-PKCθ-CA Tet-Off cell expressing siCont or siFAK-5’UTR in the absence of Dox. n is the number of analyzed cells from 3 independent experiments. For each analyzed cell, all adhesions have been quantified. f. left, Representative image of individual adhesion dynamic with an assembly, stable and disassembly phase; right, temporal fluorescence intensity profile of GFP-Paxillin in a representative individual adhesion. g. Rate quantification of adhesion assembly and adhesion disassembly for the indicated conditions. h. Quantification of the elongation index of adhesions for the indicated conditions. i. Quantification of the stable phase period of adhesions. In g-i, n is the number of analyzed adhesions from 3 independent experiments. The adhesions have been chosen in an unbiased manner. In b-e, g, boxes extend from the 25th to 75th percentiles, the mid line represents the median and the whiskers indicate the maximum and the minimum values. In h,i, data are presented as average values (± s.d.) and the p-values were calculated using the student’s t-test.
Figure 5.
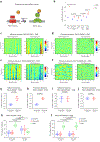
Figure 5.. The rapid allosteric activation of PKCθ is sufficient to induce adhesion and protrusion dynamics.
a. Schematic representation of the rapamycin-activatable system. b. MCF7 cells were co-transfected with mCherry-FRB and the PKCθ-iFKBP construct #3. Two days later, cells were treated with 200 nM Rapamycin (Rap) or DMSO for 1h, and then WCEs were subjected to immunoblotting analysis against the indicated antibodies. The dot plot represents the indicated phospho signals normalized to the corresponding total protein (average values ± s.d.) (n=2 independent experiments). c-f. Heatmap from the indicated time periods of one representative MCF7 cell expressing either PKCθ-iFKBP-GFP (c, d) or PKCθ-iFKBP-KD-GFP (e, f), together with FRB and mCherry-Paxillin before and after treatment with 200 nM Rapamycin in order to show the status of adhesion (c, e) and protrusion (d, f) dynamics, as described in Fig. 1. g-j. Quantification of the average adhesion (g, i) and protrusion (h, j) dynamic variation from the indicated condition. Data are presented as average values (± s.d.) and the p-values were calculated using the student’s t-test. n is the number of analyzed cells from 3 independent experiment. The cells have been chosen in an unbiased manner. k-l. Percentage of stable, assembling and disassembling adhesions calculated from the movies of MCF7 cells expressing either PKCθ-iFKBP-GFP (k) or PKCθ-iFKBP-KD-GFP (l), together with FRB and mCherry-Paxillin before and after treatment with 200 nM Rapamycin. Boxes extend from the 25th to 75th percentiles, the mid line represents the median and the whiskers indicate the maximum and the minimum values. n is the number of analyzed cells from 3 independent experiments. For each analyzed cell, all adhesions have been quantified.
Figure 6.
Figure 6.. The regulatory domain of PKCθ interacts with FAK FERM domain to open FAK conformation.
a. WCEs from the highly invasive breast cancer cells with very strong endogenous PKCθ level were immunoprecipitated with an anti-PKCθ antibody and immunoblotted with anti-FAK and anti-PKCθ antibodies. The input corresponds to 2% of WCEs used in immunoprecipitation. b. Purified His-PKCθ was incubated with GST or GST-FAK fusion proteins purified from E. coli. Input and pull down samples were analyzed by immunoblotting to detect PKCθ. c. WCEs, from MCF7 cells co-transfected with HA-FAK WT and either Flag-PKCθ-WT or Flag-PKCθ-ΔNt or Flag-PKCθ-ΔCt or empty vector (EV), were immunoprecipitated with an anti-HA antibody, and immunoblotted with anti-HA and anti-Flag antibodies. The input corresponds to 4% of WCEs used in immunoprecipitation. d. WCEs, from MCF7 cells co-transfected with Flag-PKCθ-WT and either HA-FAK-WT or HA-FAK-ΔFERM or HA-FAK-ΔKinase or HA-FAK-ΔCt, were immunoprecipitated with an anti-Flag antibody, and immunoblotted with anti-Flag and anti-HA antibodies. The input corresponds to 4% of WCEs used in immunoprecipitation. e. Purified His-PKCθ was incubated with the indicated GST fusion proteins as in b. GST and GST-GRIP1 (aa 5–765) were used as negative control. f, h. Representative FAK WT conformational biosensor FRET images of MCF7 cells expressing PKCθ CA, PKCθ KD, PKCθ WT, PKCθ ΔC1, PKCθ ΔC2, PKCθ ΔV3, PKCδ CA, PKCθ+δV3, θV3 or empty vector (EV). FAK open corresponds to the expression of a constitutively open variant of FAK biosensor carrying the Y180A/M183A mutations. A RGB color bar has been used to show the range of FRET ratio. Arrows mark one of the individual adhesions in different indicated MCF7 cells, which have been used for the quantification of average FRET ratio from individual cells. g, i. Quantification of the average FAK conformational biosensor FRET ratio from indicated MCF7 cells. The number of analyzed cells at each condition is 12. The cells have been chosen in an unbiased manner. Data are presented as average values (± s.d.) and the p-values were calculated using the student’s t-test. j. Molecular modeling showing the interaction surfaces in a 3D conformation between PKCθ and FAK proteins. The different domains of both proteins are indicated.
Figure 7.
Figure 7.. PKCθ phosphorylates FAK to control FAK activation.
a. Recombinant GST-FAK-WT fusion protein was used as the substrate in in vitro kinase assay in the absence (−) or presence of recombinant active His-PKCθ. Phospho-FAK (32P-FAK) was detected by autoradiography. The size of the full-length GST-FAK-WT is 152 kDa and the band at 100 kDa corresponds to a truncated form of GST-FAK-WT that can also be phosphorylated by PKCθ. b, e. MCF7 cells were co-tranfected with HA-FAK-WT or various HA-FAK mutants in the presence (+) or absence (−) of PKCθ-CA expression vector. The activation of immunoprecipitated FAK variants was tested by immunoblotting using antibodies against pY397-FAK, pY576/577-FAK, pY925-FAK. The presence of PKCθ and the equal amount of immunoprecipitated FAK variants were detected using antibodies against PKCθ and HA, respectively. c, Left panels, MCF7 cells were co-transfected with HA-FAK-WT or HA-FAK-K454R, together with either PKCθ-CA or PKCθ-KD or empty vector (EV), as indicated. Right panels, MCF7 cells were transfected with HA-FAK-WT. 48h later, cells were either treated for 1h with 100 ng/ml EGF (EGF) or vehicle (cont), or were detached by acutase treatment and replated for 1h on non-treated plate (Susp, suspended cells) or on serum-coated plate (Adhe, adherent cells). The activation of immunoprecipitated FAK was tested by immunoblotting using antibodies against pY397-FAK, pY576/577-FAK, pY925-FAK. The presence of PKCθ and the equal amount of immunoprecipitated FAK were detected using antibodies against PKCθ and HA, respectively. d. Signal quantification of the different phosphorylated FAKs, as shown in b, normalized with the signal obtained with the HA antibody in the IP condition (n=3 independent experiments). The bar graph represents the fold increase or decrease (± s.d.) of the indicated phospho signals. f. Recombinant GST-FAK-WT or mutant fusion proteins were used as the substrate in in vitro kinase assay in the absence (−) or presence of recombinant active His-PKCθ. Phospho-FAK (32P-FAK) was detected by autoradiography. g. MDA-MB-231 and MDA-MB-436 cells were transfected with a pool of two different siRNAs targeting the PRKCQ gene. After two successive 48h-transfections, WCEs were subjected to immunoblotting analysis using antibodies against pS892–893-FAK, pT656-FAK, FAK, PKCθ and actin. The dot plot represents the indicated phospho signals normalized to the corresponding total protein (average values ± s.d.) (n=2 independent experiments). h. Quantification of the average FAK conformational biosensor FRET ratio from MCF7 cells expressing FAK-WT or the indicated non phosphorylatable FAK mutants. The number of analyzed cells at each condition is 12. The cells have been chosen in an unbiased manner. Data are presented as average values (± s.d.) and the p-values were calculated using the student’s t-test.
Figure 8.
Figure 8.. The FAK phosphorylations on S892–893 and T656 are critical mediators of PKCθ effects on adhesion and membrane dynamics, and on the migratory ability of the cells.
a. Confluent MDA-MB-231 cells were subjected to a wound healing assay for 16h, and then were fixed and stained with antibodies against pT538-PKCθ, pS892–893-FAK, pT656-FAK and FAK. Images represent the cells located at the migration leading edge or in the confluent center region far from the wound (Center). The white arrow indicates the migration direction. b, d. Heatmap from the indicated time periods of one representative MCF7-PKCθ-CA Tet-Off cell expressing GFP-Paxillin and siFAK-5’UTR together with either FAK-WT, FAK S892–893A, or FAK T656A in the absence of Dox in order to show the status of adhesion (b) and protrusion (d) dynamics, as described in Fig. 1. c, e. Quantification of the average adhesion (c) and protrusion (e) dynamic variation from the indicated conditions. n is the number of analyzed cells from 3 independent experiments. The cells have been chosen in an unbiased manner. f. Percentage of stable, assembling and disassembling adhesions calculated from the movies of the MCF7-PKCθ-CA Tet-Off cells expressing GFP-paxillin and siFAK-5’UTR together with either FAK-WT, FAK S892–893A, or FAK T656A in the absence of Dox. boxes extend from the 25th to 75th percentiles, the mid line represents the median and the whiskers indicate the maximum and the minimum values. n is the number of analyzed cells from 3 independent experiments. For each analyzed cell, all adhesions have been quantified. g. Quantification of the elongation index of adhesions for the indicated conditions. h. Quantification of the stable phase period of adhesions. i. MDA-MB-231 cells were transfected with siRNA targeting the 5’UTR region of the FAK gene, and 24h later cells were co-transfected with the indicated GFP-FAK variants. One day later, MDA-MB-231 cells were filmed as they migrate randomly for 16h. The data represent the trajectory of individual cells. n is the number of tracked cells from 3 independent experiments. j. Speed measurements from the MDA-MB-231 cells tracked in Fig. 8i. k, l. MDA-MB-231 cells were transfected with siRNA targeting the 5’UTR region of the FAK gene, and 24h later cells were co-transfected with pCDNA3.1Luc and the indicated HA-FAK variants. One day later, MDA-MB-231 cells were either (k) subjected to an invasion assay for 16 h. (n=3 independent experiments performed in triplicate) or (l) plated in 12-well plates for immunoblotting analysis using antibodies against Paxillin, pY118-Paxillin, Src, pY416-Src, FAK, and actin (immunoblots representative of 3 independent experiments). Cells that invaded to the lower side of filter were quantified using the determination of the luciferase activity (thereby quantifying only transfected cells) and normalized by the luciferase activity obtained with the total cells. In g-h, n is the number of analyzed adhesions from 3 independent experiments. The adhesions have been chosen in an unbiased manner. In c-e, g-h, j-k, data are presented as average values (± s.d.) and the p-values were calculated using the student’s t-test.

Similar articles

Cited by

References

    1. Hayashi K & Altman A Protein kinase C theta (PKCtheta): a key player in T cell life and death. Pharmacological research 55, 537–544 (2007). - PMC - PubMed
    1. Blay P et al. Protein kinase C theta is highly expressed in gastrointestinal stromal tumors but not in other mesenchymal neoplasias. Clinical cancer research : an official journal of the American Association for Cancer Research 10, 4089–4095 (2004). - PubMed
    1. Motegi A et al. PKC theta, a novel immunohistochemical marker for gastrointestinal stromal tumors (GIST), especially useful for identifying KIT-negative tumors. Pathol Int 55, 106–112 (2005). - PubMed
    1. Belguise K et al. The PKCtheta pathway participates in the aberrant accumulation of Fra-1 protein in invasive ER-negative breast cancer cells. Oncogene 31, 4889–4897 (2012). - PMC - PubMed
    1. Belguise K & Sonenshein GE PKCtheta promotes c-Rel-driven mammary tumorigenesis in mice and humans by repressing estrogen receptor alpha synthesis. J Clin Invest 117, 4009–4021 (2007). - PMC - PubMed

Publication types

Substances