. 2021 Dec 15:245:118755.
doi: 10.1016/j.neuroimage.2021.118755. Epub 2021 Nov 24.

Ultra-long-TE arterial spin labeling reveals rapid and brain-wide blood-to-CSF water transport in humans

Affiliations

Ultra-long-TE arterial spin labeling reveals rapid and brain-wide blood-to-CSF water transport in humans

Leonie Petitclerc et al. Neuroimage. .

Abstract

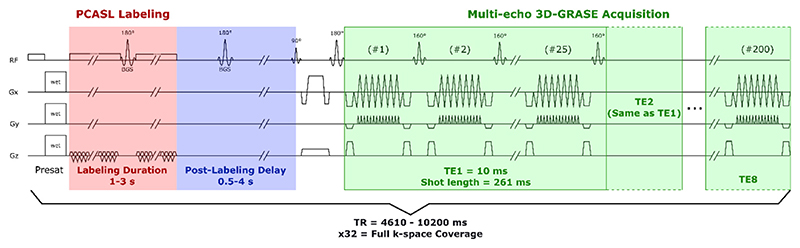
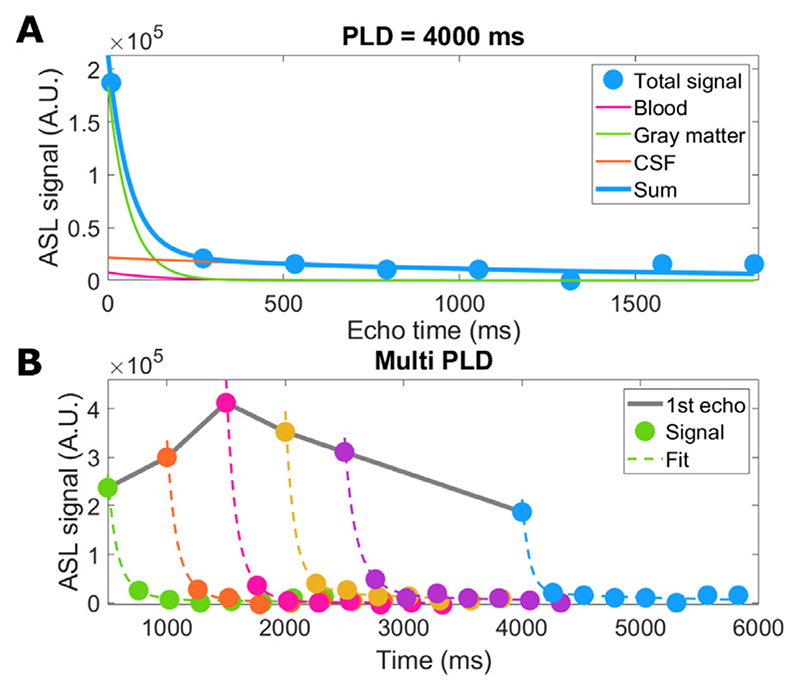
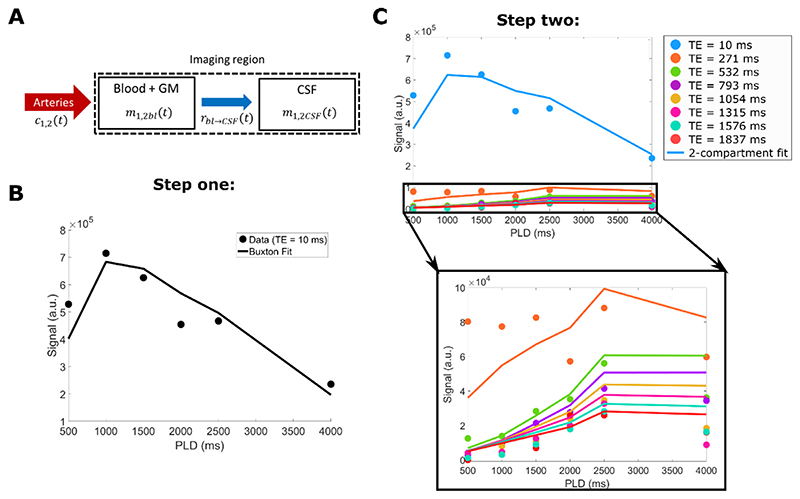
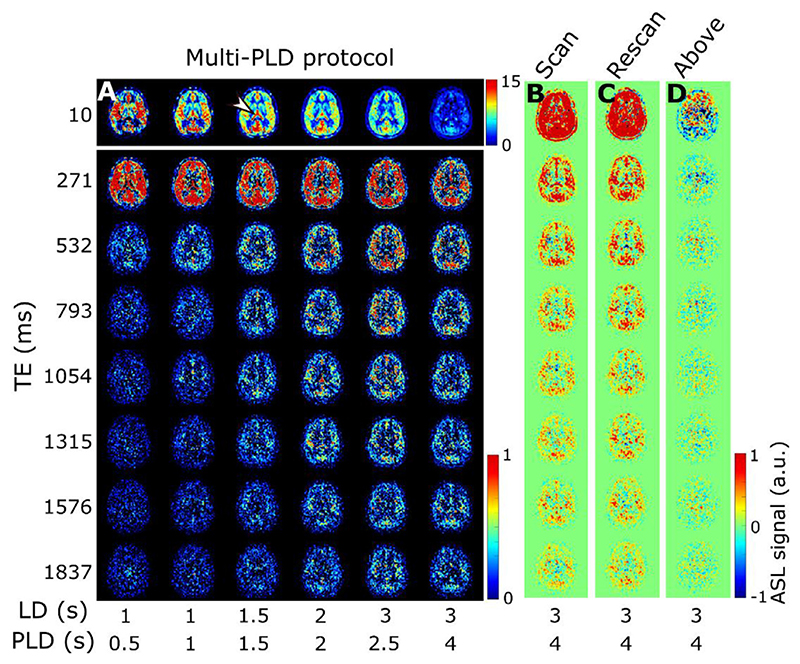
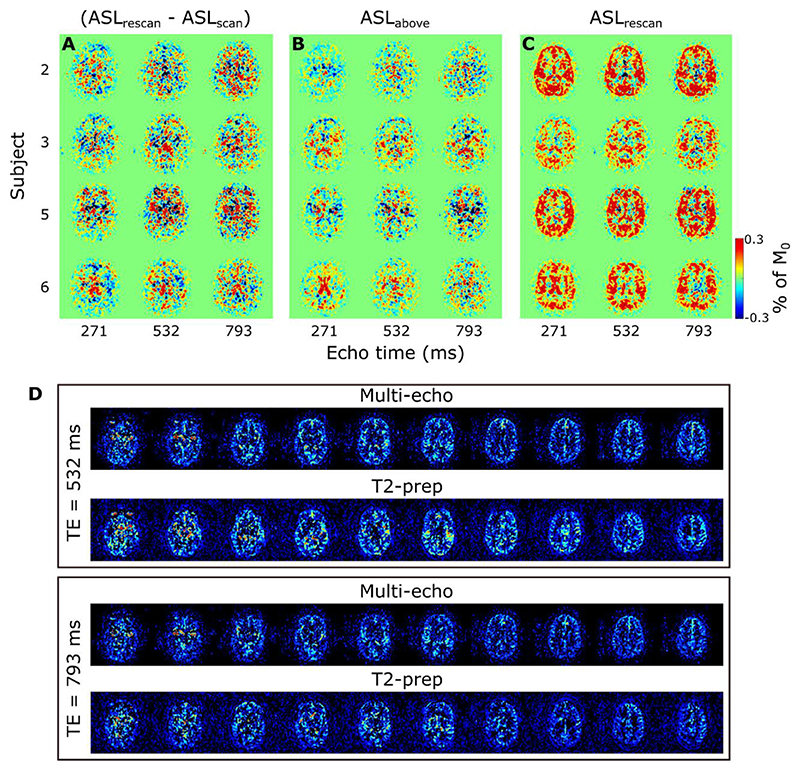
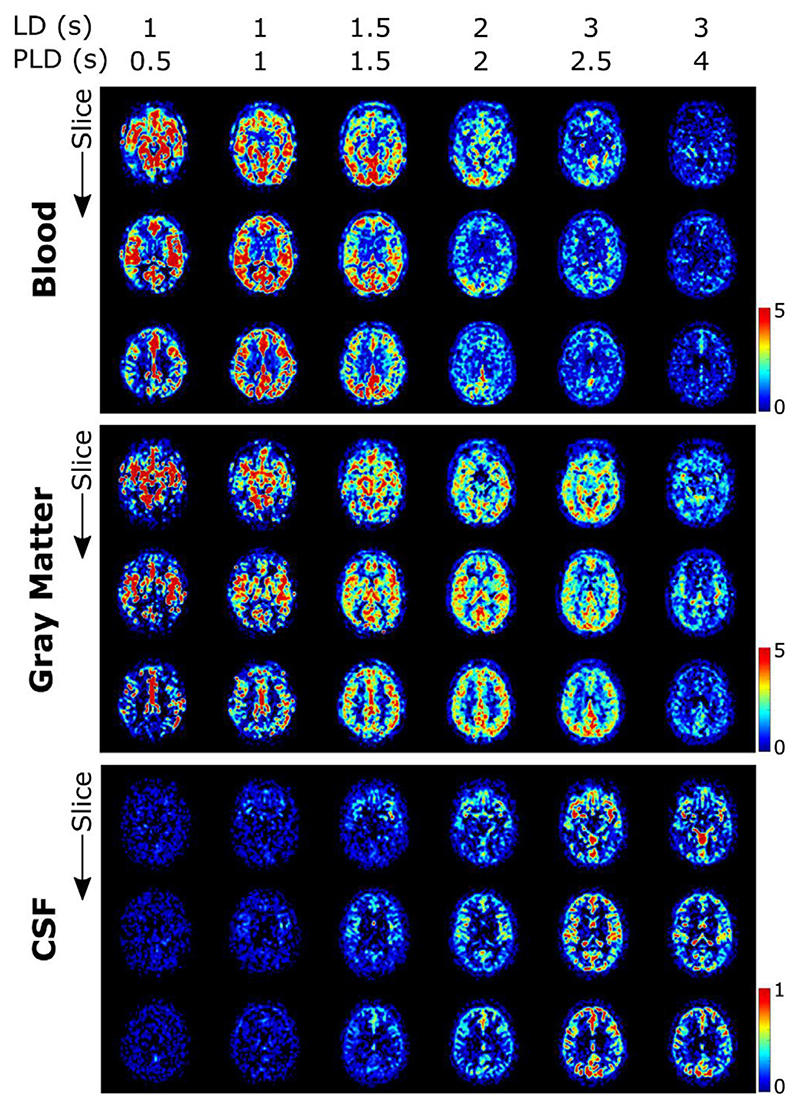
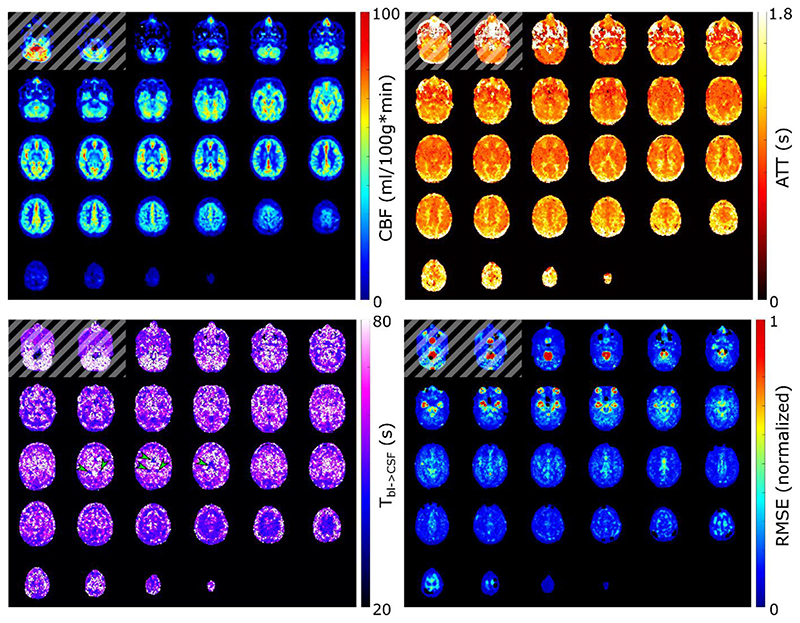
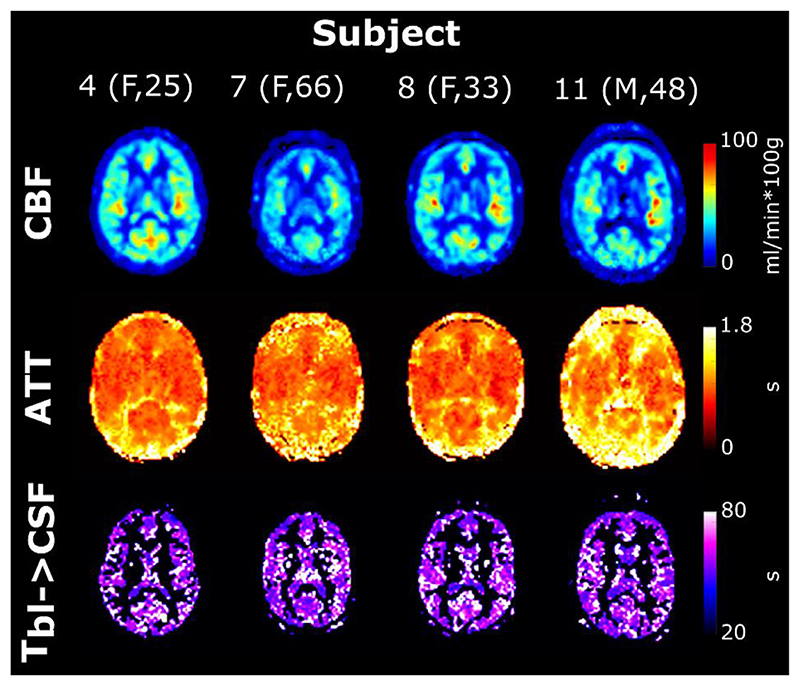
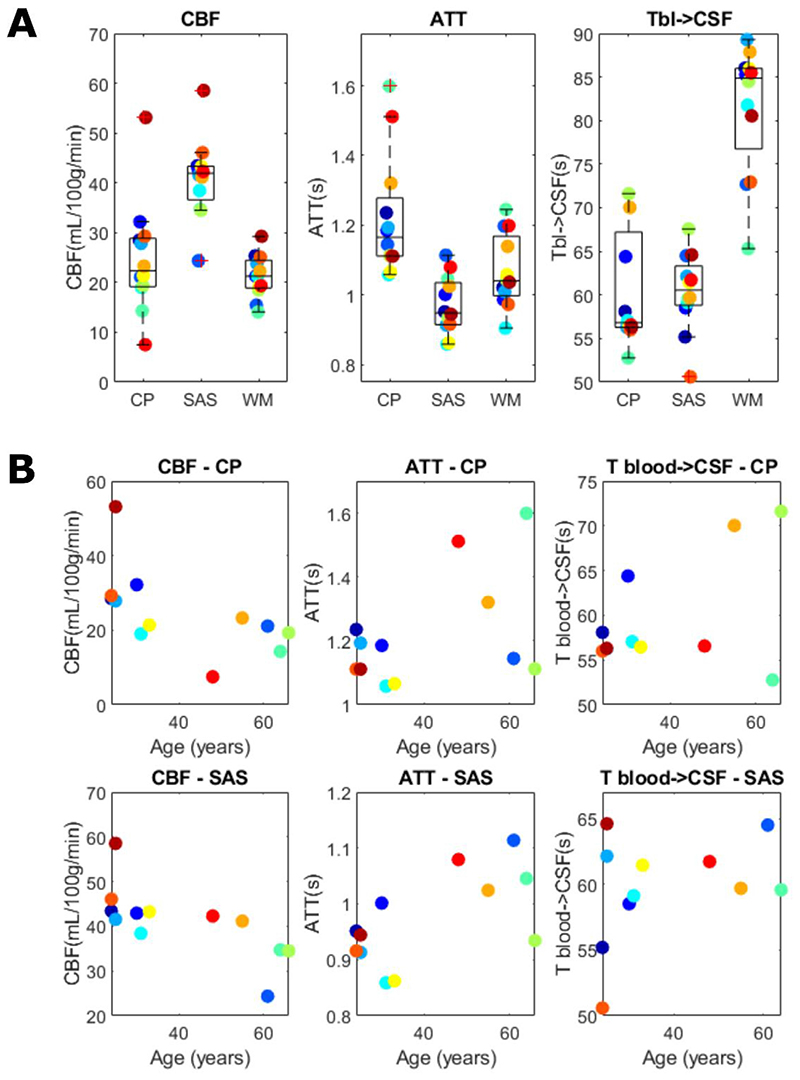
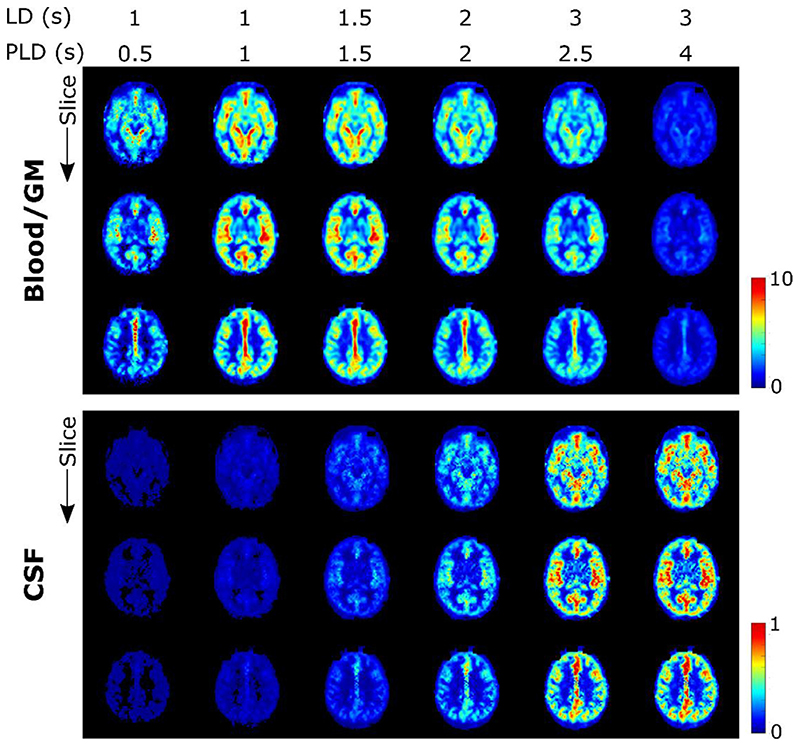
The study of brain clearance mechanisms is an active area of research. While we know that the cerebrospinal fluid (CSF) plays a central role in one of the main existing clearance pathways, the exact processes for the secretion of CSF and the removal of waste products from tissue are under debate. CSF is thought to be created by the exchange of water and ions from the blood, which is believed to mainly occur in the choroid plexus. This exchange has not been thoroughly studied in vivo. We propose a modified arterial spin labeling (ASL) MRI sequence and image analysis to track blood water as it is transported to the CSF, and to characterize its exchange from blood to CSF. We acquired six pseudo-continuous ASL sequences with varying labeling duration (LD) and post-labeling delay (PLD) and a segmented 3D-GRASE readout with a long echo train (8 echo times (TE)) which allowed separation of the very long-T2 CSF signal. ASL signal was observed at long TEs (793 ms and higher), indicating presence of labeled water transported from blood to CSF. This signal appeared both in the CSF proximal to the choroid plexus and in the subarachnoid space surrounding the cortex. ASL signal was separated into its blood, gray matter and CSF components by fitting a triexponential function with T2s taken from literature. A two-compartment dynamic model was introduced to describe the exchange of water through time and TE. From this, a water exchange time from the blood to the CSF (Tbl->CSF) was mapped, with an order of magnitude of approximately 60 s.

Keywords: Arterial spin labeling; Blood-csf barrier; Brain clearance; Dynamic compartmental modeling; Glymphatics; Neurofluids; Water transport.


Figures

Fig. 1
Fig. 1
Diagram of the multi-echo ASL sequence used in the main protocol of this study. Timings and gradient strengths are not drawn to scale.
Fig. 2
Fig. 2. Example of single-voxel data fitted to the triexponential model.
A shows the separation of the signal into three exponentials with T2 = 60 ms (GM), 150 ms (blood), and 1500 ms (CSF) for a single time point. B shows the fit to the sum of these three exponential components for all time points. Note that there are no error-bars as this dataset provided a single value for each voxel (any averaging over shots was done in image reconstruction).
Fig. 3
Fig. 3. Explanation of the compartmental model fitting procedure.
The schematic in A) represents the design and assumptions of the mathematical model, including the functions which describe the input (c(t)), exchange (rbl->CSF(t)) and decay (m(t)) of signal in and between compartments. B) shows the first fitting step: the data from the first echo time (TE = 10 ms) is fitted to a Buxton-type model to extract CBF and ATT. Then, as a final step (C) all 48 datapoints (for all PLD/TE combinations) are used as input in the two-compartment model to fit Tbl->CSF (with CBF and ATT fixed).
Fig. 4
Fig. 4. ASL signal and validation.
A) ASL signal from the multi-PLD protocol for subject 1 in a single slice at all inflow time points (left to right) and echo times (top to bottom). The first echo is shown in a different scale for better visualization. In B the last column of A is repeated with the inclusion of negative signal for comparison to the validation scans. The arrowhead points to the choroid plexus (present in all images but especially visible at this time point in the perfusion image). C shows the ASL signal of the reproducibility scan (note that images are not co-registered and therefore slices may not correspond perfectly) and D shows the signal with the labeling plane above the brain.
Fig. 5
Fig. 5
ASL signal differences between the reproducibility scans (a), the scan labeled above the brain (b), and the actual measured signal (c), in a single slice at three TEs for all four subjects who underwent the validation scan session. Values are shown as a percentage of the average M0 (calculated separately for each echo). D shows the results of the T2-prep experiment, for LD/PLD = 3/2.5 s, comparing the signal in ten central slices at TE = 532 ms and TE = 793 ms for the multi-echo readout, vs the single-echo readout with T2-prep adjusted to reproduce the same echo times.
Fig. 6
Fig. 6
Results of triexponential fit in subject 1. The signal originating from each of the three compartments is shown separately (note that because the CSF signal is much lower, a different scale is used). Maps are given for three slices, one intersecting the circle of Willis (top), one intersecting the choroid plexus (middle) and one higher in the brain (bottom). Different time points are shown with increasing LD/PLD from left to right.
Fig. 7
Fig. 7
Whole brain maps of CBF, ATT, Tbl->Csf, and RMSE (root-mean-square error of the residuals for echoes 3–8) for subject 1 obtained using the dynamic compartmental model fit. Note that the ASL labeling plane intersects with the bottom of the imaging volume, resulting in erroneous values in the lower slice(s) (shown with a striped overlay). The RMSE is normalized to the same scale as the long-echo ASL signal of Fig. 3a. Arrowheads point to the choroid plexus in the Tbl->CSF map.
Fig. 8
Fig. 8
Single-slice parameter maps for four subjects with variable age and sex. Tbl-> CSF is shown only in the gray matter and CSF masks for easier visualization (white matter areas are particularly noisy).
Fig. 9
Fig. 9
Dynamic compartmental model parameter averages per subject for (a) the choroid plexus (CP), subarachnoid space (SAS) and white matter (WM) ROIs and (b) plotted as a function of age for the CP and SAS ROIs.
Fig. 10
Fig. 10
Reconstructed blood (+GM) and CSF fractions from the fitted parameters of Fig. 7, simulating the signal at all experiment time points for an artificial echo time of 0 ms. Note the different scaling of the CSF fraction.

Similar articles

Cited by

References

    1. Iliff JJ, et al. A paravascular pathway facilitates CSF flow through the brain parenchyma and the clearance of interstitial solutes, including amyloid β. Sci Transl Med. 2012;4 - PMC - PubMed
    1. Albargothy NJ, et al. Convective influx/glymphatic system: tracers injected into the CSF enter and leave the brain along separate periarterial basement membrane pathways. Acta Neuropathol. 2018;136:139–152. - PMC - PubMed
    1. Liu G, et al. Direct Measurement of Cerebrospinal Fluid Production in Mice. Cell Rep. 2020;33:108524. - PMC - PubMed
    1. Mestre H, et al. Flow of cerebrospinal fluid is driven by arterial pulsations and is reduced in hypertension. Nat Commun. 2018;9 - PMC - PubMed
    1. Mestre H, Mori Y, Nedergaard M. The Brain’s glymphatic system: current controversies. Trends Neurosci. 2020;43:458–466. - PMC - PubMed

Publication types