. 2022 Feb;24(2):112-119.
doi: 10.1016/j.jmoldx.2021.10.010. Epub 2021 Nov 23.

SARS-CoV-2 RT-qPCR Test Detection Rates Are Associated with Patient Age, Sex, and Time since Diagnosis

Affiliations

SARS-CoV-2 RT-qPCR Test Detection Rates Are Associated with Patient Age, Sex, and Time since Diagnosis

Matan Levine-Tiefenbrun et al. J Mol Diagn. 2022 Feb.

Abstract

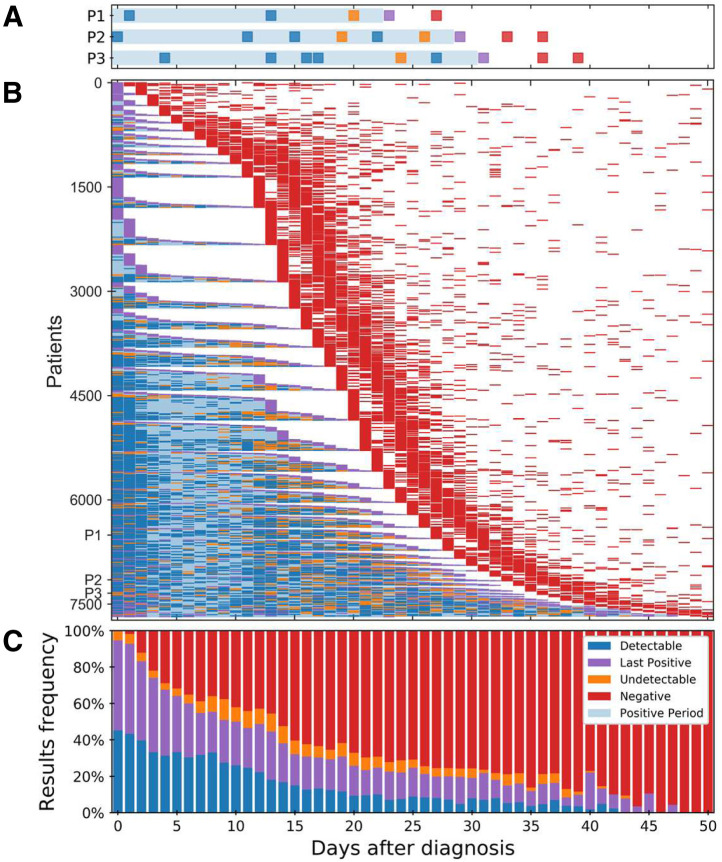
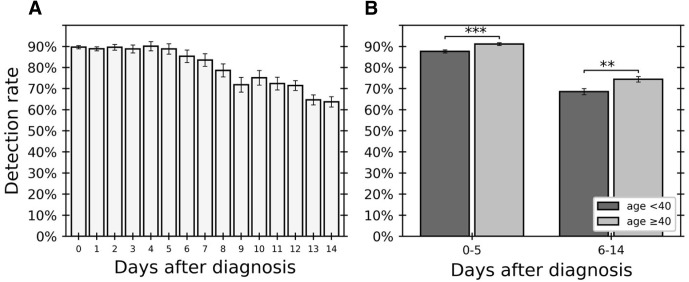
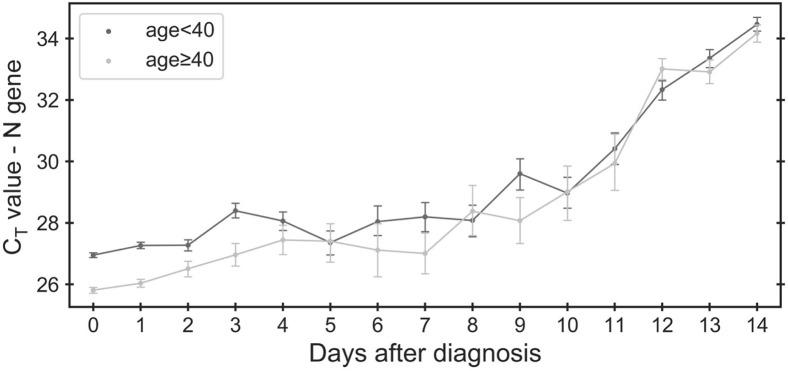
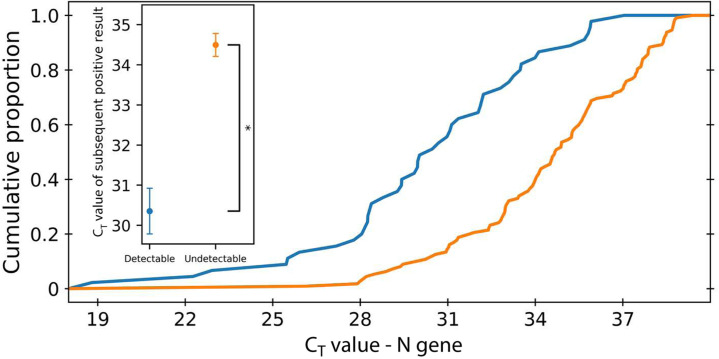
Quantifying the detection rate of the widely used quantitative RT-PCR (RT-qPCR) test for severe acute respiratory syndrome coronavirus 2 and its dependence on patient demographic characteristics and disease progression is key in designing epidemiologic strategies. Analyzing 843,917 test results of 521,696 patients, a "positive period" was defined for each patient between diagnosis of coronavirus disease 2019 and the last positive test result. The fraction of positive test results within this period was then used to estimate detection rate. Regression analyses were used to determine associations of detection with time of sampling after diagnosis, patient demographic characteristics, and viral RNA copy number based on RT-qPCR cycle threshold values of the next positive test result. The overall detection rate in tests performed within 14 days after diagnosis was 83.1%. This rate was higher at days 0 to 5 after diagnosis (89.3%). Furthermore, detection rate was strongly associated with age and sex. Finally, the detection rate with the Allplex 2019-nCoV RT-qPCR kit was associated, at the single-patient level, with viral RNA copy number (P < 10-9). These results show that the reliability of the test result is reduced in later days as well as for women and younger patients, in whom the viral loads are typically lower.


Figures

Figure 1
Figure 1
Longitudinal quantitative RT-PCR severe acute respiratory syndrome coronavirus 2 test results for patients diagnosed with coronavirus disease 2019. A: Test results for three representative patients (P1, P2, and P3). The day of diagnosis and the last positive test result (purple) demarcate the “positive period” (light blue shading). Negative test results within this individually determined period were regarded as “undetectable” (orange). Similarly, positive test results within the positive period were regarded as detectable (blue). All test series end with a sequence of one or more negative results (red). B: Longitudinal severe acute respiratory syndrome coronavirus 2 test results for the study population (Table 1). [For clarity, 191 patients for whom the first negative sample (red) was obtained >50 days after the day of diagnosis were omitted.] Patients are sorted according to the dates, relative to diagnosis, of their first negative result, then by the relative date of the last positive result. C: Frequency of test results per day relative to diagnosis.
Figure 2
Figure 2
Detection rate changes along time after day of diagnosis and differs between age groups. Detection rate per day after diagnosis was calculated for 6190 tests. A: Daily detection rate for days between day of diagnosis (day 0) to 14 days after diagnosis. B: Difference in detection rate between two age groups (<40 years and ≥40 years [dark and light gray, respectively]) calculated separately for early and late days after diagnosis. Fisher’s exact test (as discussed in Differences in Detection Rate between Age Groups) was used. Error bars indicate SD. ∗∗P < 0.01, ∗∗∗P < 0.001.
Figure 3
Figure 3
Differential change in cycle threshold (CT) value of the N gene along time after day of diagnosis for different age groups. In the first 4 days after diagnosis, CT values of the N gene are lower for older patients (age ≥40 years, light gray) than for younger patients (age <40 years, dark gray). Error bars indicate SEM.
Figure 4
Figure 4
Difference between cycle threshold (CT) values of the N gene of positive results after undetectable and detectable test. Positive test results that followed an undetectable test result have a higher Ct value than positive test results after undetectable test results. Error bars indicate SEM. ∗P < 10−10.

References

    1. Bisoffi Z., Pomari E., Deiana M., Piubelli C., Ronzoni N., Beltrame A., Bertoli G., Riccardi N., Perandin F., Formenti F., Gobbi F., Buonfrate D., Silva R. Sensitivity, specificity and predictive values of molecular and serological tests for COVID-19: a longitudinal study in emergency room. Diagnostics (Basel) 2020;10:669. - PMC - PubMed
    1. Pfefferle S., Reucher S., Nörz D., Lütgehetmann M. Evaluation of a quantitative RT-PCR assay for the detection of the emerging coronavirus SARS-CoV-2 using a high throughput system. Euro Surveill. 2020;25:2000152. - PMC - PubMed
    1. Wu S.L., Mertens A.N., Crider Y.S., Nguyen A., Pokpongkiat N.N., Djajadi S., Seth A., Hsiang M.S., Colford J.M., Jr., Reingold A., Arnold B.F., Hubbard A., Benjamin-Chung J. Substantial underestimation of SARS-CoV-2 infection in the United States. Nat Commun. 2020;11:4507. - PMC - PubMed
    1. Wölfel R., Corman V.M., Guggemos W., Seilmaier M., Zange S., Müller M.A., Niemeyer D., Jones T.C., Vollmar P., Rothe C., Hoelscher M., Bleicker T., Brünink S., Schneider J., Ehmann R., Zwirglmaier K., Drosten C., Wendtner C. Virological assessment of hospitalized patients with COVID-2019. Nature. 2020;581:465–469. - PubMed
    1. Xie X., Zhong Z., Zhao W., Zheng C., Wang F., Liu J. Chest CT for typical coronavirus disease 2019 (COVID-19) pneumonia: relationship to negative RT-PCR testing. Radiology. 2020;296:E41–E45. - PMC - PubMed