. 2021 Nov 15;10(11):1185.
doi: 10.3390/biology10111185.

A Predictive Model for Severe COVID-19 in the Medicare Population: A Tool for Prioritizing Primary and Booster COVID-19 Vaccination

Affiliations

A Predictive Model for Severe COVID-19 in the Medicare Population: A Tool for Prioritizing Primary and Booster COVID-19 Vaccination

Bettina Experton et al. Biology (Basel). .

Abstract

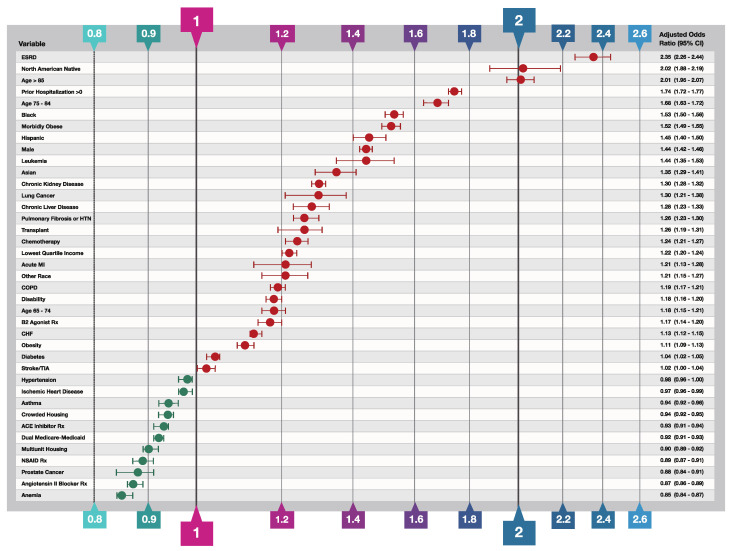
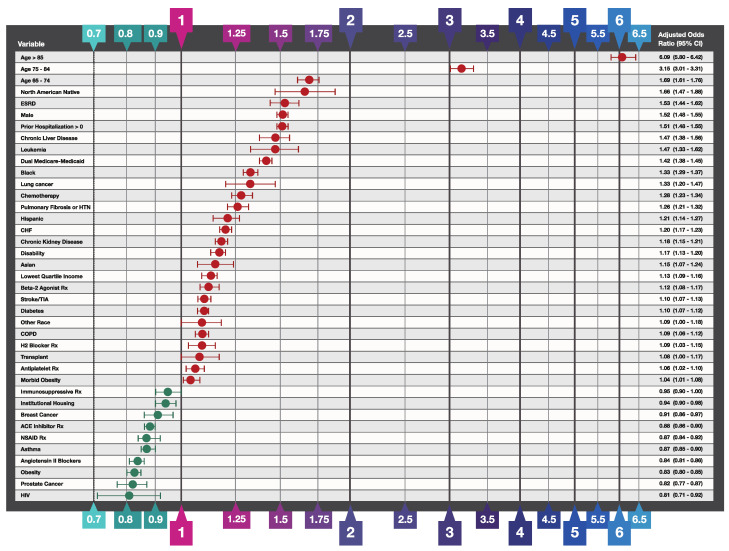
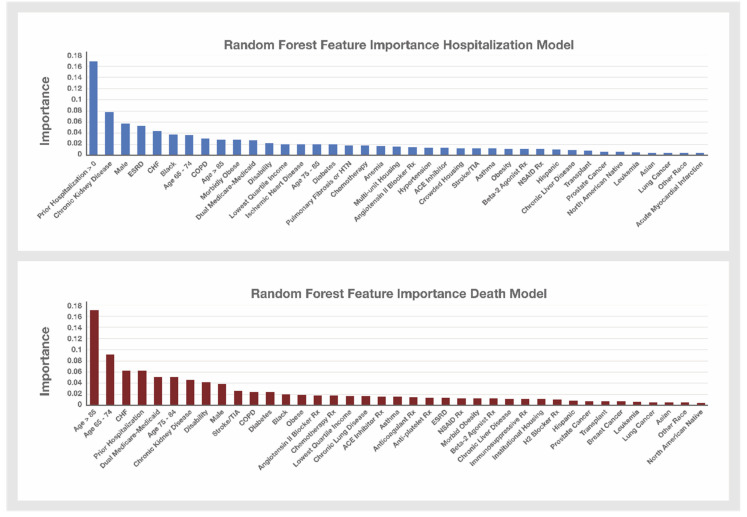
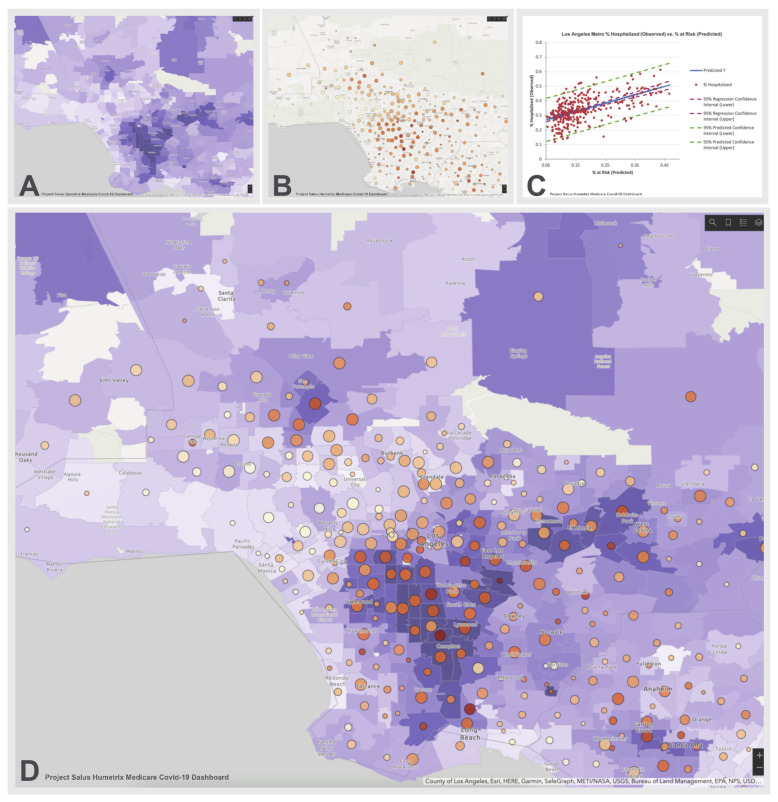
Recommendations for prioritizing COVID-19 vaccination have focused on the elderly at higher risk for severe disease. Existing models for identifying higher-risk individuals lack the needed integration of socio-demographic and clinical risk factors. Using multivariate logistic regression and random forest modeling, we developed a predictive model of severe COVID-19 using clinical data from Medicare claims for 16 million Medicare beneficiaries and socio-economic data from the CDC Social Vulnerability Index. Predicted individual probabilities of COVID-19 hospitalization were then calculated for population risk stratification and vaccine prioritization and mapping. The leading COVID-19 hospitalization risk factors were non-white ethnicity, end-stage renal disease, advanced age, prior hospitalization, leukemia, morbid obesity, chronic kidney disease, lung cancer, chronic liver disease, pulmonary fibrosis or pulmonary hypertension, and chemotherapy. However, previously reported risk factors such as chronic obstructive pulmonary disease and diabetes conferred modest hospitalization risk. Among all social vulnerability factors, residence in a low-income zip code was the only risk factor independently predicting hospitalization. This multifactor risk model and its population risk dashboard can be used to optimize COVID-19 vaccine allocation in the higher-risk Medicare population.

Keywords: COVID-19 booster vaccine; COVID-19 vaccine booster prioritization; COVID-19 vaccine prioritization; Medicare population; risk for severe COVID-19 infection; severe COVID-19 disease; severe COVID-19 risk model.


Conflict of interest statement

Bettina Experton, Adrien Elena, Christopher Hein, Blake Schwendiman and Chris Burrow of Humetrix disclose the following potential conflict of interest: this manuscript reports findings of a study conducted by Humetrix with funding from the Johns Hopkins University Applied Physics Laboratory under a prime contract with the Department of Defense Joint Artificial Intelligence Center. Nicole Lurie, Hassan Tetteh, and Peter Walker have no conflict of interest to disclose. Justin Vincent of Amazon Web Services (AWS), discloses the following potential conflict of interest: AWS received fees for professional services rendered by Justin Vincent of AWS for ECS Federal LLC, part of ASGN Federal Incorporated, under a prime contract of the Department of Defense Joint Artificial Intelligence Center.

Figures

Figure 1
Figure 1
Predictor Variables for COVID-19-Related Hospitalization. The independent variable odds ratios were determined by binary logistic regression analysis of confirmed COVID-19 cases that required hospitalization for the disease versus those that were managed with outpatient care only. In addition to the thirty-nine variables shown in the figure, the following variables were included in the model and survived the variable selection procedure described in Methods but are not shown: colorectal cancer (OR 1.07; 95% CI 1.01–1.14), endometrial cancer in the second half of 2019 (OR 1.12; 95% CI 1.00–1.25), other ethnicity (OR 1.19; 95% CI 1.13–1.25), unknown ethnicity (OR 0.96; 95% CI 0.91–1.00), prescriptions overlapping the COVID-19 diagnosis date of Azithromycin (OR 1.15; 95% CI 1.11–1.18), Chloroquine and Hydroxychloroquine drugs (OR 0.96; 95% CI 0.91–1.01), anticoagulant drugs (OR 1.06; 95% CI 1.04–1.08), opioid drugs (OR 1.03; 95% CI 1.01–1.05) and H2 blocker drugs (OR 1.03; 95% CI 0.99–1.06); Variables excluded from the model by the variable selection procedure included a history breast cancer in the second half of 2019, prescriptions for immunosuppressive and corticosteroid drugs overlapping the COVID-19 diagnosis date, hypertension and pneumococcal vaccinations. B2 Agonist Rx signifies treatment with a beta-2 bronchodilator drug; NSAID Rx signifies treatment with a Non-Steroidal Anti-Inflammatory Drug.
Figure 2
Figure 2
Predictor Variables for COVID-19-Related Death. The independent variable odds ratios were determined by binary logistic regression analysis of confirmed COVID-19 cases that survived versus those that died within 60 days of COVID-19 diagnosis. In addition to, the thirty-nine variables shown in the figure, the following variables were included in the model and survived the variable selection procedure described in Methods but are not shown: prescriptions filled with sufficient quantity to overlap the COVID-19 diagnosis date: Azithromycin (OR 1.18; 95% CI 1.13–1.23), chloroquine and hydroxychloroquine drugs (OR 1.22; 95% CI 1.13–1.23), unknown race (OR 0.88; 95% CI 0.80–0.96). Odds ratios for anemia and prescriptions for anticoagulant drugs and corticosteroids had regression coefficient p values > 0.05 and are not shown. Variables excluded from the model by the variable selection procedure include a history of colorectal cancer and endometrial cancer, or acute MI between July and December 2019, ischemic heart disease, hypertension, residence in zip codes in the top quartile of crowded housing or multiunit housing, and prescriptions for opioid drugs. NSAID Rx signifies treatment with a Non-Steroidal Anti-Inflammatory Drug.
Figure 3
Figure 3
Random Forest Hospitalization and Death Model Feature Importance. Variables that were selected for inclusion in the Hospitalization and Death logistic regression models were used to build these two random forest models. The Feature Importance values for the variables not shown in the Hospitalization model graph are: prescriptions filled with sufficient quantity to overlap the COVID-19 diagnosis date for Azithromycin (FI 0.0104), Chloroquine and Hydroxychloroquine drugs (FI 0.0056), anticoagulant drugs (FI 0.0129), antiplatelet drugs (FI 0.0105), corticosteroids (FI 0.0118), and immunosuppressive drugs (FI 0.100); endometrial cancer (FI 0.002) or breast cancer (FI 0.006) between July and December 2019; unknown race (FI 0.0039) and HIV (FI 0.0045). The Feature Importance values for the variables not shown in the Death model graph include: prescriptions filled with sufficient quantity to overlap the COVID-19 diagnosis date for Azithromycin (FI 0.0107), Chloroquine and Hydroxychloroquine drugs (FI 0.0065), corticosteroids (FI 0.0134), anemia (FI 0.0189), unknown race (FI 0.004) and HIV (FI 0.0037).
Figure 4
Figure 4
Los Angeles COVID-19 Hospitalization Risk Map. Panel A shows the percentage of the Salus cohort with a predicted probability of hospitalization when diagnosed with COVID-19 of over 0.55 on a light blue to dark lavender color scale. Panel B shows the cumulative number of hospitalizations per zip code (increasing size of circles denotes a higher hospitalization count) with the percentage of cases requiring hospitalization shown on a beige to dark orange scale. Panel C shows a linear regression analysis of the case hospitalization rate (Y axis) as a function of the risk level in each zip code (regression R2 = 0.35); Panel D is an overlay of panel B on Panel A and demonstrates that zip codes with the highest predicted probabilities of hospitalization with COVID-19 tend to have higher observed percentage of cases requiring hospitalization and vice versa.
Figure 5
Figure 5
COVID-19 Vaccine Prioritization Based on Risk of Severe COVID-19 Disease. The logistic regression model coefficients for the independent variables shown in Figure 1 were used to calculate the predicted probabilities of hospitalization in the Salus cohort. The distribution of predicted probabilities was split into five groups shown in the table of approximately 3 million beneficiaries each to enable stratification of the cohort by risk of severe disease to prioritize individuals for COVID-19 vaccination.

References

    1. Oliver S. Overview of Vaccine Equity and Prioritization Frameworks ACIP Meeting September 22, 2020. [(accessed on 19 October 2021)];2020 Centers for Disease Control and Prevention ACIP Covid-19 Vaccines Work Group. Available online: https://www.cdc.gov/vaccines/acip/meetings/downloads/slides-2020-09/COVI....
    1. Centers for Disease Control and Prevention COVID-19 Mortality Overview. [(accessed on 20 October 2021)];2021 Available online: https://www.cdc.gov/nchs/covid19/mortality-overview.htm.
    1. Centers for Disease Control and Prevention COVID-19 Information for Specific Groups of People updated April 20, 2021. [(accessed on 19 October 2021)];2021 Available online: https://www.cdc.gov/coronavirus/2019-ncov/need-extra-precautions/index.h....
    1. National Academies of Sciences, Engineering, and Medicine National Academies Release Framework for Equitable Allocation of a COVID-19 Vaccine for Adoption by HHS, State, Tribal, Local, and Territorial Authorities. 2020. [(accessed on 19 October 2021)]. ScienceDaily. Available online: wwwsciencedaily.com/releases/2020/10/201002111729.htm.
    1. Centers for Disease Control and Prevention CDC SVI 2018 Documentation. [(accessed on 19 October 2021)];2021 Available online: https://svi.cdc.gov/Documents/Data/2018_SVI_Data/SVI2018Documentation.pdf.

LinkOut - more resources