. 2021 Nov 22;11(11):1742.
doi: 10.3390/biom11111742.

β-Dystroglycan Restoration and Pathology Progression in the Dystrophic mdx Mouse: Outcome and Implication of a Clinically Oriented Study with a Novel Oral Dasatinib Formulation

Affiliations

β-Dystroglycan Restoration and Pathology Progression in the Dystrophic mdx Mouse: Outcome and Implication of a Clinically Oriented Study with a Novel Oral Dasatinib Formulation

Paola Mantuano et al. Biomolecules. .

Abstract

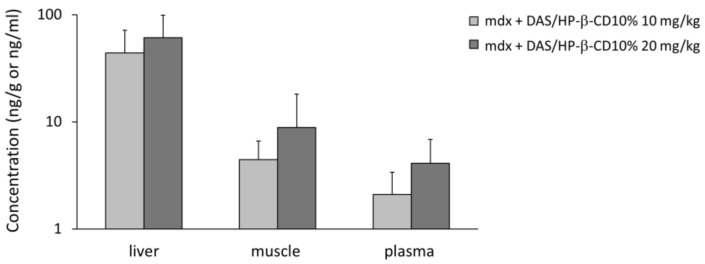
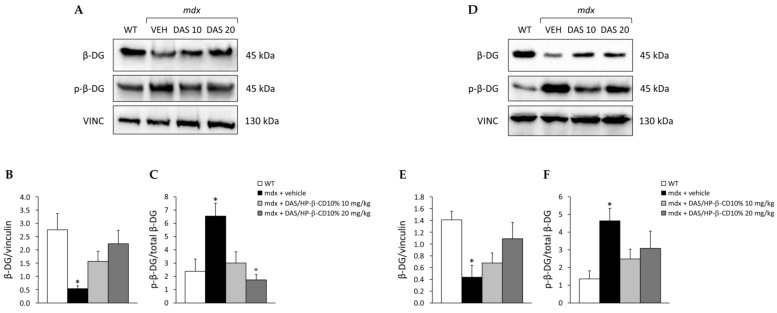
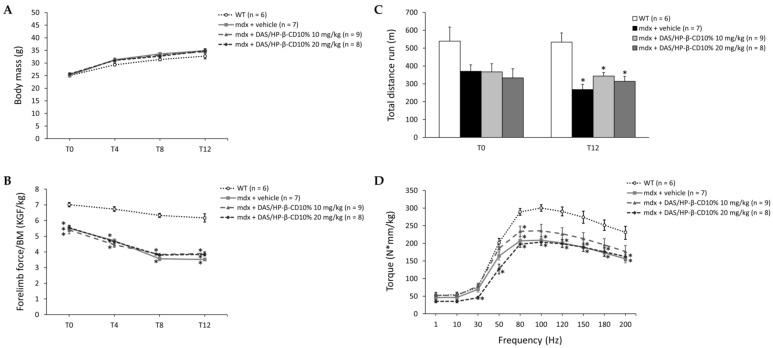
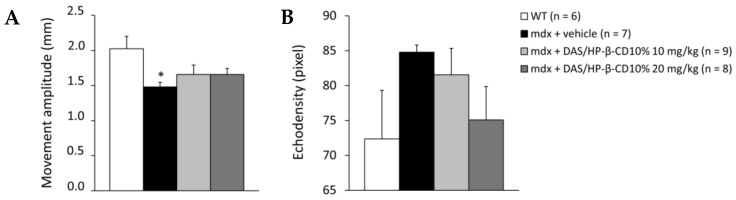
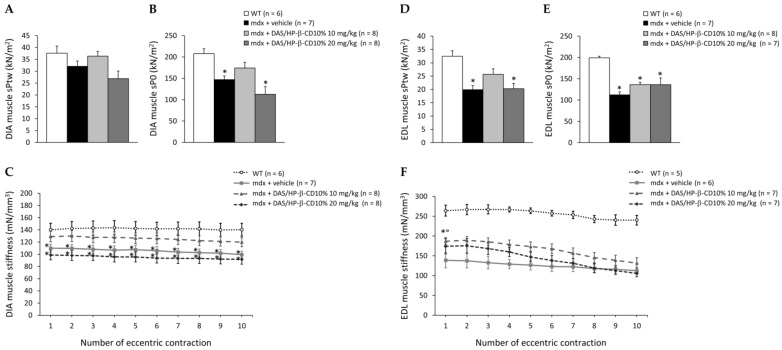
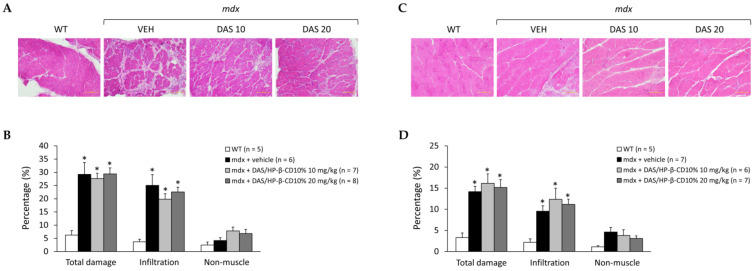
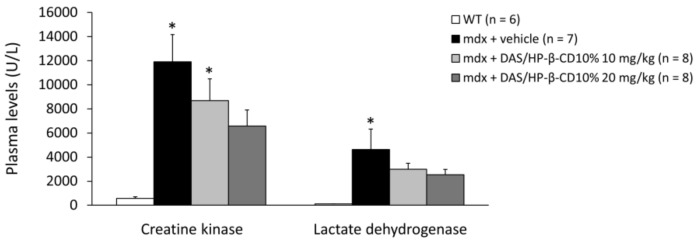
ROS-activated cSrc tyrosine kinase (TK) promotes the degradation of β-dystroglycan (β-DG), a dystrophin-glycoprotein complex component, which may reinforce damaging signals in Duchenne muscular dystrophy (DMD). Therefore, cSrc-TK represents a promising therapeutic target. In mdx mice, a 4-week subcutaneous treatment with dasatinib (DAS), a pan-Src-TKs inhibitor approved as anti-leukemic agent, increased muscle β-DG, with minimal amelioration of morphofunctional indices. To address possible dose/pharmacokinetic (PK) issues, a new oral DAS/hydroxypropyl(HP)-β-cyclodextrin(CD) complex was developed and chronically administered to mdx mice. The aim was to better assess the role of β-DG in pathology progression, meanwhile confirming DAS mechanism of action over the long-term, along with its efficacy and tolerability. The 4-week old mdx mice underwent a 12-week treatment with DAS/HP-β-CD10% dissolved in drinking water, at 10 or 20 mg/kg/day. The outcome was evaluated via in vivo/ex vivo disease-relevant readouts. Oral DAS/HP-β-CD efficiently distributed in mdx mice plasma and tissues in a dose-related fashion. The new DAS formulation confirmed its main upstream mechanism of action, by reducing β-DG phosphorylation and restoring its levels dose-dependently in both diaphragm and gastrocnemius muscle. However, it modestly improved in vivo neuromuscular function, ex vivo muscle force, and histopathology, although the partial recovery of muscle elasticity and the decrease of CK and LDH plasma levels suggest an increased sarcolemmal stability of dystrophic muscles. Our clinically oriented study supports the interest in this new, pediatric-suitable DAS formulation for proper exposure and safety and for enhancing β-DG expression. This latter mechanism is, however, not sufficient by itself to impact on pathology progression. In-depth analyses will be dedicated to elucidating the mechanism limiting DAS effectiveness in dystrophic settings, meanwhile assessing its potential synergy with dystrophin-based molecular therapies.

Keywords: Duchenne muscular dystrophy; cyclodextrin; dasatinib; mdx mouse; oral formulation; pediatric age; preclinical study.


Conflict of interest statement

The authors declare no conflict of interest.

Figures

Figure 1
Figure 1
The histogram shows the concentration of dasatinib detected in tissue (liver and quadriceps muscle, ng/g) and plasma samples (ng/mL) from mdx mice treated with DAS/HP-β-CD 10% oral formulation at the doses of 10 and 20 mg/kg. Values are expressed as mean ± SEM from n = 9 samples at 10 mg/kg and n = 8 samples at 20 mg/kg for each type of matrix. A base-10 log scale is used for the Y axis.
Figure 2
Figure 2
In (A,D) are shown representative Western blots for total β-dystroglycan (β-DG), phosphorylated (p-) β-DG, and reference standard vinculin (VINC) proteins, carried out in diaphragm (DIA) and gastrocnemius (GC) muscles, respectively. Total β-DG levels on VINC, and p-β-DG/β-DG ratio, are represented in (B,C) for DIA, and in (E,F) for GC muscle. Values are expressed as mean ± SEM obtained from WT mice (n = 4–6), and mdx mice treated with vehicle (VEH; n = 5–7), or DAS/HP-β-CD 10% at the dose of 10 (n = 7–9) or 20 (n = 6–8) mg/kg. For DIA muscle, a statistically significant difference among groups was found by one-way ANOVA for β-DG/vinculin (B); F = 3.6, p < 0.03 and p-β-DG/β-DG ratio (C); F = 5.5, p < 0.007. Bonferroni post hoc test for individual differences between groups is as follows: * vs. WT (p < 0.03), ° vs. mdx + vehicle (p < 0.006). For GC muscle, a statistically significant difference among groups was found by one-way ANOVA for β-DG/vinculin (E); F = 3.8, p < 0.02 and p-β-DG/β-DG ratio (F); F = 3.2, p < 0.05. Bonferroni post hoc test for individual differences between groups is as follows: * vs. WT (p < 0.05); N.S. vs. mdx + vehicle (p > 0.05).
Figure 3
Figure 3
In (A,B) are shown the variations in body mass (BM, g; (A)) and maximal forelimb grip strength normalized to BM (KGF/kg; (B)) at time points T0, T4, T8, and T12 for all mice cohorts (WT mice, and mdx mice treated with vehicle, or DAS/HP-β-CD 10% at the dose of 10 or 20 mg/kg). Values are expressed as mean ± SEM from the number of mice indicated in brackets. For (B), a statistically significant difference among groups was found by one-way ANOVA at all time points (F > 12.81, p < 0.0001). Bonferroni post hoc test for individual differences between groups is as follows: * vs. WT (0.0001 < p < 0.0002); N.S. vs. mdx + vehicle (p > 0.05). In (C) are shown the results from an exhaustion test on the treadmill, expressed as total distance run (m) during the test carried out both at T0 and T12 on all mice cohorts. Values are expressed as mean ± SEM from the number of mice indicated in brackets. A statistically significant difference among groups was found by one-way ANOVA at T12 (F = 12, p < 0.0001). Bonferroni post hoc test for individual differences between groups is as follows: * vs. WT (0.0001 < p < 0.002); N.S. vs. mdx + vehicle (p > 0.05). In (D) are shown the values of hind limb plantar flexor torque (N*mm/kg) produced at increasing stimulation frequencies (from 1 to 200 Hz), obtained in anesthetized mice from each cohort at T12. Values are expressed as mean ± SEM from the number of mice indicated in brackets. A statistically significant difference among groups was found by one-way ANOVA in the range of frequencies from 30 to 200 Hz (F > 5.04, p < 0.007). Bonferroni post hoc test for individual differences between groups is as follows: * vs. WT (0.0001 < p < 0.04); N.S. vs. mdx + vehicle (p > 0.05).
Figure 4
Figure 4
The histograms show diaphragm movement amplitude (mm; (A)) and pixel echodensity (B), measured by ultrasonography performed at T12 on all mice cohorts (WT mice, and mdx mice treated with vehicle, or DAS/HP-β-CD 10% at the dose of 10 or 20 mg/kg). Values are expressed as mean ± SEM from the number of mice indicated in brackets. For (A), a statistically significant difference among groups was found by one-way ANOVA (F = 3.1, p = 0.043). Bonferroni post hoc test for individual differences between groups is as follows: * vs. WT (p < 0.04); N.S. vs. mdx + vehicle (p > 0.05).
Figure 5
Figure 5
In (AC) are shown ex vivo maximal specific isometric twitch (sPtw, kN/m2; (A)) and tetanic (sP0, kN/m2; (B) force values, and elastic properties in response to a series of 10 eccentric pulses (stiffness, mN/mm3; (C)), obtained in DIA muscle for all mice cohorts (WT mice, and mdx mice treated with vehicle, or DAS/HP-β-CD 10% at the dose of 10 or 20 mg/kg). Values are expressed as mean ± SEM from the number of mice indicated in brackets. A statistically significant difference among groups was found by one-way ANOVA for both (A) (F = 3.4, p = 0.03) and (B) (F = 8.3, p = 0.0005). Bonferroni post hoc test for individual differences between groups is as follows: * vs. WT (0.0004 < p < 0.04); N.S. vs. mdx + vehicle (p > 0.05). For (C), a statistically significant difference in muscle stiffness among groups was found at each pulse by one-way ANOVA (F > 4.87, p < 0.008). Bonferroni post hoc test for individual differences between groups is as follows: * vs. WT (0.002 < p < 0.05); N.S. vs. mdx + vehicle (p > 0.05). For EDL muscle, the same parameters are shown in (D) (sPtw), (E) (sP0), and (F) (stiffness). Values are expressed as mean ± SEM from the number of mice indicated in brackets for each experimental group. A statistically significant difference among groups was found by one-way ANOVA for both (D) (F = 8.5, p = 0.0005) and (E) (F = 14.6, p < 0.0001). Bonferroni post hoc test for individual differences between groups is as follows: * vs. WT (0.0001 < p < 0.001); N.S. vs. mdx + vehicle (p > 0.05). For (F), statistically significant difference in muscle stiffness among groups was found at each pulse by one-way ANOVA (F > 13.52, p < 0.0001). Bonferroni post hoc test for individual differences between groups is as follows: * vs. WT (0.0001 < p < 0.0007); ° vs. mdx + vehicle (0.0009 < p < 0.01).
Figure 6
Figure 6
In (A,C) are shown representative DIA (A) and GC (C) muscle sections stained with hematoxylin and eosin (20× magnification) from mice of each experimental group (WT mice, and mdx mice treated with vehicle—VEH—or DAS/HP-β-CD 10% at the dose of 10 or 20 mg/kg). This staining allows to appreciate the organization of skeletal muscle architecture and its typical alterations in dystrophin-deficient muscles, including the presence of abnormal inflammatory infiltrates or non-muscle (i.e., fibrotic and adipose tissue) areas, quantified via subsequent morphometric analysis, as shown by histograms in (B) for DIA and (D) for GC muscle. Values are expressed as mean ± SEM from the number of mice indicated in brackets. (B) A statistically significant difference among groups was found by one-way ANOVA for total damage (F = 11, p = 0.0002) and infiltration (F = 10, p = 0.0003). Bonferroni post hoc test for individual differences between groups is as follows: * vs. WT (0.0002 < p < 0.004); N.S. vs. mdx + vehicle (p > 0.05). (D) A statistically significant difference among groups was found by one-way ANOVA for total damage (F = 6.5, p = 0.003) and infiltration (F = 4.2, p = 0.02). Bonferroni post hoc test for individual differences between groups is as follows: * vs. WT (0.006 < p < 0.04); N.S. vs. mdx + vehicle (p > 0.05).
Figure 7
Figure 7
The histogram shows the levels of enzymes creatine kinase (CK) and lactate dehydrogenase (LDH) (U/L), measured in plasma samples collected from mice of each experimental group (WT mice, and mdx mice treated with vehicle, or DAS/HP-β-CD 10% at the dose of 10 or 20 mg/kg). Values are expressed as mean ± SEM from the number of mice indicated in brackets. A statistically significant difference among groups was found by one-way ANOVA for CK (F = 7.4, p = 0.001) and LDH (F = 3.8, p = 0.02). Bonferroni post hoc test for individual differences between groups is as follows: * vs. WT (0.0007 < p < 0.02); N.S. vs. mdx + vehicle (p > 0.05).

References

    1. Crisafulli S., Sultana J., Fontana A., Salvo F., Messina S., Trifirò G. Global epidemiology of Duchenne muscular dystrophy: An updated systematic review and meta-analysis. Orphanet J. Rare Dis. 2020;15:141. doi: 10.1186/s13023-020-01430-8. - DOI - PMC - PubMed
    1. Duan D., Goemans N., Takeda S., Mercuri E., Aartsma-Rus A. Duchenne muscular dystrophy. Nat. Rev. Dis. Primers. 2021;7:13. doi: 10.1038/s41572-021-00248-3. - DOI - PMC - PubMed
    1. Birnkrant D.J., Bushby K., Bann C.M., Apkon S.D., Blackwell A., Brumbaugh D., Case L.E., Clemens P.R., Hadjiyannakis S., Pandya S., et al. DMD Care Considerations Working Group. Diagnosis and management of Duchenne muscular dystrophy, part 1: Diagnosis, and neuromuscular, rehabilitation, endocrine, and gastrointestinal and nutritional management. Lancet Neurol. 2018;17:251–267. doi: 10.1016/S1474-4422(18)30024-3. - DOI - PMC - PubMed
    1. Moore C.J., Winder S.J. The inside and out of dystroglycan post-translational modification. Neuromuscul. Disord. 2012;22:959–965. doi: 10.1016/j.nmd.2012.05.016. - DOI - PubMed
    1. Mantuano P., Sanarica F., Conte E., Morgese M.G., Capogrosso R.F., Cozzoli A., Fonzino A., Quaranta A., Rolland J.F., De Bellis M., et al. Effect of a long-term treatment with metformin in dystrophic mdx mice: A reconsideration of its potential clinical interest in Duchenne muscular dystrophy. Biochem. Pharmacol. 2018;154:89–103. doi: 10.1016/j.bcp.2018.04.022. - DOI - PubMed

MeSH terms

LinkOut - more resources