. 2021 Oct 30;12(11):1747.
doi: 10.3390/genes12111747.

m6A mRNA Methylation Regulates LKB1 to Promote Autophagy of Hepatoblastoma Cells through Upregulated Phosphorylation of AMPK

Affiliations

m6A mRNA Methylation Regulates LKB1 to Promote Autophagy of Hepatoblastoma Cells through Upregulated Phosphorylation of AMPK

Guohui Li et al. Genes (Basel). .

Erratum in

Abstract

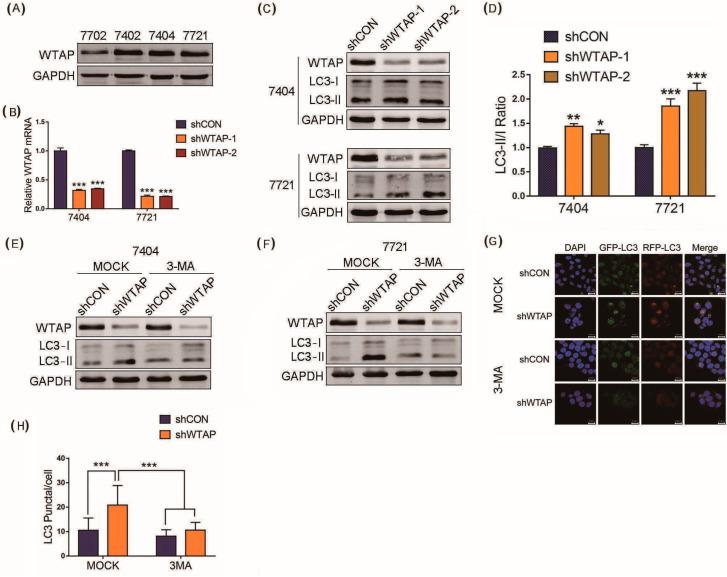
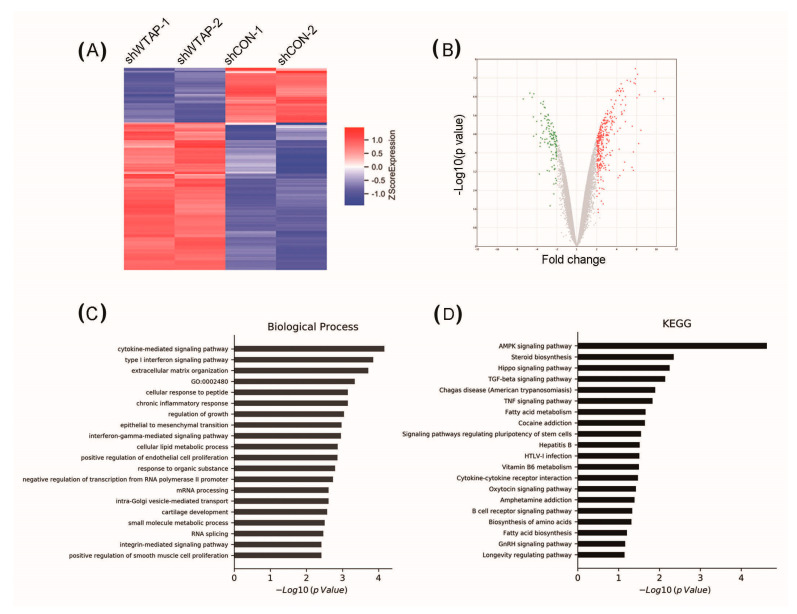
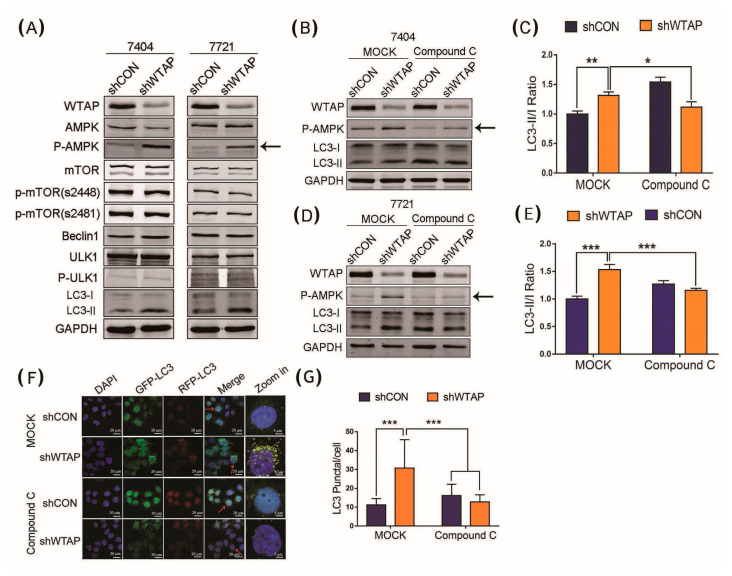
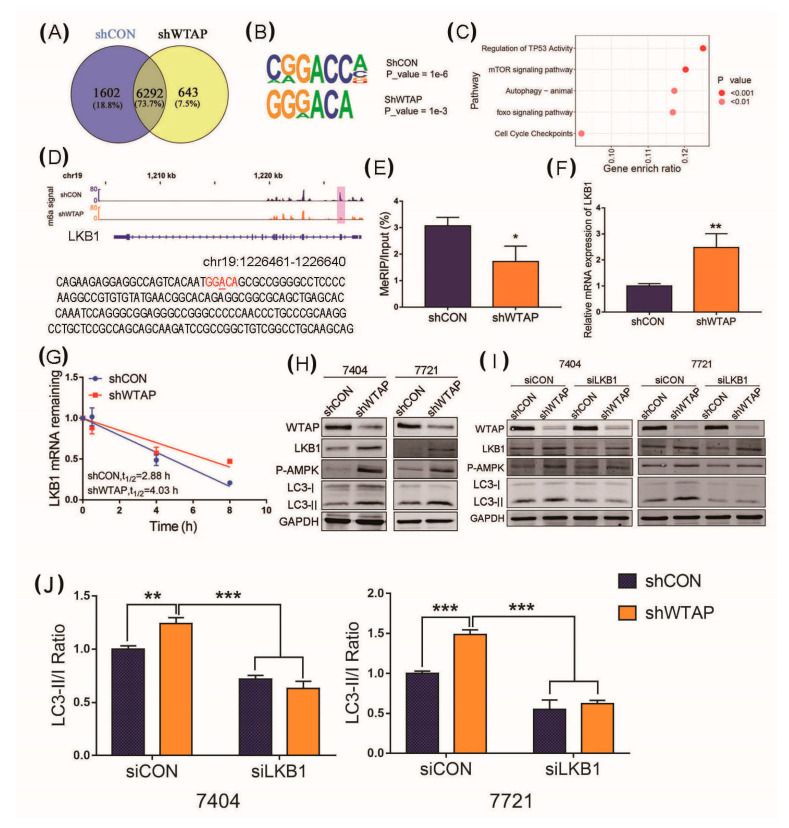
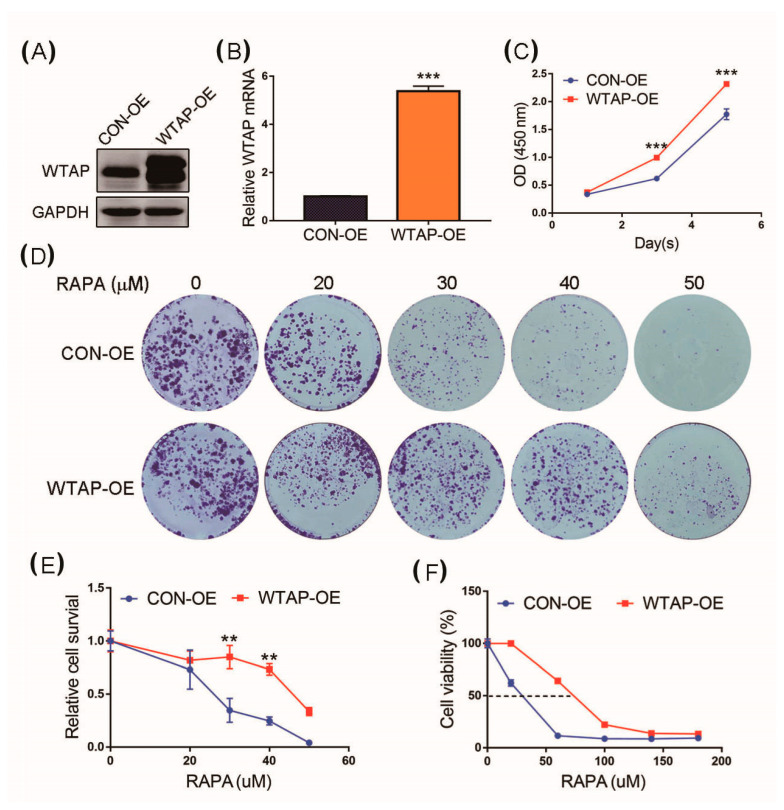
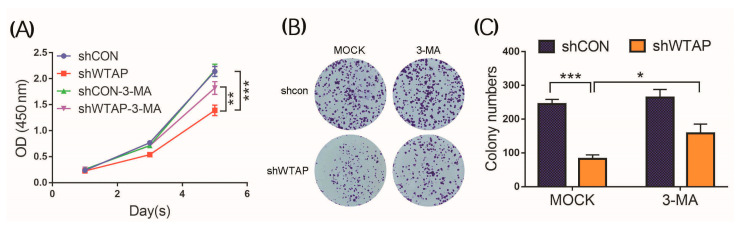
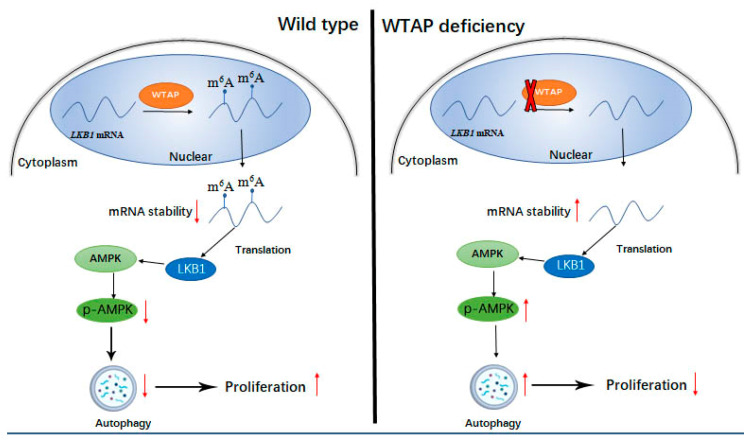
The N6-methyladenosine (m6A) RNA modification can regulate autophagy to modulate the growth and development of tumors, but the mechanism of m6A modification for the regulation of autophagy in hepatocellular carcinoma cells (HCC) remains unclear. In the study, the knockdown of the Wilms' tumor 1-associating protein (WTAP) was made in HCC to study the correlation between m6A modification and autophagy. A fluorescent confocal microscopy analysis showed that the knockdown of WTAP could facilitate the autophagy of HCC. A Western blot analysis showed that the level of p-AMPK was decreased in WTAP-knockdown HCC cells. Additionally, LKB1, the upstream kinase of AMPK, was regulated by WTAP and it could mediate the phosphorylation of AMPK in an m6A-dependent manner. Further studies revealed that the knockdown of WTAP could reduce the level of LKB1 mRNA with m6A. This could result in the increased stability of LKB1 mRNA to promote its expression. The knockdown of WTAP could upregulate the level of autophagy and inhibit HCC proliferation. However, the overexpression of WTAP could resist autophagic cell death.

Keywords: AMPK; HCC; LKB1; WTAP; autophagy.


Conflict of interest statement

The authors declare no conflict of interest. The funders had no role in the design of the study; in the collection, analyses, or interpretation of data; in the writing of the manuscript, or in the decision to publish the results.

Figures

Figure 1
Figure 1
Knockdown of WTAP facilitating autophagy of HCC. (A) Western blot analysis of basal expression of WTAP in different HCC cell lines. (B) RT-qPCR analysis of WTAP transcripts from shWTAP cells and shCON cells. (C) Western blot analysis of LC3-I and LC3-II in shWTAP SMMC-7721 cells and shWTAP BEL-7404 cells. (D) Statistical analysis of LC3 II/LC3 I ratio between shCON and shWTAP group. (E) Western blot analysis of LC3-I and LC3-II in WTAP-knockdown BEL-7404 cells treated with or without 3-MA. (F) Western blot analysis of LC3-I and LC3-II in WTAP-knockdown SMMC-7721 cells treated with or without 3-MA. (G) Cofocal microscopy analysis of LC3 in shWTAP cells treated with or without 3-MA. (H) Statistical analysis of LC3 puncta in shWTAP cells and shCON cells, as well as 3-MA-treated cells. Error bars indicate the mean ± SD from three independent experiments (n = 3). p values was used to indicate statistica difference. * p < 0.05, ** p < 0.01 and *** p < 0.001.
Figure 2
Figure 2
Analysis of differential expression of genes in shWTAP SMMC-7721 cell lines by high-throughput sequencing. (A) Heat map showing the differentially expressed genes between shCON and shWTAP SMMC-7721 cells. (B) Volcano map showing the differentially expressed genes between shCON and shWTAP SMMC-7721 cells. (C) GO analysis of differentially expressed genes involved with biological process between shCON and shWTAP SMMC-7721 cells. (D) KEGG signal pathway analysis showing differentially expressed genes between shCON and shWTAP SMMC-7721 cells.
Figure 3
Figure 3
Effect of the upregulated level of p-AMPK caused by shWTAP on HCC autophagy. (A) Western blot analysis of some autophagy-related proteins expressed in BEL-7404 and SMMC-7721 cells. (B) Western blot analysis of LC3-I and LC3-II in shWTAP BEL-7404 cells treated with or without Compound C. (C) Western blot analysis of LC3-I and LC3-II in shWTAP BEL-7721 cells treated with or without Compound C. (D) Statistical analysis of LC3 II/LC3 I ratio between shCON and shWTAP–treated 7404 cell lines. (E) Statistical analysis of LC3 II/LC3 I ratio between shCON and shWTAP-treated 7721 cell lines. (F) Confocal fluorescence image of shWTAP cells treated with or without Compound C. (G) Statistical analysis of the numbers of LC3 puncta/cell. The cells indicated with red arrows were enlarged on the right. Error bars indicate the mean ± SD from three independent experiments (n = 3). * indicate a statistically significant difference (p < 0.05), ** indicate a statistically significant difference (p < 0.01) and *** indicate a statistically significant difference (p < 0.001).
Figure 4
Figure 4
Knockdown of WTAP facilitating autophagy through upregulation of LKB1. (A) Venn diagram showing the difference in m6A peaks between shCON and shWTAP cell lines. (B) Conserved m6A motif found in schON and shWTAP HCC cell lines. (C) Signal pathway analysis of the different m6A modified genes between shCON and shWTAP HCC cell lines. (D) The m6A motif found in LKB1 transcript through sequencing. (E) MeRIP-qPCR analysis of cellular m6A levels in shCON and shWTAP HCC cell lines. (F) RT-qPCR used for the abundance analysis of LKB1 transcript in shCON and shWTAP HCC cell lines. (G) Half-life analysis of RNA stability of LKB1 transcript in shCON and shWTAP HCC cell lines. (H) Western blot analysis of LKB1, p-AMPK, LC3-I and LC3-II in shCON and shWTAP cells. (I) Western blot analysis of LKB1, p-AMPK, LC3-I and LC3-II in shCON and shWTAP cells, as well as in siLKB1 cells. (J) Statistical analysis of LC3 -II/LC3-I ratio between shCON and shWTAP-treated 7404 and 7721 cell lines. Error bars indicate the mean ± SD from three independent experiments (n = 3). * indicate a statistically significant difference (p < 0.05) and ** indicate a statistically significant difference (p < 0.01), *** indicate a statistically significant difference (p < 0.001).
Figure 5
Figure 5
Effect of overexpression of WTAP on cell proliferation. (A) Western blot analysis of WTAP expressed in WTAP-OE and CON-OE cells. (B) RT-qPCR analysis of WTAP transcripts from WTAP-OE and CON-OE cells. (C) CCK-8 analysis was made to examine cell proliferation. (D) Colony formation analysis of WTAP-OE cells and CON-OE cells treated with different concentrations of RAPA. (E) Statistical analysis of cell survival of WTAP-OE cells and CON-OE treated with RAPA. (F) Statistical analysis of cell viability of WTAP-OE cells and CON-OE treated with RAPA. Error bars indicate the mean ± SD from three independent experiments (n = 3). ** indicate a statistically significant difference (p < 0.01), and *** indicates a statistically significant difference (p < 0.001).
Figure 6
Figure 6
Effect of 3-MA on the proliferation of shWTAP-treated and shCON cells. (A) Determination of OD450 of shCON, shWTAP, shCON-3-MA, and shWTAP-3-MA cells at indicated times. (B) Colony formation analysis of shCON cells and shWTAP cells treated with 3-MA. (C) Statistical analysis of cell colonies between MOCK and 3-MA treatment groups. Error bars indicate the mean ± SD from three independent experiments (n = 3). *** indicate a statistically significant difference (p < 0.001). * indicate a statistically significant difference (p < 0.05) and ** indicate a statistically significant difference (p < 0.01).
Figure 7
Figure 7
Schematic diagram for the regulatory role of WTAP on autophagy and proliferation of HCC, ↑ and ↓indicating upregulation and downregulation of target proteins, respectively. WTAP expression was not knocked down in wild type HCC. WTAP deficiency indicates the knockdown of WTAP in HCC by siRNA.

References

    1. Sagnelli E., Macera M., Russo A., Coppola N., Sagnelli C. Epidemiological and etiological variations in hepatocellular carcinoma. Infection. 2020;48:7–17. doi: 10.1007/s15010-019-01345-y. - DOI - PubMed
    1. Sung H., Ferlay J., Siegel R.L., Laversanne M., Soerjomataram I., Jemal A., Bray F. Global Cancer Statistics 2020: GLOBOCAN Estimates of Incidence and Mortality Worldwide for 36 Cancers in 185 Countries. CA Cancer J. Clin. 2021;71:209–249. doi: 10.3322/caac.21660. - DOI - PubMed
    1. Galluzzi L., Green D.R. Autophagy-Independent Functions of the Autophagy Machinery. Cell. 2019;177:1682–1699. doi: 10.1016/j.cell.2019.05.026. - DOI - PMC - PubMed
    1. Levine B., Kroemer G. Biological Functions of Autophagy Genes: A Disease Perspective. Cell. 2019;176:11–42. doi: 10.1016/j.cell.2018.09.048. - DOI - PMC - PubMed
    1. Nishimura T., Tooze S.A. Emerging roles of ATG proteins and membrane lipids in autophagosome formation. Cell Discov. 2020;6:32. doi: 10.1038/s41421-020-0161-3. - DOI - PMC - PubMed

Publication types