Review
. 2021 Nov 19;12(11):1822.
doi: 10.3390/genes12111822.

Sex Chromosomes and Master Sex-Determining Genes in Turtles and Other Reptiles

Affiliations
Review

Sex Chromosomes and Master Sex-Determining Genes in Turtles and Other Reptiles

Dominique Thépot. Genes (Basel). .

Abstract

Among tetrapods, the well differentiated heteromorphic sex chromosomes of birds and mammals have been highly investigated and their master sex-determining (MSD) gene, Dmrt1 and SRY, respectively, have been identified. The homomorphic sex chromosomes of reptiles have been the least studied, but the gap with birds and mammals has begun to fill. This review describes our current knowledge of reptilian sex chromosomes at the cytogenetic and molecular level. Most of it arose recently from various studies comparing male to female gene content. This includes restriction site-associated DNA sequencing (RAD-Seq) experiments in several male and female samples, RNA sequencing and identification of Z- or X-linked genes by male/female comparative transcriptome coverage, and male/female transcriptomic or transcriptome/genome substraction approaches allowing the identification of Y- or W-linked transcripts. A few putative master sex-determining (MSD) genes have been proposed, but none has been demonstrated yet. Lastly, future directions in the field of reptilian sex chromosomes and their MSD gene studies are considered.

Keywords: Genetic Sex Determination (GSD); RAD-seq; genome coverage; homologous genes; lizards; snakes; squamates.


Conflict of interest statement

The author declares no conflict of interest.

Figures

Figure 1
Figure 1
Current model for evolution of heteromorphic sex chromosomes from a pair of autosomes. Steps are shown from left to right. Ancestral genes are represented by dark blue lines, the male-determining gene is represented by a pink line, male beneficial genes are represented by green lines, and degenerating genes are represented by grey lines. Faded colours in the chromosome show the appearance of strata.
Figure 2
Figure 2
Phylogenic tree of amniotes. Relative position and grouping of each clade are shown. Branch lengths are not proportional to time. Numbers indicate divergence time (Myrs) from present for nodes, according to [38]. Colors indicate the different level of clades in the phylogenetic tree.
Figure 3
Figure 3
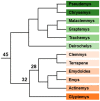
Phylogenic tree of turtle families. Relative positions of each turtle family and superior clade are represented. Branch lengths are not proportional to time. Numbers indicate divergence time (Myrs) from present for nodes, according to [39]. Colors indicate the different level of clades in the phylogenetic tree from the fourteen families (golden yellow) to the order (blue).
Figure 4
Figure 4
Phylogenic tree of pleurodiran turtles. Relative positions of each genus and superior clade are represented. Branch lengths are not proportional to time. Numbers indicate divergence time (Myrs) from present for some key nodes, according to [39]. Color of each genus indicates the different clades.
Figure 5
Figure 5
Phylogenic tree of trionychid turtles. Relative position of each genus and superior clade are represented. Branch lengths are not proportional to time. Numbers indicate divergence time (Myrs) from present for some key nodes, according to [39]. Color of each genus indicates the different clades.
Figure 6
Figure 6
Phylogenic tree of geoemydid turtles. Relative position of each genus and superior clade are represented. Branch lengths are not proportional to time. Numbers indicate divergence time (Myrs) from the present for some key nodes, according to [39]. Color of each genus indicates the different clades.
Figure 7
Figure 7
Phylogenic tree of emydid turtles. Relative position of each genus and superior clade are represented. Branch lengths are not proportional to time. Numbers indicate divergence time (Myrs) from present for some key nodes, according to [39]. Color of each genus indicates the different clades.
Figure 8
Figure 8
Models for transitions among sex-determining mechanisms in turtles. Black lines indicate branches where TSD occurs, red lines indicate branches where GSD occurs. Red stars indicate TSD to GSD transitions, black stars indicate GSD to TSD transitions. (A) Parsimonious model with five independent TSD to GSD transitions; (B) Valenzuela’s model with two older TSD to GSD transitions in pleurodira and trionychia, respectively, and two putative GSD to TSD transitions in pelomedusoides and carettochelyidae, respectively.
Figure 9
Figure 9
Phylogenic tree of squamates. Relative positions of each clade are represented following [38]. Names of clades are according to [170]. This tree has strong support, except for the position of Dibamia, which is sometimes alternatively placed as the sister group of Gekkota [171]. Branch lengths are not proportional to time. Numbers indicate divergence time (Myrs) from present for nodes, according to [38]. Colors indicate the different level of clades in the phylogenetic tree.
Figure 10
Figure 10
Phylogenic tree of Gekkota. Relative positions of each family are represented. Branch lengths are not proportional to time. Numbers indicate divergence time (Myrs) from present for nodes, according to [38]. Color of each family indicates the different clades.
Figure 11
Figure 11
Phylogenic tree of Scinciformata. Relative positions of each family or subfamily are represented. Branch lengths are not proportional to time. Numbers indicate divergence time (Myrs) from present for nodes, according to [38]. Color of each family or subfamily indicates the different clades.
Figure 12
Figure 12
Phylogenic tree of Laterata. Relative positions of each family are represented. Branch lengths are not proportional to time. Numbers indicate divergence time (Myrs) from present for nodes, according to [38]. Color of each family or subfamily indicates the different clades.
Figure 13
Figure 13
Phylogenic tree of Toxicofera. Relative positions of each family and superior clade are represented. Branch lengths are not proportional to time. Numbers indicate divergence time (Myrs) from present for nodes, according to [38]. Color of each family or subfamily indicates the different clades.
Figure 14
Figure 14
Phylogenic tree of snakes. Relative positions of each family and superior clade are represented. Branch lengths are not proportional to time. Numbers indicate divergence time (Myrs) from present for nodes, according to [38]. Colors indicate the different level of clades in the phylogenetic tree.

References

    1. Imarazene B., Du K., Beille S., Jouanno E., Feron R., Pan Q., Torres-Paz J., Lopez-Roques C., Castinel A., Gil L., et al. A supernumerary “B-sex” chromosome drives male sex determination in the Pachón cavefish, Astyanax mexicanus. Curr. Biol. 2021;31:4800–4809. doi: 10.1016/j.cub.2021.08.030. - DOI - PMC - PubMed
    1. Ponnikas S., Sigeman H., Abbott J.K., Hansson B. Why Do Sex Chromosomes Stop Recombining? Trends Genet. 2018;34:492–503. doi: 10.1016/j.tig.2018.04.001. - DOI - PubMed
    1. Sinclair A.H., Berta P., Palmer M.S., Hawkins J.R., Griffiths B.L., Smith M.J., Foster J.W., Frischauf A.M., Lovell-Badge R., Goodfellow P.N. A gene from the human sex-determining region encodes a protein with homology to a conserved DNA-binding motif. Nature. 1990;346:240–244. doi: 10.1038/346240a0. - DOI - PubMed
    1. Koopman P., Gubbay J., Vivian N., Goodfellow P., Lovell-Badge R. Male development of chromosomally female mice transgenic for Sry. Nature. 1991;351:117–121. doi: 10.1038/351117a0. - DOI - PubMed
    1. Takehana Y., Matsuda M., Myosho T., Suster M.L., Kawakami K., Shin-I T., Kohara Y., Kuroki Y., Toyoda A., Fujiyama A., et al. Co-option of Sox3 as the male-determining factor on the Y chromosome in the fish Oryzias dancena. Nat. Commun. 2014;5:4157. doi: 10.1038/ncomms5157. - DOI - PubMed

Publication types

LinkOut - more resources