

Mathematical Modelling of Canola Oil Biodegradation and Optimisation of Biosurfactant Production by an Antarctic Bacterial Consortium Using Response Surface Methodology
- PMID: 34829082
- PMCID: PMC8621366
- DOI: 10.3390/foods10112801
Mathematical Modelling of Canola Oil Biodegradation and Optimisation of Biosurfactant Production by an Antarctic Bacterial Consortium Using Response Surface Methodology
Abstract
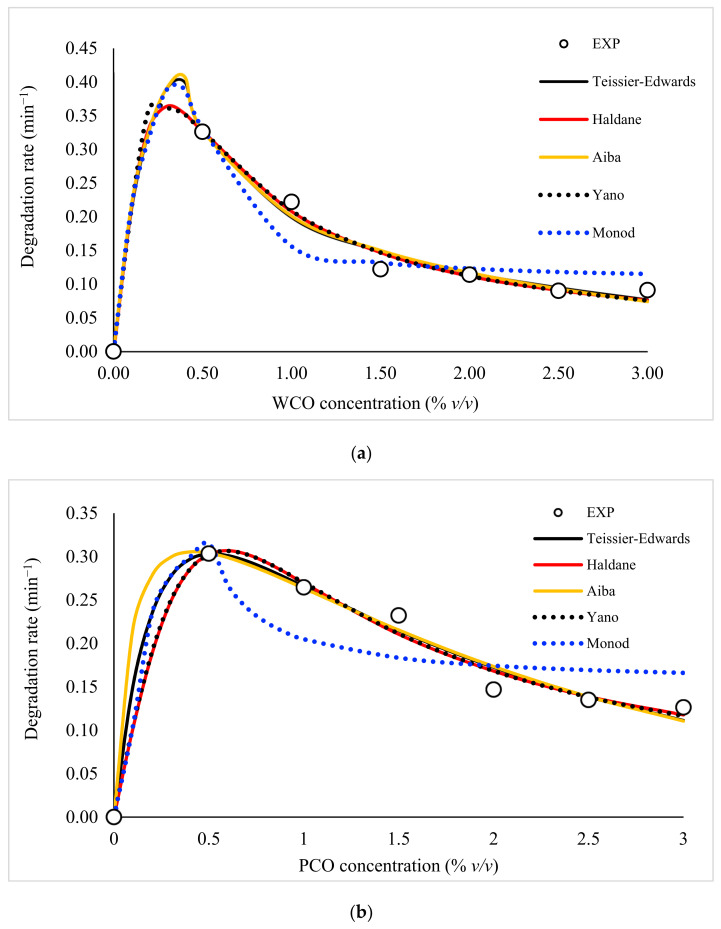
An Antarctic soil bacterial consortium (reference BS14) was confirmed to biodegrade canola oil, and kinetic studies on this biodegradation were carried out. The purpose of this study was to examine the ability of BS14 to produce biosurfactants during the biodegradation of canola oil. Secondary mathematical equations were chosen for kinetic analyses (Monod, Haldane, Teissier-Edwards, Aiba and Yano models). At the same time, biosurfactant production was confirmed through a preliminary screening test and further optimised using response surface methodology (RSM). Mathematical modelling demonstrated that the best-fitting model was the Haldane model for both waste (WCO) and pure canola oil (PCO) degradation. Kinetic parameters including the maximum degradation rate (μmax) and maximum concentration of substrate tolerated (Sm) were obtained. For WCO degradation these were 0.365 min-1 and 0.308%, respectively, while for PCO they were 0.307 min-1 and 0.591%, respectively. The results of all preliminary screenings for biosurfactants were positive. BS14 was able to produce biosurfactant concentrations of up to 13.44 and 14.06 mg/mL in the presence of WCO and PCO, respectively, after optimisation. The optimum values for each factor were determined using a three-dimensional contour plot generated in a central composite design, where a combination of 0.06% salinity, pH 7.30 and 1.55% initial substrate concentration led to the highest biosurfactant production when using WCO. Using PCO, the highest biosurfactant yield was obtained at 0.13% salinity, pH 7.30 and 1.25% initial substrate concentration. This study could help inform the development of large-scale bioremediation applications, not only for the degradation of canola oil but also of other hydrocarbons in the Antarctic by utilising the biosurfactants produced by BS14.
Keywords: Antarctic bacteria; biosurfactant; canola oil; central composite design; degradation; kinetic modelling.
Conflict of interest statement
The authors declare no conflict of interest.
Figures


References
-
- Australian Antarctic Division Pollution and Waste, Department of the Environmental and Energy. [(accessed on 30 December 2018)];2012 Available online: https://www.antarctica.gov.au.
-
- Bharti P.K., Sharma B., Singh R.K., Tyagi A.K. Waste generation and management in Antarctica. Procedia Environ. Sci. 2016;35:40–50. doi: 10.1016/j.proenv.2016.07.004. - DOI
-
- Kariminia S., Ahmad S.S., Hashim R., Ismail Z. Environmental consequences of Antarctic tourism from a global prospective. Procedia Soc. Behav. Sci. 2013;105:781–791. doi: 10.1016/j.sbspro.2013.11.081. - DOI
-
- Cripps G.C., Shears J. The fate in the marine environment of a minor diesel fuel spill from an Antarctic research station. Environ. Monit. Assess. 1996;46:221–232. doi: 10.1023/A:1005766302869. - DOI
Grants and funding
- GPM‒2018/9660000, GPM‒2019/9678900/Universiti Putra Malaysia
- YPASM Smart Partnership Initiative (6300247)/Sultan Mizan Antarctic Research Foundation (YPASM)
- CIMAA/Centro de Investigacion y Monitoreo Ambiental Antàrctico
- National Research Foundation of Korea (NRF) grant (No. 2021R1G1A1010154)/Korea government (MSIT)
- BAS 'Biodiversity, Evolution and Adaptation' Team./Natural Environment Research Council
LinkOut - more resources
Full Text Sources
Research Materials
Miscellaneous
