. 2021 Nov 20;10(11):2872.
doi: 10.3390/foods10112872.

Bitter Gourd Honey Ameliorates Hepatic and Renal Diabetic Complications on Type 2 Diabetes Rat Models by Antioxidant, Anti-Inflammatory, and Anti-Apoptotic Mechanisms

Affiliations

Bitter Gourd Honey Ameliorates Hepatic and Renal Diabetic Complications on Type 2 Diabetes Rat Models by Antioxidant, Anti-Inflammatory, and Anti-Apoptotic Mechanisms

Chandra Sekhar Arigela et al. Foods. .

Abstract

Honey has several pharmacological effects, including anti-diabetic activity. However, the effectiveness of bitter gourd honey (BGH) in the treatment of diabetes mellitus (DM) is unknown. The aim of this study was to determine the antioxidant, anti-inflammatory, and anti-apoptotic properties of BGH on the kidney and liver of a streptozotocin-induced diabetes rat model.

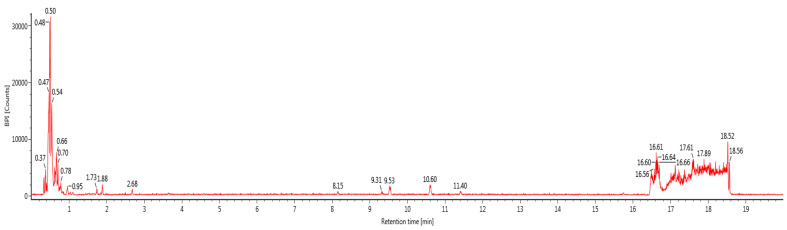
Methods: A single dose (nicotinamide 110 mg/kg, streptozotocin (STZ) 55 mg/kg, intraperitoneal (i.p.)) was used to induce DM in male rats. For 28 days, normal or diabetic rats were administered 1 g/kg/day and 2 g/kg/day of BGH orally. After the treatment, blood, liver, and kidney samples were collected and analysed for biochemical, histological, and molecular parameters. In addition, liquid chromatography-mass spectrometry (LC-MS) was used to identify the major bioactive components in BGH.

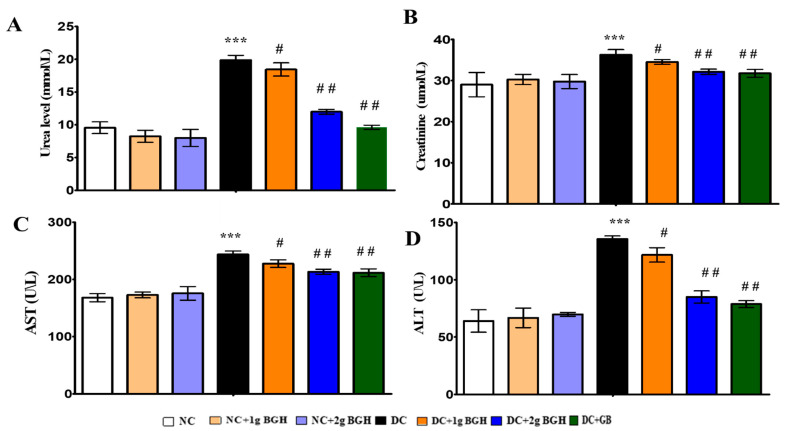
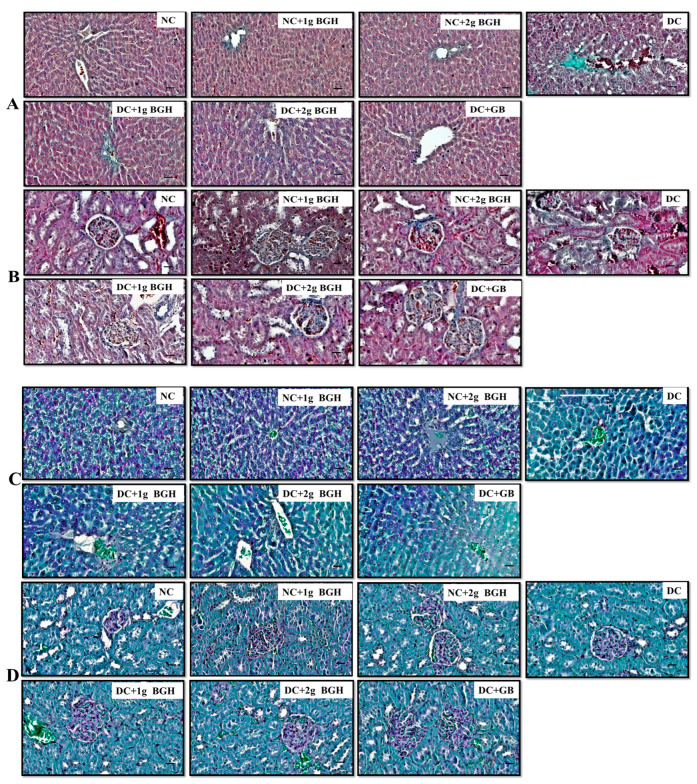
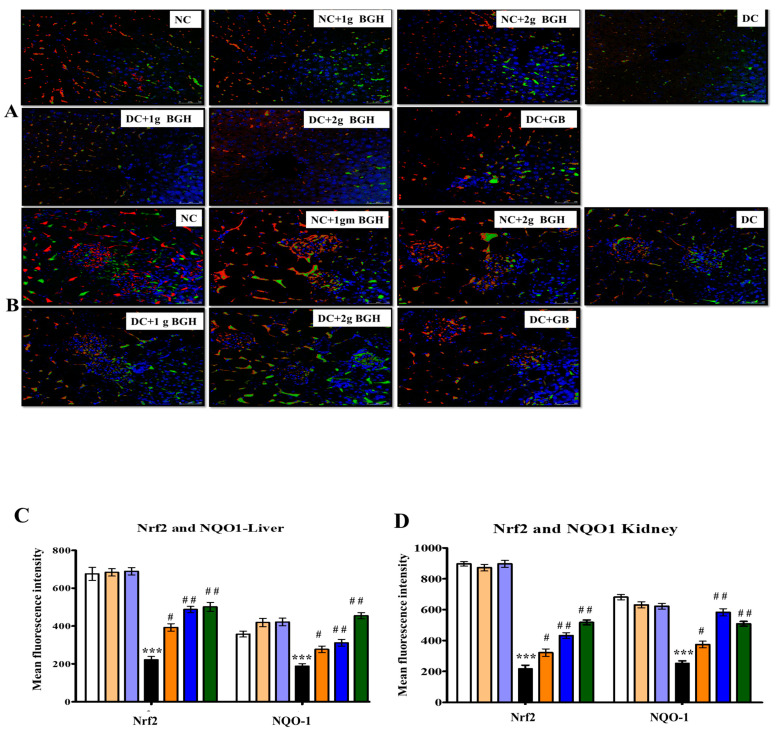
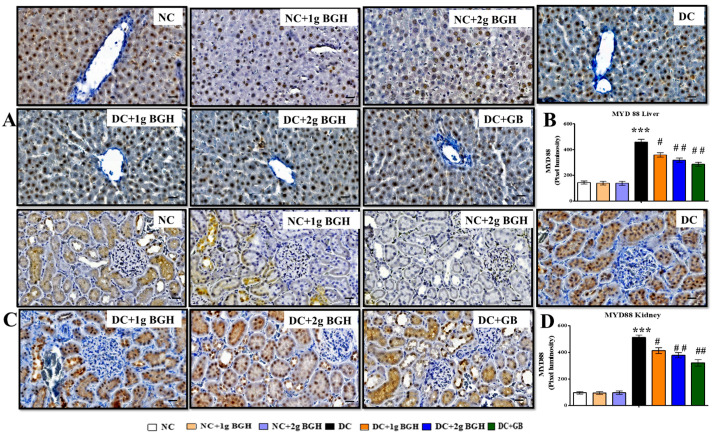
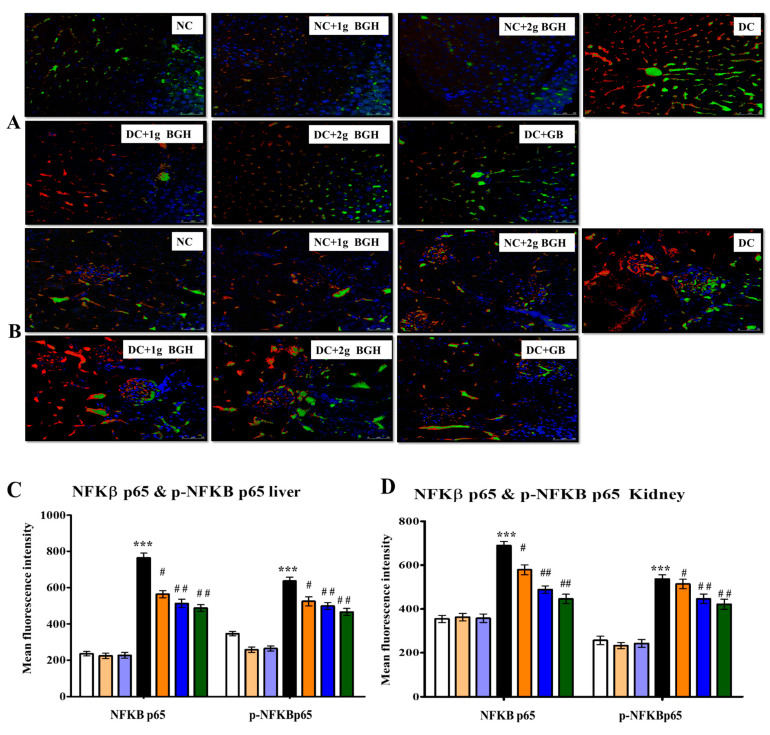
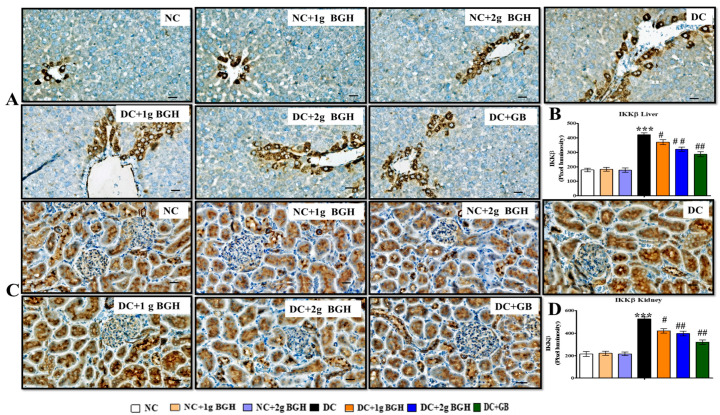
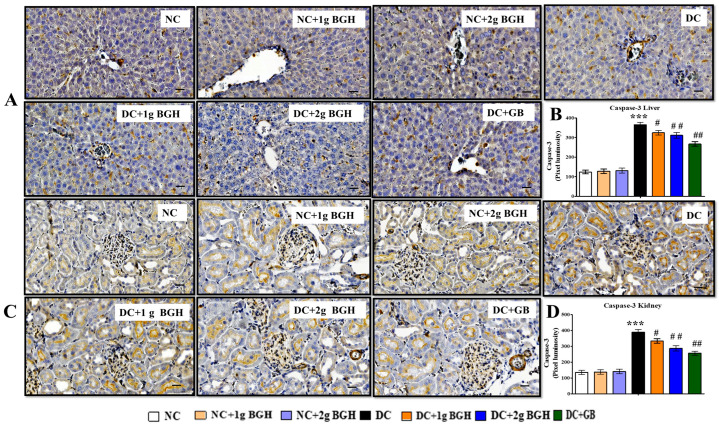
Results: The administration of BGH to diabetic rats resulted in significant reductions in alanine transaminase (ALT),aspartate aminotransferase (AST), creatinine, and urea levels. Diabetic rats treated with BGH showed lesser pathophysiological alterations in the liver and kidney as compared to non-treated control rats. BGH-treated diabetic rats exhibited reduced levels of oxidative stress (MDA levels), inflammatory (MYD88, NFKB, p-NFKB, IKKβ), and apoptotic (caspase-3) markers, as well as higher levels of antioxidant enzymes (SOD, CAT, and GPx) in the liver and kidney. BGH contains many bioactive compounds that may have antioxidative stress, anti-inflammatory, and anti-apoptotic effects.

Conclusion: BGH protected the liver and kidney in diabetic rats by reducing oxidative stress, inflammation, and apoptosis-induced damage. As a result, BGH can be used as a potential therapy to ameliorate diabetic complications.

Keywords: antioxidant enzymes; diabetes mellitus; inflammation; oxidative stress.


Conflict of interest statement

The authors disclose no conflict of interest.

Figures

Figure 1
Figure 1
LC-MS chromatogram of BGH sample spectral data is listed in Table 1. The x-axis shows retention time in minutes; the y-axis shows the intensity.
Figure 2
Figure 2
(A) Docking image Amylase—shancilin, (B) Docking image PPAR-γ—shancilin, (C) Redocked image amylase—Montbretin, (D) Redocked image PPAR-γ—rosiglitazone.
Figure 3
Figure 3
Bar charts showing the effect of BGH on liver and kidney functional markers: (A) Urea levels, (B) Creatine levels, (C) Aspartate aminotransferase (AST) levels, (D) Alanine aminotransferase (ALT) levels. The results were collected from six separate rats within every treatment group and were reported as a mean ± S.E.M. *** p < 0.001 vs. NC; # p < 0.05; ## p < 0.01 vs. DC. NC: Normal control; NC+1g BGH: Non-diabetic rats that received 1 g/kg/day BGH; NC + 2 g BGH: Non-diabetic rats that received 2 g/kg/day BGH; DC: Diabetic control; DC + 1 g BGH: Diabetic rats that received 1 g/kg/day BGH; DC + 2 g BGH: Diabetic rats that received 2 g/kg/day BGH; DC + GB: Diabetic rats that received 2 mg/kg/day glibenclamide.
Figure 4
Figure 4
BGH effect on histopathological differences in the appearance of hepatic cells (A) and renal cells (B) in various experimental groups, which were stained with Masson trichrome. BGH effect on histopathological differences in the appearance of l hepatic cells (C) and renal cells (D) in various experimental groups, which were stained with Periodic acid—Schiff. Scale bar = 100 µm. NC: Normal control; NC + 1 g BGH: Non-diabetic rats that received 1 g/kg/day BGH; NC + 2 g BGH: Non-diabetic rats that received 2 g/kg/day BGH; DC: Diabetic control; DC + 1 g BGH: Diabetic rats that received 1 g/kg/day BGH; DC + 2 g BGH: Diabetic rats that received 2 g/kg/day BGH; DC + GB: Diabetic rats that received 2 mg/kg/day glibenclamide.
Figure 5
Figure 5
Representative confocal images of antioxidant markers Nrf2 (red) and NOQ1 (green) double immunofluorescence staining in the liver (A) and kidney (B) samples from BGH-treated rats. Quantitative analyses of immunofluorescence signals in the liver (C) and kidney tissues (D). The results were collected from six separate rats within every treatment group and were reported as a mean ± S.E.M. *** p < 0.001 vs. NC; # p < 0.05; ## p < 0.01 vs. DC. S Scale bar = 100 µm. NC: Normal control; NC+1g BGH: Non-diabetic rats that received 1 g/kg/day BGH; NC+2g BGH: Non-diabetic rats that received 2 g/kg/day BGH; DC: Diabetic control; DC+1g BGH: Diabetic rats that received 1 g/kg/day BGH; DC + 2g BGH: Diabetic rats that received 2 g/kg/day BGH; DC+GB: Diabetic rats that received 2 mg/kg/day glibenclamide.
Figure 6
Figure 6
Effect of BGH on the expression of inflammation markers MyD88. Representing immunoperoxidase images showing the distribution of MYD88 in the hepatic cells (A) and renal cells (C). Bar chart showing the mean intensity of dark brown staining of MyD88 expression in hepatic cells (B) and renal cells (D). Data were obtained from six different rats in each treatment group and expressed as mean ± S.E.M. *** p < 0.001 vs. NC; # p < 0.05; ## p < 0.01; vs. DC. Bar scale = 100 μm. 40× Magnification. NC: Normal control; NC+1g BGH: Non-diabetic rats that received 1 g/kg/day BGH; NC + 2 g BGH: Non-diabetic rats that received 2 g/kg/day BGH; DC: Diabetic control; DC + 1 g BGH: Diabetic rats that received 1 g/kg/day BGH; DC + 2 g BGH: Diabetic rats that received 2 g/kg/day BGH; DC+GB: Diabetic rats that received 2 mg/kg/day glibenclamide.
Figure 7
Figure 7
Representative confocal images of inflammatory markers p-NF-κB (red) and NF-κB (green) double immunofluorescence staining in the liver (A) and kidney (B) samples from BGH-treated rats. Quantitative analyses of immunofluorescence signals in the liver (C) and kidney sections (D). Data were obtained from six different rats in each treatment group and expressed as mean ± S.E.M. *** p < 0.001 vs. NC; # p < 0.05; ## p < 0.01 vs. DC. S Scale bar = 100 µm. NC: Normal control; NC+1g BGH: Non-diabetic rats that received 1 g/kg/day BGH; NC + 2 g BGH: Non-diabetic rats that received 2 g/kg/day BGH; DC: Diabetic control; DC + 1 g BGH: Diabetic rats that received 1 g/kg/day BGH; DC + 2 g BGH: Diabetic rats that received 2 g/kg/day BGH; DC + GB: Diabetic rats that received 2 mg/kg/day glibenclamide.
Figure 8
Figure 8
Effect of BGH on the expression of inflammation markers IKKβ. Representing immunoperoxidase images showing the distribution of IKKβ in the hepatic cells (A) and renal cells (C). Bar chart showing mean intensity of dark brown staining of IKKβ expression in hepatic cells (B) and renal cells (D). The results were collected from six separate rats within every treatment group and were reported as a mean ± S.E.M. *** p < 0.001 vs. NC; # p < 0.05; ## p < 0.01 vs. DC. Bar scale = 100 μm. 40× Magnification. NC: Normal control; NC + 1 g BGH: Non-diabetic rats that received 1 g/kg/day BGH; NC + 2 g BGH: Non-diabetic rats that received 2 g/kg/day BGH; DC: Diabetic control; DC + 1 g BGH: Diabetic rats that received 1 g/kg/day BGH; DC + 2 g BGH: Diabetic rats that received 2 g/kg/day BGH; DC + GB: Diabetic rats that received 2 mg/kg/day Glibenclamide.
Figure 9
Figure 9
Effect of BGH on the expression of apoptosis marker caspase-3. Representing immunoperoxidase images showing the distribution of caspase-3 in the hepatic (A) and renal cells (C). Dark brown staining shows the locations of delivery. Bar chart showing mean intensity of dark brown staining of caspase-3 expression in hepatic cells (B) and renal cells (D). The results were collected from six separate rats within every treatment group and were reported as a mean ± S.E.M. *** p < 0.001 vs. NC; # p < 0.05; ## p < 0.01 vs. DC. Bar scale = 100 μm. 40× Magnification. NC: Normal control; NC + 1 g BGH: Non-diabetic rats that received 1 g/kg/day BGH; NC + 2 g BGH: Non-diabetic rats that received 2 g/kg/day BGH; DC: Diabetic control; DC + 1 g BGH: Diabetic rats that received 1 g/kg/day BGH; DC + 2 g BGH: Diabetic rats that received 2 g/kg/day BGH; DC + GB: Diabetic rats that received 2 mg/kg/day glibenclamide.

References

    1. Finkel T., Holbrook N.J. Oxidants, oxidative stress and the biology of ageing. Nature. 2000;408:239–247. doi: 10.1038/35041687. - DOI - PubMed
    1. Boutten A., Goven D., Artaud-Macari E., Boczkowski J., Bonay M. NRF2 targeting: A promising therapeutic strategy in chronic obstructive pulmonary disease. Trends Mol. Med. 2011;17:363–371. doi: 10.1016/j.molmed.2011.02.006. - DOI - PubMed
    1. Cho H.-Y., Kwak M.-K., Pi J. Nrf2 in Host Defense: Over the Rainbow. Oxidative Med. Cell. Longev. 2013;2013:975839. doi: 10.1155/2013/975839. - DOI - PMC - PubMed
    1. Blachier M., Leleu H., Peck-Radosavljevic M., Valla D.C., Roudot-Thoraval F. The burden of liver disease in Europe: A review of available epidemiological data. J. Hepatol. 2013;58:593–608. doi: 10.1016/j.jhep.2012.12.005. - DOI - PubMed
    1. Caldwell S.H., Oelsner D.H., Iezzoni J.C., Hespenheide E.E., Battle E.H., Driscoll C.J. Cryptogenic cirrhosis: Clinical characterization and risk factors for underlying disease. Hepatology. 1999;29:664–669. doi: 10.1002/hep.510290347. - DOI - PubMed