. 2021 Nov 16;7(11):971.
doi: 10.3390/jof7110971.

Novel Nile Blue Analogue Stains Yeast Vacuolar Membrane, Endoplasmic Reticulum, and Lipid Droplets, Inducing Cell Death through Vacuole Membrane Permeabilization

Affiliations

Novel Nile Blue Analogue Stains Yeast Vacuolar Membrane, Endoplasmic Reticulum, and Lipid Droplets, Inducing Cell Death through Vacuole Membrane Permeabilization

João Carlos Canossa Ferreira et al. J Fungi (Basel). .

Abstract

Phenoxazine derivatives such as Nile Blue analogues are assumed to be increasingly relevant in cell biology due to their fluorescence staining capabilities and antifungal and anticancer activities. However, the mechanisms underlying their effects remain poorly elucidated. Using S. cerevisiae as a eukaryotic model, we found that BaP1, a novel 5- and 9-N-substituted benzo[a]phenoxazine synthesized in our laboratory, when used in low concentrations, accumulates and stains the vacuolar membrane and the endoplasmic reticulum. In contrast, at higher concentrations, BaP1 stains lipid droplets and induces a regulated cell death process mediated by vacuolar membrane permeabilization. BaP1 also induced mitochondrial fragmentation and depolarization but did not lead to ROS accumulation, changes in intracellular Ca2+, or loss of plasma membrane integrity. Additionally, our results show that the cell death process is dependent on the vacuolar protease Pep4p and that the vacuole permeabilization results in its translocation from the vacuole to the cytosol. In addition, although nucleic acids are commonly described as targets of benzo[a]phenoxazines, we did not find any alterations at the DNA level. Our observations highlight BaP1 as a promising molecule for pharmacological application, using vacuole membrane permeabilization as a targeted approach.

Keywords: Nile Blue analogue; benzo[a]phenoxazine derivative; cell death mechanism; vacuole/lysosome membrane permeabilization; yeast as a eukaryotic cell model.


Conflict of interest statement

The authors declare no conflict of interest.

Figures

Figure 1
Figure 1
Chemical structure of N-(5-((4-ethoxy-4-oxobutyl)amino)-10-methyl-9H-benzo[a]phenoxazin-9-ylidene)ethanaminium chloride (BaP1).
Figure 2
Figure 2
Effect of BaP1 on yeast cellular viability. (A) Effect of cycloheximide (CHX) (100 μg/mL) on viability of S. cerevisiae W303-1A exponential cells, exposed to BaP1 (300 μM) and DMSO (0.35%) (negative control). Cycloheximide was added 30 min before the beginning of BaP1 treatment. (B) Effect of BaP1 (300 μM) and DMSO (0.35%) on cell viability of S. cerevisiae AD1-7 and US50-18C strains. (C) Effect of BaP1 (300 μM) and DMSO (0.35%) on cell viability of S. cerevisiae W303-1A, Δyca1, Δaac 1/2/3, rho0. (D) Effect of BaP1 (300 μM) and DMSO (0.35%) on cell viability of S. cerevisiae BY4741, BY4742, Δpep4, Δnuc1, Δaif1, Δcpr3, and Δdga1∆iro1 strains. (E) Effect of BaP1 (300 μM) and DMSO (0.35%) on cell viability of S. cerevisiae BY 4741 Δpep4 pESC(Ø), BY 4741 Δpep4 pESC-DPM-Pep4p and BY 4741 Δpep4 pESC-Pep4p(FL) strains. 30 min: (d vs. e) ns, (d vs. f) **, (e vs. f) **; 60 min: (d vs. e) *, (d vs. f) ***, (e vs. f) ns; 90 min: (d vs. e) ns, (d vs. f) ***, (e vs. f) *; 120 min: (d vs. e) *, (d vs. f) ***, (e vs. f) *. Cell viability was assessed by CFU counting at the different time points (0, 30, 60, 90, 120 min). The time 0 corresponds to 100% is the CFU counting before BaP1 and DMSO treatment. Values are means with SD (n ≥ 2). Statistical analysis was performed by two-way ANOVA. * p < 0.05, ** p < 0.01, *** p < 0.001.
Figure 3
Figure 3
Evaluation of mitochondrial morphology and mitochondrial membrane potential. (A) Fluorescence microscopy images of W303-1A pYX-mt-GFP cells after 30 min of treatment with BaP1 (300 μM) or DMSO (negative control). Samples were collected at different time points, before (time 0) and after 30, 60, 90, and 120 min of treatment, and then visualized by epifluorescence microscopy with a 100× oil immersion objective; (B) percentage of BaP1-treated cells displaying mitochondrial network fragmentation. At least 300 cells were counted for each condition. (C) Effect of BaP1 on mitochondrial membrane potential. Quantification of FL1 negative population (FL1 LOG) corresponding to the percentage of cells with mitochondrial depolarization. Values are the means with SD (n ≥ 2). Statistical analysis was performed by two-way ANOVA. ns: non-significant, *** p < 0.001, **** p < 0.0001.
Figure 4
Figure 4
Evaluation of autophagy induction. (A) Effect of BaP1 (300 μM) and DMSO (0.35%) on cell viability of S. cerevisiae W303-1A and W303-1A ∆atg1. (B) Fluorescence microscopy images of W303-1A GFP-ATG8 and W303-1A Δatg5 GFP-ATG8 cells after 60 min treatment with BaP1 (300 µM) or DMSO (negative control), and Rapamycin (0.2 μg/mL). Samples were collected at different time points, before (time 0) and after 30, 60, 90, and 120 min of treatment, and then observed by epifluorescence microscopy with a 100× oil immersion objective. (C) Effect of BaP1 or DMSO (negative control), and Rapamycin (positive control) on the Atg8p processing of W303-1A GFP-ATG8 and W303-1A Δatg5 GFP-ATG8 cells. Representative experiment of two independent experiments. (D) Quantification of cleaved GFP, values are ratios, normalized for GFP-ATG8 protein levels and PGK levels. Values are the means with SD (n ≥ 2). Statistical analysis was performed by two-way ANOVA. ns: non-significant, ** p < 0.01.
Figure 4
Figure 4
Evaluation of autophagy induction. (A) Effect of BaP1 (300 μM) and DMSO (0.35%) on cell viability of S. cerevisiae W303-1A and W303-1A ∆atg1. (B) Fluorescence microscopy images of W303-1A GFP-ATG8 and W303-1A Δatg5 GFP-ATG8 cells after 60 min treatment with BaP1 (300 µM) or DMSO (negative control), and Rapamycin (0.2 μg/mL). Samples were collected at different time points, before (time 0) and after 30, 60, 90, and 120 min of treatment, and then observed by epifluorescence microscopy with a 100× oil immersion objective. (C) Effect of BaP1 or DMSO (negative control), and Rapamycin (positive control) on the Atg8p processing of W303-1A GFP-ATG8 and W303-1A Δatg5 GFP-ATG8 cells. Representative experiment of two independent experiments. (D) Quantification of cleaved GFP, values are ratios, normalized for GFP-ATG8 protein levels and PGK levels. Values are the means with SD (n ≥ 2). Statistical analysis was performed by two-way ANOVA. ns: non-significant, ** p < 0.01.
Figure 5
Figure 5
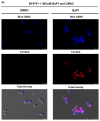
BaP1 intracellular distribution for concentrations of 2.5 μM and 300 μM. (A) Fluorescence microscopy images of W303-1A-pDF01-VBA1-YEGFP cells after incubation with BaP1 (2.5 µM). (B) Fluorescence microscopy images of BY4741-SEC66-GFP cells after treatment with BaP1 (2.5 µM). (C) Fluorescence microscopy images of BY4742 cells after incubation with BaP1 (300 µM). Samples were stained in PBS 1× at room temperature and visualized by epifluorescence microscopy after 5 min with a 100× oil immersion objective.
Figure 5
Figure 5
BaP1 intracellular distribution for concentrations of 2.5 μM and 300 μM. (A) Fluorescence microscopy images of W303-1A-pDF01-VBA1-YEGFP cells after incubation with BaP1 (2.5 µM). (B) Fluorescence microscopy images of BY4741-SEC66-GFP cells after treatment with BaP1 (2.5 µM). (C) Fluorescence microscopy images of BY4742 cells after incubation with BaP1 (300 µM). Samples were stained in PBS 1× at room temperature and visualized by epifluorescence microscopy after 5 min with a 100× oil immersion objective.
Figure 6
Figure 6
Evaluation of vacuolar membrane permeabilization and Pep4p release. (A) Fluorescence microscopy images of BY4741 cells after 30 min of treatment with BaP1 (300 µM) or DMSO (negative control). (B) Fluorescence microscopy images of W303-1A p416 ADH-pep4-EGFP cells after 30 min of treatment with BaP1 (300 µM) or DMSO (negative control). Cells were stained with CMAC to observe vacuolar permeabilization. Samples were collected at different time points, before (time 0) and after 30, 60, 90, and 120 min of treatment and then visualized by epifluorescence microscopy with a 100× oil immersion objective. (C) Percentage of BaP1-treated cells displaying dispersed blue staining pattern correspondent to vacuole permeabilization. The reported values are means with SD (n ≥ 2). At least 300 cells were counted for each condition.
Figure 6
Figure 6
Evaluation of vacuolar membrane permeabilization and Pep4p release. (A) Fluorescence microscopy images of BY4741 cells after 30 min of treatment with BaP1 (300 µM) or DMSO (negative control). (B) Fluorescence microscopy images of W303-1A p416 ADH-pep4-EGFP cells after 30 min of treatment with BaP1 (300 µM) or DMSO (negative control). Cells were stained with CMAC to observe vacuolar permeabilization. Samples were collected at different time points, before (time 0) and after 30, 60, 90, and 120 min of treatment and then visualized by epifluorescence microscopy with a 100× oil immersion objective. (C) Percentage of BaP1-treated cells displaying dispersed blue staining pattern correspondent to vacuole permeabilization. The reported values are means with SD (n ≥ 2). At least 300 cells were counted for each condition.

References

    1. Jose J., Burgess K. Syntheses and properties of water-soluble Nile Red derivatives. J. Org. Chem. 2006;71:7835–7839. doi: 10.1021/jo061369v. - DOI - PubMed
    1. Frade V.H.J., Gonçalves M.S.T., Moura J.C.V.P. Synthesis and fluorescence properties of side-chain carboxylated 5,9-diaminobenzo[a]phenoxazinium salts. Tetrahedron Lett. 2005;46:4949–4952. doi: 10.1016/j.tetlet.2005.05.105. - DOI
    1. Frade V.H.J., Gonçalves M.S.T., Coutinho P.J.G., Moura J.C.V.P. Synthesis and spectral properties of long-wavelength fluorescent dyes. J. Photochem. Photobiol. A Chem. 2007;185:220–230. doi: 10.1016/j.jphotochem.2006.06.013. - DOI
    1. Raju B.R., Garcia A.M.F., Costa A.L.S., Coutinho P.J.G., Gonçalves M.S.T. Synthesis of new benzo[a]phenoxazinium probes possessing carboxylic ester, hydroxyl and amino functional groups: Photophysical studies in dry ethanol and conjugation with CdTe quantum dots. Dye Pigment. 2014;110:203–213. doi: 10.1016/j.dyepig.2014.04.006. - DOI
    1. Firmino A.D.G., Gonçalves M.S.T. Bifunctionalised long-wavelength fluorescent probes for biological applications. Tetrahedron Lett. 2012;53:4946–4950. doi: 10.1016/j.tetlet.2012.07.004. - DOI

LinkOut - more resources