. 2021 Oct 20;10(11):1645.
doi: 10.3390/antiox10111645.

CRIF1 Deficiency Increased Homocysteine Production by Disrupting Dihydrofolate Reductase Expression in Vascular Endothelial Cells

Affiliations

CRIF1 Deficiency Increased Homocysteine Production by Disrupting Dihydrofolate Reductase Expression in Vascular Endothelial Cells

Ikjun Lee et al. Antioxidants (Basel). .

Abstract

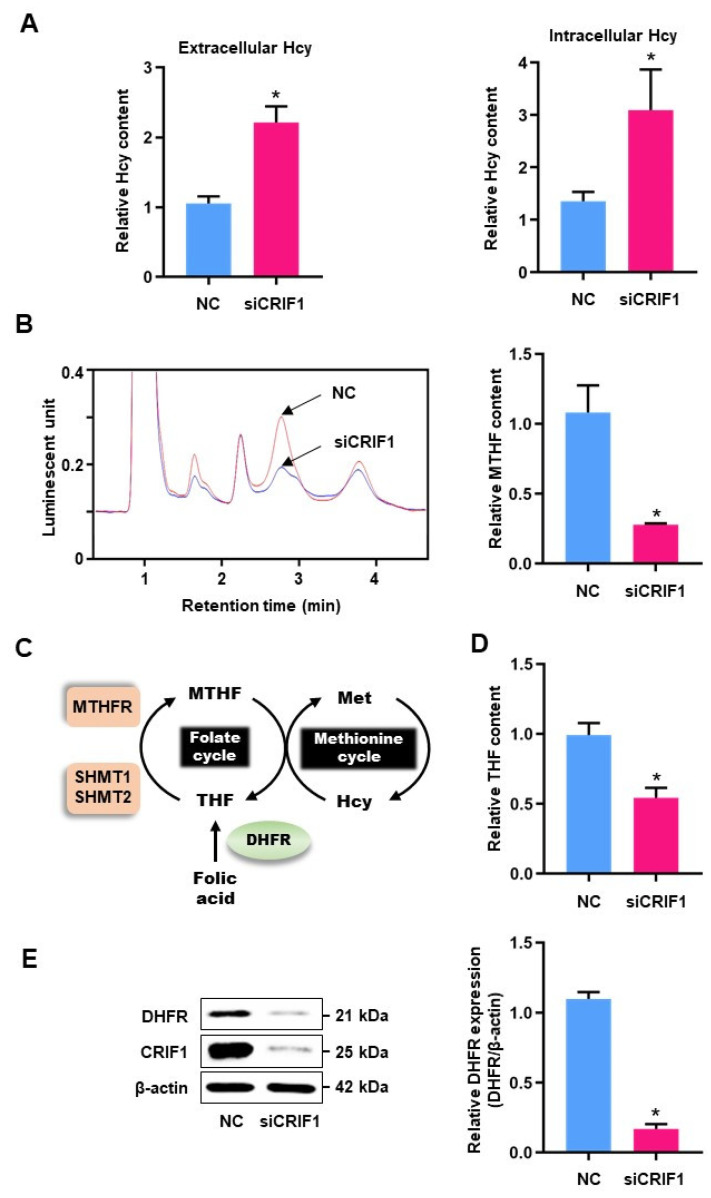
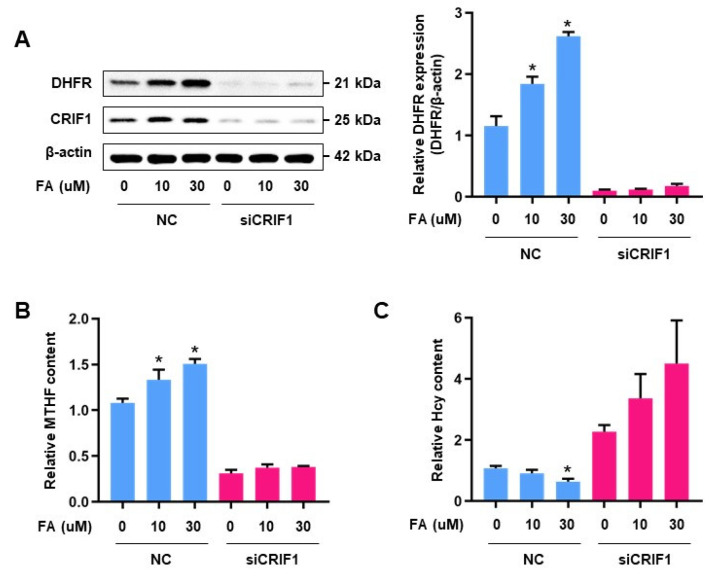
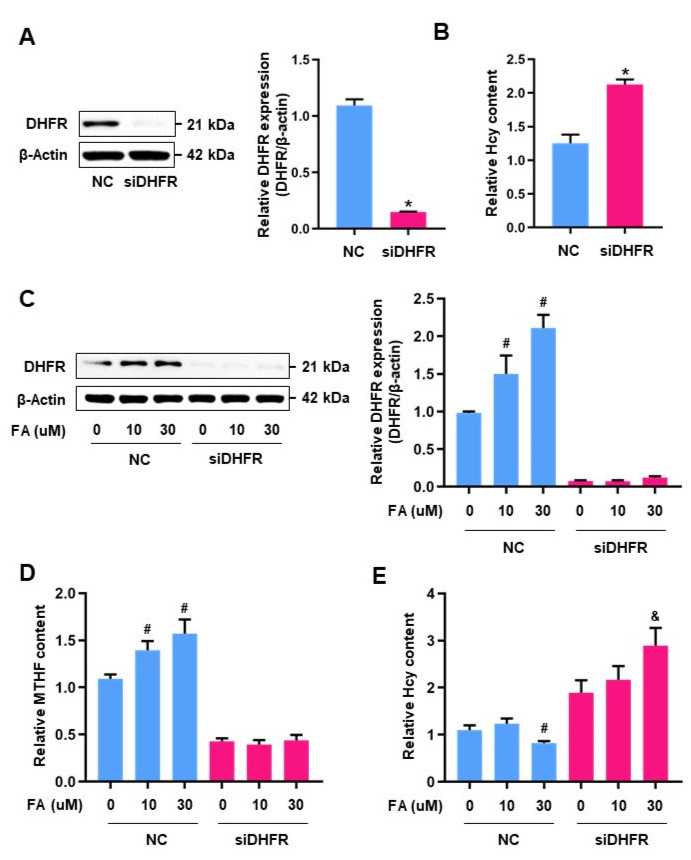
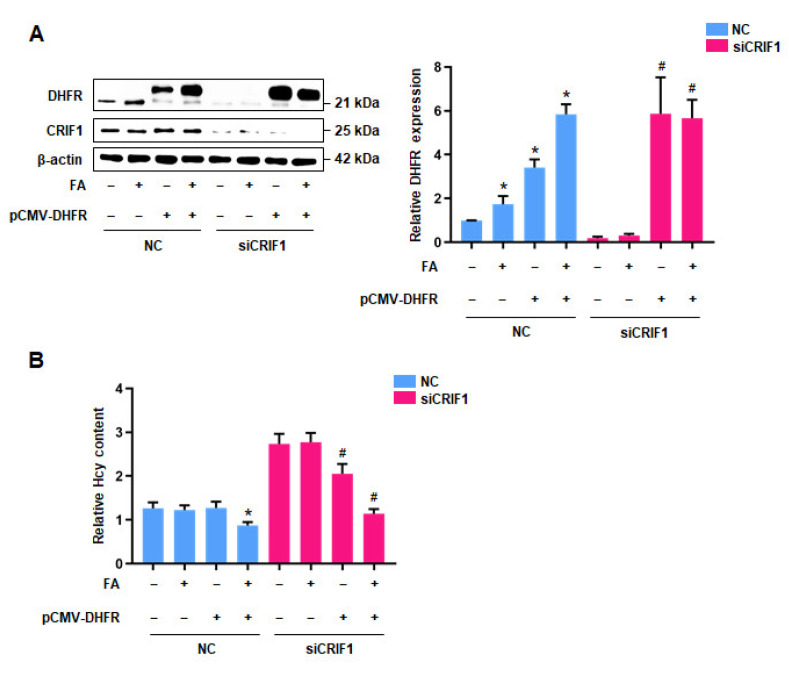
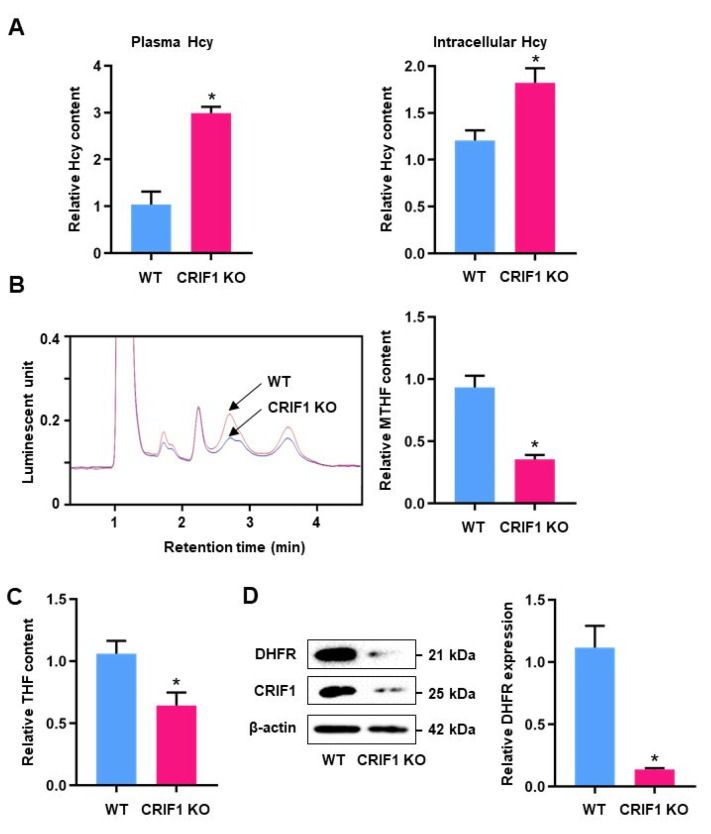
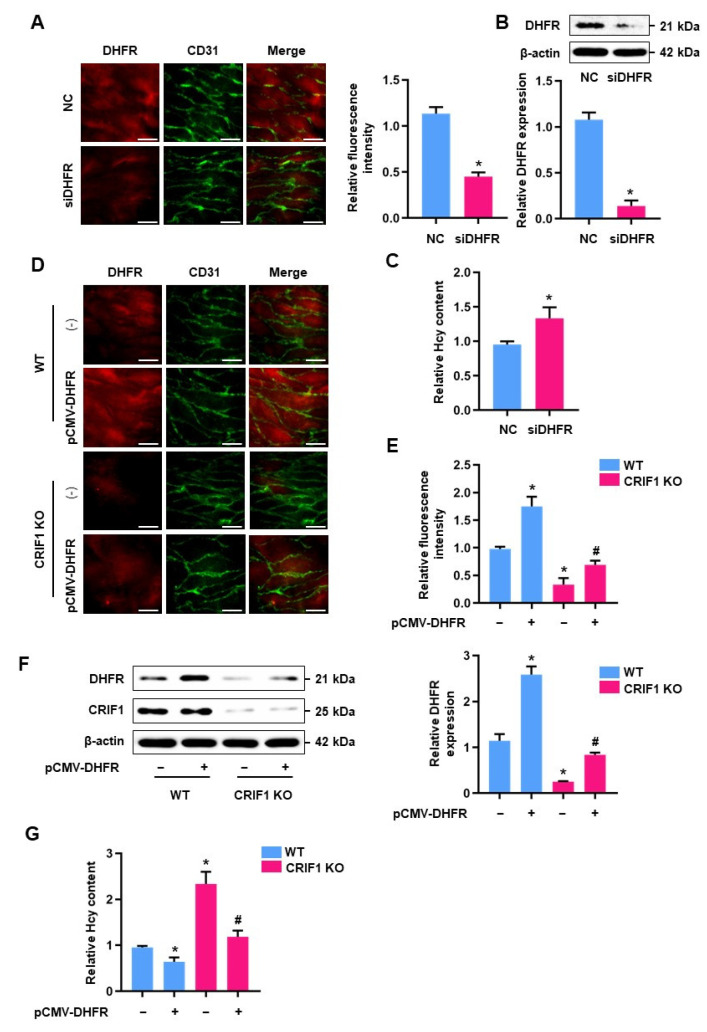
Elevated plasma homocysteine levels can induce vascular endothelial dysfunction; however, the mechanisms regulating homocysteine metabolism in impaired endothelial cells are currently unclear. In this study, we deleted the essential mitoribosomal gene CR6 interacting factor 1 (CRIF1) in human umbilical vein endothelial cells (HUVECs) and mice to induce endothelial cell dysfunction; then, we monitored homocysteine accumulation. We found that CRIF1 downregulation caused significant increases in intracellular and plasma concentrations of homocysteine, which were associated with decreased levels of folate cycle intermediates such as 5-methyltetrahydrofolate (MTHF) and tetrahydrofolate (THF). Moreover, dihydrofolate reductase (DHFR), a key enzyme in folate-mediated metabolism, exhibited impaired activity and decreased protein expression in CRIF1 knockdown endothelial cells. Supplementation with folic acid did not restore DHFR expression levels or MTHF and homocysteine concentrations in endothelial cells with a CRIF1 deletion or DHFR knockdown. However, the overexpression of DHFR in CRIF1 knockdown endothelial cells resulted in decreased accumulation of homocysteine. Taken together, our findings suggest that CRIF1-deleted endothelial cells accumulated more homocysteine, compared with control cells; this was primarily mediated by the disruption of DHFR expression.

Keywords: CR6 interacting factor 1; dihydrofolate reductase; folic acid; homocysteine.


Conflict of interest statement

The authors declare no conflict of interest.

Figures

Figure 1
Figure 1
The levels of homocysteine, folate intermediates, and DHFR expression in CRIF1-deficienct HUVECs: (A) Hcy content in cells and supernatant media were measured using 100 pmol NC and siCRIF1-treated HUVECs. Relative quantitative analysis of Hcy content is shown as graph. (B) MTHF content of siCIRF1-treated HUVECs were analyzed using fluorescent-HPLC. Luminescent units of NC and siCRIF1-deleted HUVECs are shown as a graph (left), and the arrows indicate the peak of MTHF in cells. Relative quantification using peak-area is suggested as a graph (right). (C) Schematic model of the Hcy metabolism pathway via remethylation using MTHF synthesized through the FA cycle. (D) THF content was measured in NC and CRIF1 siRNA-treated cells. (E) DHFR protein expression was detected by immunoblotting. Protein level was quantified by relative densitometric assay. Data are presented with three independent experiments as the mean ± SEM. * p < 0.05 compared with NC siRNA-treated cells.
Figure 2
Figure 2
The effect of CRIF1 deficiency on FA-induced homocysteine and folate intermediates regulation: (A) DHFR protein level in HUVECS with 10 μM and 30 μM of FA after NC or CRIF1 siRNA treatments. Graph shows the densitometric assay of band intensity. (B) Fluorescent-HPLC analysis of MTHF content using the peak area of CRIF1-deleted HUVECs before FA treatments. (C) Relative quantification of the Hcy level with NC or siCRIF1 siRNA with/without FA. Data are presented with three independent experiments as the mean ± SEM. * p < 0.05 versus NC-treated cells with 0 μM FA in the NC group.
Figure 3
Figure 3
The effect of DHFR deficiency on homocysteine and folate intermediates in HUVECs: (A) Western blot analysis for DHFR expression in HUVECs after silencing DHFR by using 100 pmol siRNA over 48 h. The expression level of DHFR was quantified densitometrically. (B) The Hcy content of supernatant media of siDHFR-treated HUVECs was measured. Data are presented with three independent experiments as the mean ± SEM. * p < 0.05 compared with NC-treated cells. (C) HUVECs transfected with 100 pmol siDHFR before 10 μM or 30 μM FA treatment were used for measuring the protein level of DHFR. Densitometric analysis of DHFR expression is shown as a graph relatively. (D) Fluorescent-HPLC analysis of MTHF content using the. peak height of siDHFR-transfected HUVECs before FA treatments. (E) Relative quantification of the Hcy level with NC or DHFR siRNA with/without FA. Data are presented with three independent experiments as the mean ± SEM. # p < 0.05 versus NC-treated cells with 0 μM FA in the NC group, & p < 0.05 versus siDHFR-treated cells with 0 μM FA in the siDHFR group.
Figure 4
Figure 4
The effect of DHFR overexpression on Hcy regulation in HUVECs: (A) Western blot analysis for DHFR protein level using NC or siRNA-transfected HUVECs followed by pCMV-DHFR and FA treatments. (B) Relative quantification of the Hcy level of FA and pCMV-DHFR treatments after CRIF1 siRNA transfection. Data are presented with three independent experiments as the mean ± SEM. * p < 0.05 versus NC-treated cells without FA and pCMV-DHFR in the NC group, # p < 0.05 versus siCRIF1-treated cells without FA and pCMV-DHFR in the siCRIF1 group.
Figure 5
Figure 5
The levels of homocysteine, MTHF, THF, and DHFR expression in mouse endothelial cells. (A) Hcy content in lung endothelial cells and plasma from WT and CRIF1 KO mouse were measured. Relative quantitative analysis of the Hcy content is shown as a graph. (B) MTHF content of WT and KO endothelial cells were quantified by fluorescent-HPLC. Arrows on the luminescent signal indicate an MTHF peak of WT and CRIF1 KO endothelial cells, and the peak-height-based quantification of MTHF is shown as a graph (right). (C) The THF level of endothelial cells isolated from WT and CRIF1 KO mouse was quantified and is shown as a graph. (D) Western blot analysis of DHFR expression of WT and KO mouse endothelial cells. DHFR level was quantified densitometrically. Data are presented with three independent experiments as the mean ± SEM. * p < 0.05 compared with WT group.
Figure 6
Figure 6
The effect of DHFR overexpression on homocysteine and folate intermediates in mouse endothelial cells: (A) Immunofluorescence staining of DHFR (red) and CD31 (green) in the NC or siDHFR-transfected aortic endothelial surface. The scale bar indicates 10 μm. Quantification of fluorescence signal was normalized to the NC group (right). (B) DHFR expression of ex vivo transfection in mouse aortic endothelium. Immunoblotting analysis for quantifying the DHFR level is shown as a graph. (C) Relative quantification of the Hcy content in aortic endothelial cells after ex vivo transfection of siDHFR. (D,E) DHFR protein levels of WT and CRIF1 KO mouse in aortic endothelium were analyzed by immunofluorescent staining after ex vivo transfection of pCMV-DHFR, and the scale bar indicates 10 μm. Signal intensity was quantified and suggested as a graph. (F) Immunoblotting assay of ex vivo-induced DHFR transfection on aorta. Quantitative analysis of DHFR level is suggested as a graph, relatively. (G) The relative Hcy content of pCMV-DHFR treatments on aortic endothelium. Data are presented with three independent experiments as the mean ± SEM. * p < 0.05 compared with WT mice; # p < 0.05 compared with CRIF1 KO mice.

Similar articles

Cited by

References

    1. Graham I.M., Daly L.E., Refsum H.M., Robinson K., Brattstrom L.E., Ueland P.M., Palma-Reis R.J., Boers G.H., Sheahan R.G., Israelsson B., et al. Plasma homocysteine as a risk factor for vascular disease. The European Concerted Action Project. JAMA. 1997;277:1775–1781. doi: 10.1001/jama.1997.03540460039030. - DOI - PubMed
    1. Petri M., Roubenoff R., Dallal G.E., Nadeau M.R., Selhub J., Rosenberg I.H. Plasma homocysteine as a risk factor for atherothrombotic events in systemic lupus erythematosus. Lancet. 1996;348:1120–1124. doi: 10.1016/S0140-6736(96)03032-2. - DOI - PubMed
    1. Ganguly P., Alam S.F. Role of homocysteine in the development of cardiovascular disease. Nutr. J. 2015;14:6. doi: 10.1186/1475-2891-14-6. - DOI - PMC - PubMed
    1. Bautista L.E., Arenas I.A., Penuela A., Martinez L.X. Total plasma homocysteine level and risk of cardiovascular disease: A meta-analysis of prospective cohort studies. J. Clin. Epidemiol. 2002;55:882–887. doi: 10.1016/S0895-4356(02)00434-1. - DOI - PubMed
    1. Seshadri S., Beiser A., Selhub J., Jacques P.F., Rosenberg I.H., D’Agostino R.B., Wilson P.W., Wolf P.A. Plasma homocysteine as a risk factor for dementia and Alzheimer’s disease. N. Engl. J. Med. 2002;346:476–483. doi: 10.1056/NEJMoa011613. - DOI - PubMed

LinkOut - more resources