. 2021 Oct 28;10(11):1724.
doi: 10.3390/antiox10111724.

Aminoguanidine Prevents the Oxidative Stress, Inhibiting Elements of Inflammation, Endothelial Activation, Mesenchymal Markers, and Confers a Renoprotective Effect in Renal Ischemia and Reperfusion Injury

Affiliations

Aminoguanidine Prevents the Oxidative Stress, Inhibiting Elements of Inflammation, Endothelial Activation, Mesenchymal Markers, and Confers a Renoprotective Effect in Renal Ischemia and Reperfusion Injury

Consuelo Pasten et al. Antioxidants (Basel). .

Abstract

Oxidative stress produces macromolecules dysfunction and cellular damage. Renal ischemia-reperfusion injury (IRI) induces oxidative stress, inflammation, epithelium and endothelium damage, and cessation of renal function. The IRI is an inevitable process during kidney transplantation. Preliminary studies suggest that aminoguanidine (AG) is an antioxidant compound. In this study, we investigated the antioxidant effects of AG (50 mg/kg, intraperitoneal) and its association with molecular pathways activated by IRI (30 min/48 h) in the kidney. The antioxidant effect of AG was studied measuring GSSH/GSSG ratio, GST activity, lipoperoxidation, iNOS, and Hsp27 levels. In addition, we examined the effect of AG on elements associated with cell survival, inflammation, endothelium, and mesenchymal transition during IRI. AG prevented lipid peroxidation, increased GSH levels, and recovered the GST activity impaired by IRI. AG was associated with inhibition of iNOS, Hsp27, endothelial activation (VE-cadherin, PECAM), mesenchymal markers (vimentin, fascin, and HSP47), and inflammation (IL-1β, IL-6, Foxp3, and IL-10) upregulation. In addition, AG reduced kidney injury (NGAL, clusterin, Arg-2, and TFG-β1) and improved kidney function (glomerular filtration rate) during IRI. In conclusion, we found new evidence of the antioxidant properties of AG as a renoprotective compound during IRI. Therefore, AG is a promising compound to treat the deleterious effect of renal IRI.

Keywords: aminoguanidine; antioxidants; ischemia-reperfusion injury; oxidative stress; renal protection.


Conflict of interest statement

The authors declare no conflict of interest.

Figures

Figure 1
Figure 1
AG prevented the kidney damage induced by renal IRI. BALB/c mice were treated with either vehicle or AG (50 mg/kg i.p) before sham or ischemia-reperfusion (IR) surgery and subjected to 30 min of ischemia and 48 h of reperfusion. (A) GFR (µL/min/100 g body weight) was determined in sham (n = 5), IR (n = 6), AG-sham (n = 5), and AG-IR (n = 6). (B) Neutrophil gelatinase-associated lipocalin (NGAL) was measured by ELISA in blood samples in sham (n = 9), IR (n = 6), AG-sham (n = 5), and AG-IR (n = 6). The bar graphs represent mean ± SEM, and the data were analyzed using ANOVA and non-parametric Kruskal–Wallis test. * p < 0.05 and ** p < 0.005. (C) Histological analysis: representative hematoxylin/eosin (H/E) staining of the cortex and the medulla kidney sections. Yellow arrows indicate areas with evident kidney acute tubular necrosis (ATN) characterized by loss of nucleus in tubules or intratubular cellular detritus. Three kidneys for each protocol were analyzed. Representative images correspond to 400X scale bar = 50 µm.
Figure 2
Figure 2
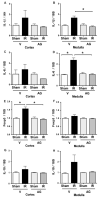
AG inhibited the IL-1β, IL-6, Foxp3, and IL-10 mRNA upregulation observed during IR. BALB/c mice were treated with either vehicle or AG (50 mg/kg i.p) before sham or subjected to 30 min of ischemia and 48 h of reperfusion (IR). Cytokine expression was determined by qPCR in sham (n = 5), IR (n = 5), AG-sham (n = 6), and AG-IR (n = 6). (A) IL-1β mRNA in the cortex. (B) IL-1β mRNA in the medulla. (C) IL-6 mRNA in the cortex. (D) IL-6 mRNA in the medulla. (E) Foxp3 mRNA in the cortex. (F) Foxp3 mRNA in the medulla. (G) IL-10 mRNA in the cortex. (H) IL-10 mRNA in the medulla. The bar graphs represent mean ± SEM, and the data were analyzed using ANOVA and non-parametric Kruskal–Wallis test. * p < 0.05.
Figure 3
Figure 3
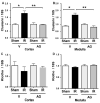
AG inhibited the upregulation of clusterin mRNA observed during IR, but not for klotho. BALB/c mice were treated with either vehicle or AG (50 mg/kg i.p) before sham or subjected to 30 min of ischemia and 48 h of reperfusion (IR). The clusterin and the klotho mRNA expressions were determined by qPCR in sham (n = 5), IR (n = 5), AG-sham (n = 6), and AG-IR (n = 6). (A) Clusterin mRNA in the cortex. (B) Clusterin mRNA in the medulla. (C) Klotho mRNA in the cortex (D) Klotho mRNA in the medulla. The bar graphs represent mean ± SEM, and the data were analyzed using ANOVA and non-parametric Kruskal–Wallis test. * p < 0.05, ** p < 0.005.
Figure 4
Figure 4
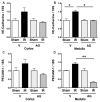
AG inhibited the upregulation of Arg-2 and TGF-β1 mRNA observed during IR. BALB/c mice were treated with either vehicle or AG (50 mg/kg i.p) before sham or subjected to 30 min of ischemia and 48 h of reperfusion (IR). The Arg-2 and the TGF-β1 mRNA expressions were determined by qPCR in sham (n = 5), IR (n = 5), AG-sham (n = 6), and AG-IR (n = 6). (A) Arg-2 mRNA in the cortex. (B) Arg-2 mRNA in the medulla. (C) TGF-β1 mRNA in the cortex (D) TGF-β1 mRNA in the medulla. The bar graphs represent mean ± SEM, and the data were analyzed using ANOVA and Kruskal–Wallis test. * p < 0.05, ** p < 0.005.
Figure 5
Figure 5
AG ameliorated the oxidative stress induced by renal IR. BALB/c mice were treated with either vehicle or AG (50 mg/kg i.p) before sham or IR surgery and subjected to 30 min of ischemia and 48 h of reperfusion. GSH:GSSG ratio, GST activity, and TBARS (lipoperoxidation) were determined in whole kidneys in sham (n = 5), IR (n = 5), and AG-IR (n = 6) (A) GSH:GSSG ratio. (B) Glutathione S-transferase (GST) activity. (C) Thiobarbituric acid reactive substances (TBARS) levels. Bar graph represents mean ± SEM, and data were analyzed by ANOVA non-parametric Kruskal–Wallis analysis, * p < 0.05, ** p < 0.005, *** p < 0.0005.
Figure 6
Figure 6
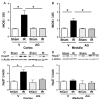
AG inhibited upregulation of iNOS and Hsp27 observed during IR. BALB/c mice were treated with AG (50 mg/kg i.p.) before sham or subjected to 30 min of ischemia and 48 h of reperfusion (IR). The iNOS mRNA expression was determined by qPCR and Hsp27 protein by Western blot in sham (n = 5), IR (n = 5), AG-sham (n = 6), and AG-IR (n = 6). (A) INOS mRNA in the cortex. (B) INOS mRNA in the medulla. (C) Hsp27 protein in the cortex. (D) Hsp27 protein in the medulla. The bar graph represents mean ± SEM, and the data were analyzed by using ANOVA and non-parametric Kruskal–Wallis test. * p < 0.05.
Figure 7
Figure 7
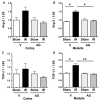
AG prevented VE-cadherin and PECAM upregulation induced by IR. BALB/c mice were treated with either vehicle or AG (50 mg/kg i.p) before sham or subjected to 30 min of ischemia and 48 h of reperfusion. VE-cadherin and PECAM-1 expressions were determined by qPCR in sham (n = 5), IR (n = 5), AG-sham (n = 6), and AG-IR (n = 6). (A) VE-cadherin mRNA in the cortex. (B) VE-cadherin mRNA in the medulla. (C) PECAM-1 mRNA in the cortex. (D) PECAM-1 mRNA in the medulla. The bar graph represents mean ± SEM using ANOVA non-parametric Kruskal–Wallis test. * p < 0.05, ** p < 0.005.
Figure 8
Figure 8
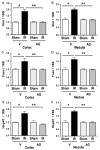
AG inhibited vimentin, fascin, and Hsp47 mRNA upregulation during IR. BALB/c mice were treated with either vehicle or AG (50 mg/kg i.p) before sham or subjected to 30 min of ischemia and 48 h of reperfusion (IR). Vimentin, fascin, and Hsp47 mRNA expression were determined by qPCR in sham (n = 5), IR (n = 5), AG-sham (n = 6), and AG-IR (n = 6). (A) Vimentin mRNA in the cortex. (B) Vimentin mRNA in the medulla (C) Fascin mRNA in the cortex. (D) Fascin mRNA in the medulla. (E) Hsp47 mRNA in the cortex. (F) Hsp47 mRNA in the medulla. The bar graph represents mean ± SEM, and the data were analyzed using ANOVA non-parametric Kruskal–Wallis test. * p < 0.05, ** p < 0.005.

Similar articles

Cited by

References

    1. Itakura M., Yoshikawa H., Bannai C., Kato M., Kunika K., Kawakami Y., Yamaoka T., Yamashita K. Aminoguanidine decreases urinary albumin and high-molecular-weight proteins in diabetic rats. Life Sci. 1991;49:889–897. doi: 10.1016/0024-3205(91)90174-A. - DOI - PubMed
    1. Luo D., Fan Y., Xu X. The effects of aminoguanidine on retinopathy in STZ-induced diabetic rats. Bioorg. Med. Chem. Lett. 2012;22:4386–4390. doi: 10.1016/j.bmcl.2012.04.130. - DOI - PubMed
    1. Yagihashi S., Kamijo M., Baba M., Yagihashi N., Nagai K. Effect of aminoguanidine on functional and structural abnormalities in peripheral nerve of STZ-induced diabetic rats. Diabetes. 1992;41:47–52. doi: 10.2337/diab.41.1.47. - DOI - PubMed
    1. Yamagishi S., Nakamura N., Suematsu M., Kaseda K., Matsui T. Advanced Glycation End Products: A Molecular Target for Vascular Complications in Diabetes. Mol. Med. 2015;21:S32–S40. doi: 10.2119/molmed.2015.00067. - DOI - PMC - PubMed
    1. Schalkwijk C.G., Miyata T. Early- and advanced non-enzymatic glycation in diabetic vascular complications: The search for therapeutics. Amino Acids. 2012;42:1193–1204. doi: 10.1007/s00726-010-0779-9. - DOI - PMC - PubMed