. 2021 Nov 10;10(11):1796.
doi: 10.3390/antiox10111796.

γ-Glutamyl-Transpeptidase-Resistant Glutathione Analog Attenuates Progression of Alzheimer's Disease-like Pathology and Neurodegeneration in a Mouse Model

Affiliations

γ-Glutamyl-Transpeptidase-Resistant Glutathione Analog Attenuates Progression of Alzheimer's Disease-like Pathology and Neurodegeneration in a Mouse Model

Ye In Christopher Kwon et al. Antioxidants (Basel). .

Abstract

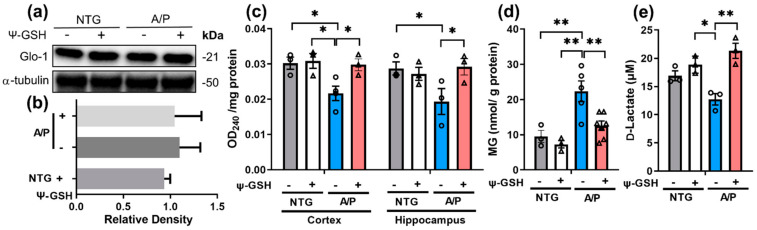
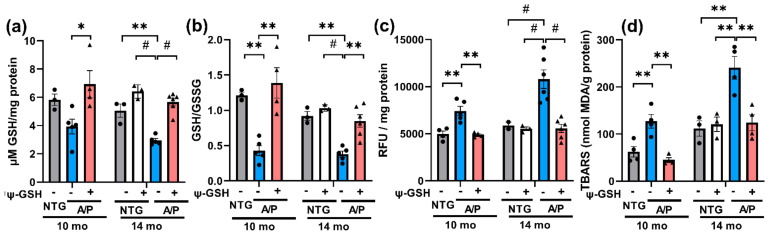
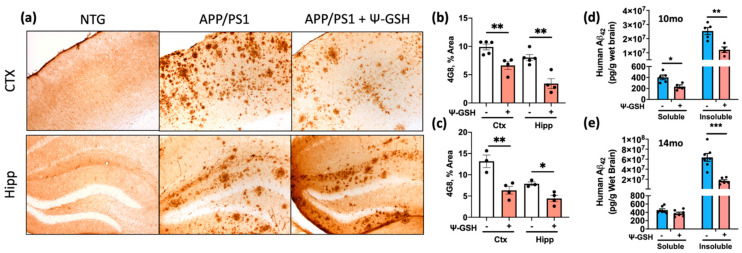
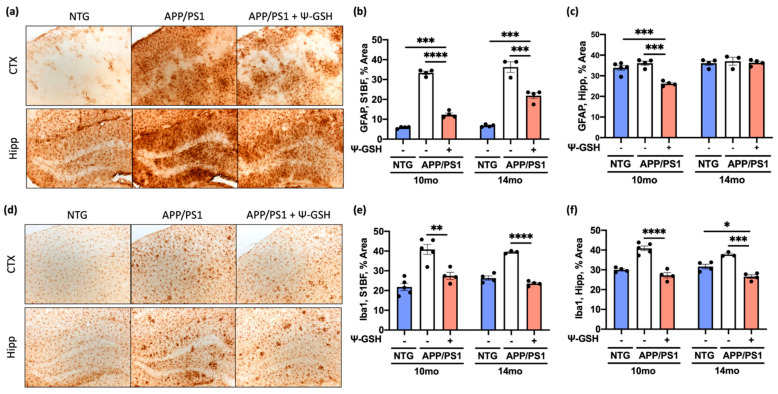
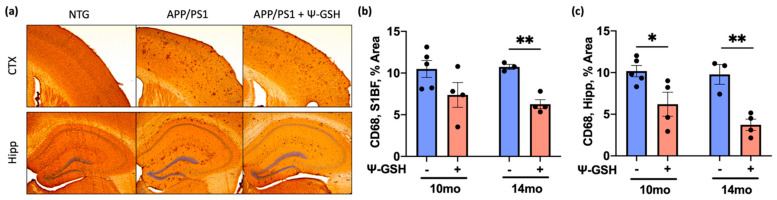
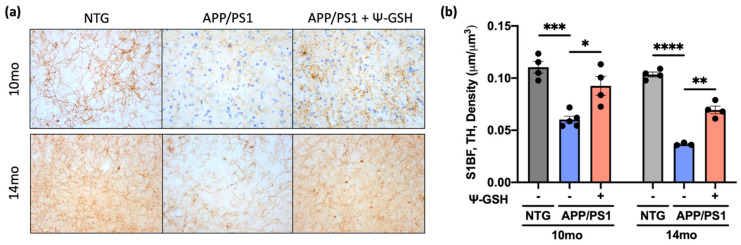
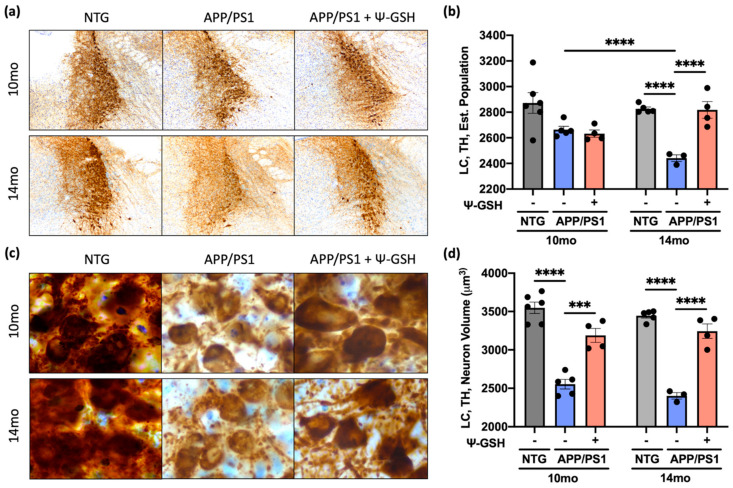
Oxidative stress in Alzheimer's disease (AD) is mediated, in part, by the loss of glutathione (GSH). Previous studies show that γ-glutamyl transpeptidase (GGT)-resistant GSH analog, Ψ-GSH, improves brain GSH levels, reduces oxidative stress markers in brains of APP/PS1 transgenic mice, a mouse model of AD, and attenuates early memory deficits in the APP/PS1 model. Herein, we examined whether Ψ-GSH can attenuate the disease progression when administered following the onset of AD-like pathology in vivo. Cohorts of APP/PS1 mice were administered Ψ-GSH for 2 months starting at 8 month or 12 months of age. We show that Ψ-GSH treatment reduces indices of oxidative stress in older mice by restoration of enzyme glyoxalase-1 (Glo-1) activity and reduces levels of insoluble Aβ. Quantitative neuropathological analyses show that Ψ-GSH treatment significantly reduces Aβ deposition and brain inflammation in APP/PS1 mice compared to vehicle-treated mice. More importantly, Ψ-GSH treatment attenuated the progressive loss of cortical TH+ afferents and the loss of TH+ neurons in the locus coeruleus (LC). Collectively, the results show that Ψ-GSH exhibits significant antioxidant activity in aged APP/PS1 mice and chronic Ψ-GSH treatment administered after the onset of AD pathology can reverse/slow further progression of AD-like pathology and neurodegeneration in vivo.

Keywords: Alzheimer’s disease; advanced glycation end products (AGEs); glyoxalase 1; neuroinflammation; oxidative stress; progressive neurodegeneration.


Conflict of interest statement

S.S.M. and R.V. are named inventors on the patent application relating to ψ-GSH and its analogs as treatment options of neurodegenerative disorders.

Figures

Figure 1
Figure 1
Restoration of Glo-1 enzyme activity after ψ-GSH treatment in symptomatic 14-mo-old APP/PS1 mice. Western blot analysis of the prefrontal cortex brain tissue of NTG and APP/PS1 (A/P) mice treated with saline (-) or ψ-GSH (+) for: (a) expression of Glo-1 protein and (b) quantification of Western blot in (a). (c) Endogenous Glo-1 activity was reduced in the cortex and the hippocampus of the vehicle-treated APP/PS1 mice compared to NTG controls. ψ-GSH treatment resuscitated Glo-1 function. (d) Increased MG levels in APP/PS1 mice and reduction in MG levels in ψ-GSH-treated APP/PS1 mice. (e) Levels of the product of the Glo-1 enzymatic reaction, d-lactate, were increased in the APP/PS1- ψ-GSH group compared to the saline controls, confirming in vivo enhancement of the Glo-1 pathway by ψ-GSH. Data are presented as the mean ± S.E.M. NTG, Saline- and ψ-GSH-treated APP/PS1 groups were compared with a one-way ANOVA with Tukey’s post-hoc test for statistical analysis. * p < 0.05, ** p < 0.01.
Figure 2
Figure 2
ψ-GSH treatment reverses oxidative stress in the APP/PS1 model. (a) ψ-GSH treatment restored the levels of reduced GSH to NTG controls. (b) Attenuation of oxidative stress was evident from enhanced redox potential in mice after ψ-GSH treatment in both symptomatic cohorts. (c) Total oxidative stress as measured by DCFH-DA assay was also mitigated by ψ-GSH in these mice irrespective of age. (d) TBARS results are shown as the mean ± S.E.M. Statistical significance was assessed by a one-way ANOVA with Tukey’s post-hoc test. * p < 0.05, ** p < 0.01, # p < 0.001.
Figure 3
Figure 3
ψ-GSH treatment reduces Aβ burden in symptomatic 10-mo-old APP/PS1 mice. (a) Representative images of Aβ plaques visualized using 4G8 antibody in S1BF cortex and dentate gyrus of 14-mo NTG and APP/PS1 mice. Scale bar, 100 μm; (b) levels of Aβ plaques are significantly reduced in S1BF and hippocampus in ψ-GSH-treated 10-mo APP/PS1 mice (n = 5 APP/PS1 + Saline; n = 4 APP/PS1 + ψ-GSH); (c) levels of Aβ plaques are significantly reduced in S1BF and hippocampus in ψ-GSH-treated 14-mo APP/PS1 mice (n = 3 APP/PS1 + Saline; n = 4 APP/PS1 + ψ-GSH); (d,e) quantitation of the effect of ψ-GSH treatment on amyloid load in APP/PS1 mice using ELISA assay. Levels of insoluble Aβ1–42 levels in the brain homogenate of mice treated with ψ-GSH were significantly reduced in both 10-mo (d) and 14-mo (e) cohorts. For comparisons between saline and ψ-GSH-treated APP/PS1 groups (b,c), an unpaired Student’s t-test was performed for statistical analysis. * p < 0.05, ** p < 0.01, *** p < 0.005.
Figure 4
Figure 4
ψ-GSH treatment reduces reactive astrogliosis and microglial reactivity in symptomatic 10- and 14-mo APP/PS1 mice. (a) Representative images of reactive astrocytes visualized by GFAP antibody in dentate gyrus of 14-mo NTG and APP/PS1 mice. Scale bar, 100 μm. (b) Quantification of GFAP staining in S1BF of the 10-, 14-mo cohorts. (c) Quantification of GFAP staining in the hippocampus of the 10-, 14-mo cohorts. (d) Representative images of microglia visualized using Iba1 antibody in S1BF cortex of 14-mo NTG and APP/PS1 mice. Scale bar, 100 μm. (e) Quantification of Iba1 staining in S1BF of the 10-, 14-mo cohorts. (f) Quantification of Iba1 staining in the hippocampus of the 10-, 14-mo cohorts. Data are presented as mean ± S.E.M. For comparisons between NTG, saline-, and ψ-GSH-treated APP/PS1 groups, a one-way ANOVA with Tukey’s post-hoc test was used for data analysis. * p < 0.05, ** p < 0.01, *** p < 0.005, **** p < 0.001.
Figure 5
Figure 5
ψ-GSH treatment effectively reduces CD68-positive activated microgliosis in symptomatic 14-mo-old APP/PS1 mice. (a) Representative images of CD68 antibody positive microglia in the S1BF region of the cortex and the dorsal hippocampus of 14 months-old saline-treated NTG and APP/PS1 mice treated with either saline or ψ-GSH. (b) Quantification of CD68-positive immunostained area coverage of the S1BF region of the cortex in 10- and 14-mo-old APP/PS1 mice either treated with saline or ψ-GSH. (c) Quantification of CD68-positive immunostained area coverage of the hippocampus in 10- and 14-mo APP/PS1 mice either treated with saline or ψ-GSH. For comparisons between saline and ψ-GSH-treated APP/PS1 groups (b,c), an unpaired Student’s t-test was performed for statistical analysis. * p < 0.05, ** p < 0.01.
Figure 6
Figure 6
ψ-GSH treatment after the onset of AD-like neuropathology halts the progressive degeneration of the NAergic cortical afferent axons in symptomatic 10- and 14-mo APP/PS1 mice. (a) Representative images of TH+ axonal projections in S1BF of both the 10- and the 14-mo cohorts. Scale bar, 20 μm. (b) Quantification of TH+ axonal density in 10- and 14-mo NTG and APP/PS1 mice treated with either saline or ψ-GSH. Density estimation (μm/μm3) was determined using the Spherical probe on Stereo Investigator Software. Data are presented as mean ± S.E.M. A one-way ANOVA with Tukey’s post-hoc test was used for statistical comparisons (b). * p < 0.05, ** p < 0.01, *** p < 0.005, **** p < 0.001.
Figure 7
Figure 7
ψ-GSH treatment after the onset of AD-like neuropathology halts the progressive degeneration of the NAergic neurons of the LC in symptomatic 10 and 14-mo APP/PS1 mice. (a) Representative images of TH+ neurons of the LC in both the 10 and 14-mo cohorts. Scale bar, 100 μm. (b) Quantification of TH+ neurons in the LC in 10- and 14-mo NTG and APP/PS1 mice treated with either saline or ψ-GSH. Estimated population was determined by the Optical Fractionator probe on Stereo Investigator software. (c) Higher magnification images of the TH+ neurons in the LC. Scale bar, 50 μm. (d) Quantification of the TH+ neuronal volume in 10- and 14-mo NTG and APP/PS1 mice treated with either saline or ψ-GSH. Data are presented as mean ± S.E.M. A one-way ANOVA with Tukey’s post-hoc test was used for statistical comparisons (b,d). *** p < 0.005, **** p < 0.001.

References

    1. 2021 Alzheimer’s disease facts and figures. Alzheimer’s Dement. 2021;17:327–406. doi: 10.1002/alz.12328. - DOI - PubMed
    1. Sisodia S.S., George-Hyslop P.S. γ-Secretase, notch, Aβ and alzheimer’s disease: Where do the presenilins fit in? Nat. Rev. Neurosci. 2002;3:281–290. doi: 10.1038/nrn785. - DOI - PubMed
    1. Cummings J.L., Morstorf T., Zhong K. Alzheimer’s disease drug-development pipeline: Few candidates, frequent failures. Alzheimer’s Res. Ther. 2014;6:37. doi: 10.1186/alzrt269. - DOI - PMC - PubMed
    1. Huang W.-J., Zhang X., Chen W.-W. Role of oxidative stress in Alzheimer’s disease. Biomed. Rep. 2016;4:519–522. doi: 10.3892/br.2016.630. - DOI - PMC - PubMed
    1. Cai Z., Liu N., Wang C., Qin B., Zhou Y., Xiao M., Chang L., Yan L.-J., Zhao B. Role of RAGE in Alzheimer’s Disease. Cell. Mol. Neurobiol. 2016;36:483–495. doi: 10.1007/s10571-015-0233-3. - DOI - PMC - PubMed

LinkOut - more resources