. 2021 Nov 6;9(11):1630.
doi: 10.3390/biomedicines9111630.

Antiangiogenic Properties of Axitinib versus Sorafenib Following Sunitinib Resistance in Human Endothelial Cells-A View towards Second Line Renal Cell Carcinoma Treatment

Affiliations

Antiangiogenic Properties of Axitinib versus Sorafenib Following Sunitinib Resistance in Human Endothelial Cells-A View towards Second Line Renal Cell Carcinoma Treatment

Eva Juengel et al. Biomedicines. .

Abstract

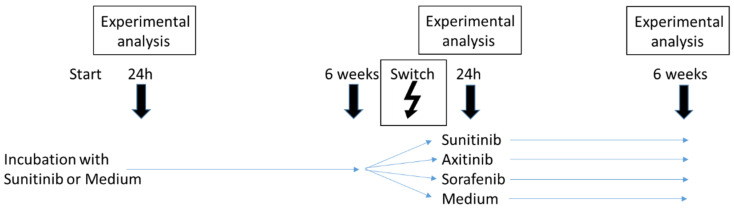
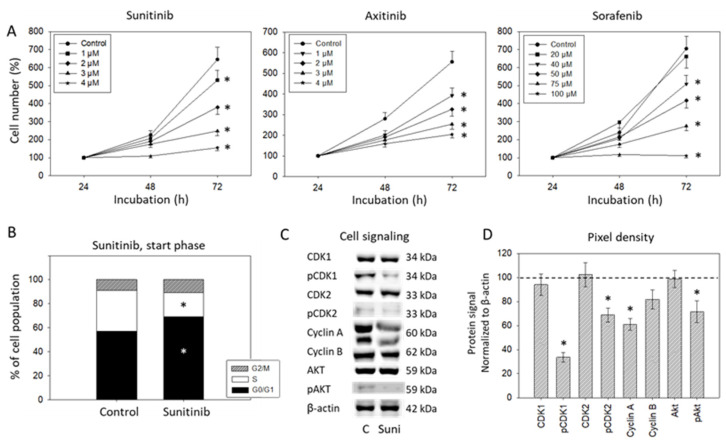
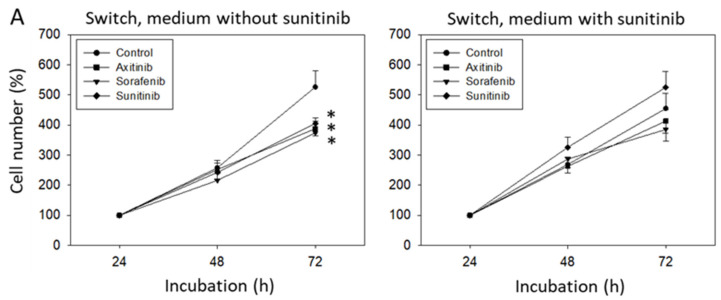
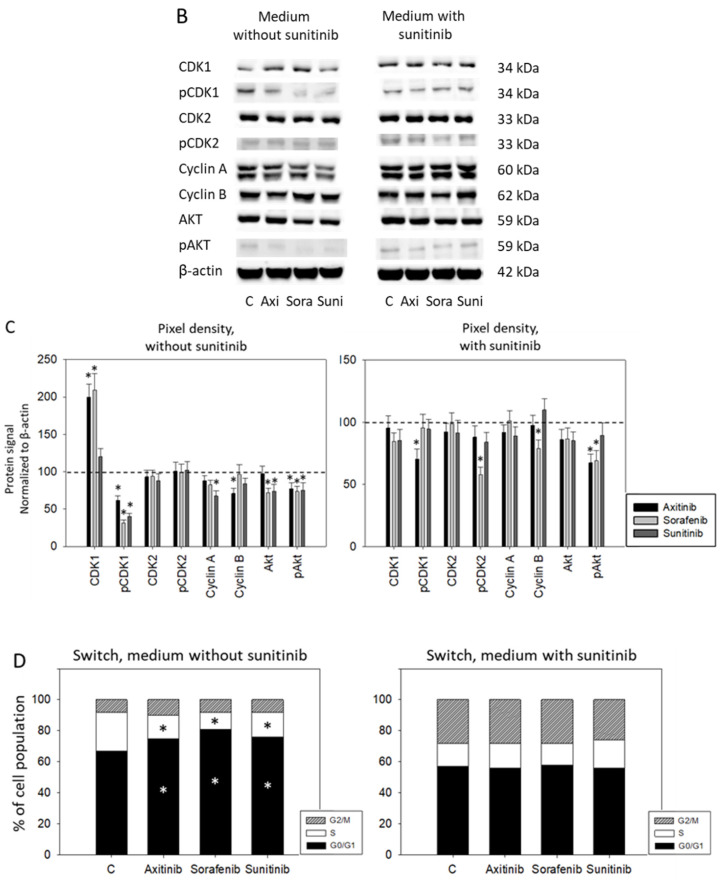
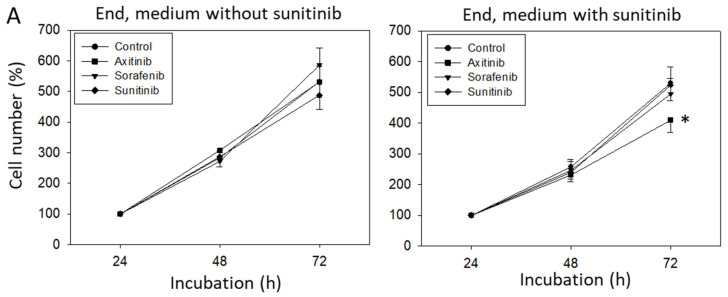
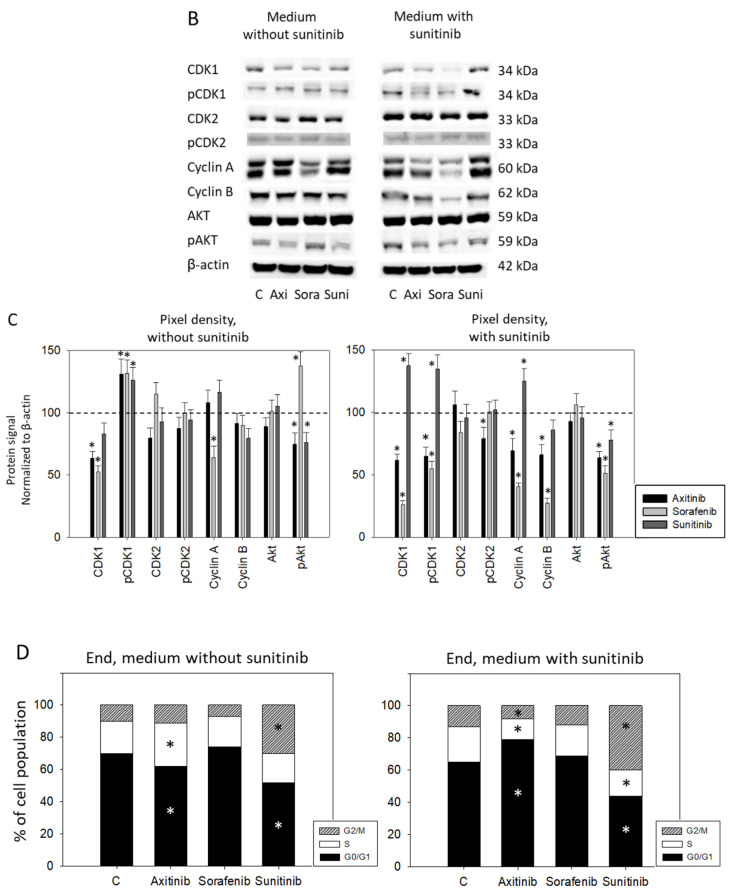
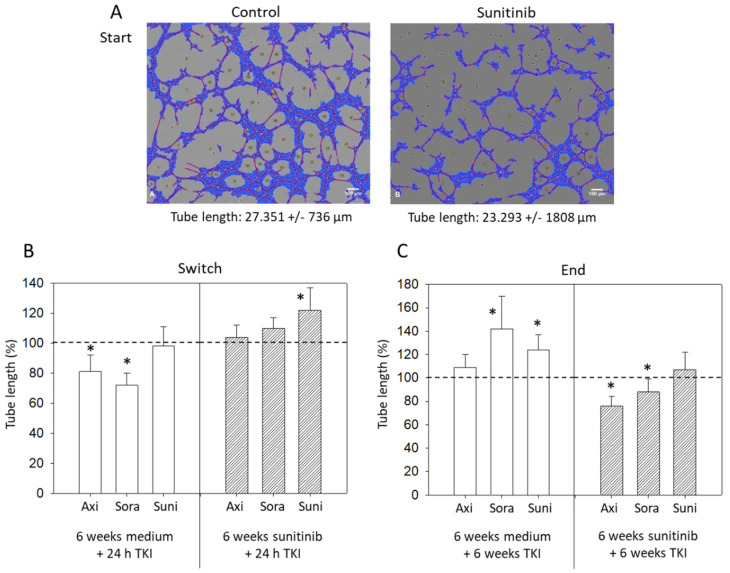
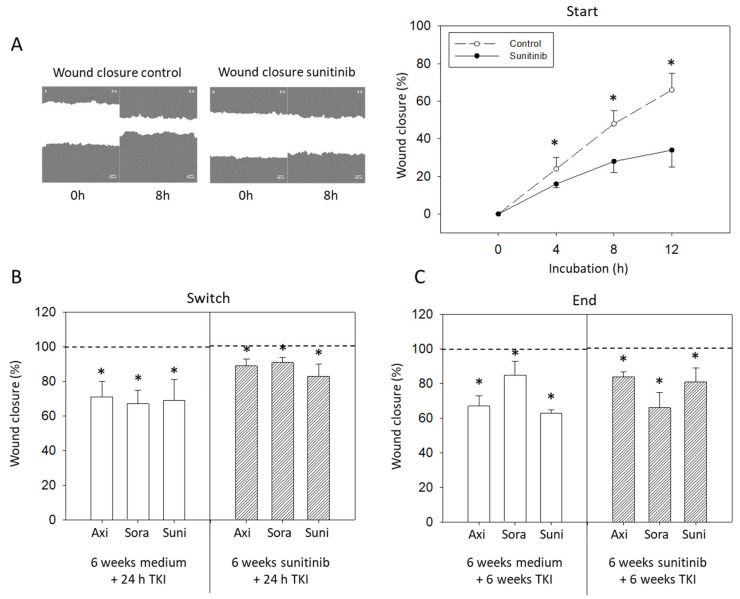
Tyrosine kinase inhibitors (TKIs) and immune checkpoint inhibitors predominate as first-line therapy options for renal cell carcinoma. When first-line TKI therapy fails due to resistance development, an optimal second-line therapy has not yet been established. The present investigation is directed towards comparing the anti-angiogenic properties of the TKIs, sorafenib and axitinib on human endothelial cells (HUVECs) with acquired resistance towards the TKI sunitinib. HUVECs were driven to resistance by continuously exposing them to sunitinib for six weeks. They were then switched to a 24 h or further six weeks treatment with sorafenib or axitinib. HUVEC growth, as well as angiogenesis (tube formation and scratch wound assay), were evaluated. Cell cycle proteins of the CDK-cyclin axis (CDK1 and 2, total and phosphorylated, cyclin A and B) and the mTOR pathway (AKT, total and phosphorylated) were also assessed. Axitinib (but not sorafenib) significantly suppressed growth of sunitinib-resistant HUVECs when they were exposed for six weeks. This axinitib-associated growth reduction was accompanied by a cell cycle block at the G0/G1-phase. Both axitinib and sorafenib reduced HUVEC tube length and prevented wound closure (sorafenib > axitinib) when applied to sunitinib-resistant HUVECs for six weeks. Protein analysis revealed diminished phosphorylation of CDK1, CDK2 and pAKT, accompanied by a suppression of cyclin A and B. Both drugs modulated CDK-cyclin and AKT-dependent signaling, associated either with both HUVEC growth and angiogenesis (axitinib) or angiogenesis alone (sorafenib). Axitinib and sorafenib may be equally applicable as second line treatment options, following sunitinib resistance.

Keywords: endothelial cells; renal cell carcinoma; resistance; second-line; tyrosine kinase inhibitors.


Conflict of interest statement

The authors declare no conflict of interest.

Figures

Figure 1
Figure 1
Schematic illustration of the study protocol.
Figure 2
Figure 2
(A) Dose-response analysis. HUVECs were incubated with different concentrations of sunitinib, axitinib or sorafenib, and cell number was evaluated after 24 (100%), 48 and 72 h by MTT assay. Means and standard deviation are indicated, n = 3, * = p ≤ 0.05. (B) Influence of 2 µM sunitinib on G0/G1-, S- and G2/M-phases of the cell cycle in HUVEC after 24 h (n = 3). * indicates significant difference to untreated controls. (C) Protein profile of cell-cycle-regulating proteins after exposure to 2 µM sunitinib (Suni). Controls (C) were untreated (0 µM sunitinib). One representative of three separate experiments is shown. Each protein analysis was accompanied by a β-actin loading control. One representative internal control is shown. (D) The ratio of protein intensity/β-actin intensity was calculated and expressed as a percentage of the controls, set to 100%. * indicates significant difference to controls, p ≤ 0.05. n = 3.
Figure 3
Figure 3
(A) Cell growth analysis by the MTT assay. HUVECs were incubated with sunitinib for 6 weeks and then switched to axitinib or sorafenib for 24 h (Switch, medium with sunitinib). In parallel, HUVECs were incubated with sunitinib for 6 weeks and incubated for a further 24 h with sunitinib (Sunitinib) or with culture medium alone (Control). Figure 3A, “Switch, medium without sunitinib” indicates cell growth behavior of HUVECs incubated with medium alone for 6 weeks and then switched to axitinib or sorafenib for 24 h. In parallel, HUVECs were incubated with cell culture medium for 6 weeks and then incubated for a further 24 h with sunitinib (Sunitinib) or with culture medium alone (Control). * indicates significant difference to untreated controls (n = 6). (B) Protein profile of cell-cycle-regulating proteins after 6 weeks sunitinib (medium with sunitinib) or cell culture medium alone (medium without sunitinib) followed by a 24 h switch to axitinib (Axi), sorafenib (Sora), to further 24 h sunitinib (Suni) or 24 h culture medium alone (C). Each protein analysis was accompanied by a β-actin loading control. One representative internal control is shown. (C) The ratio of protein intensity/β-actin intensity was calculated and expressed as a percentage of the controls, set to 100%. * indicates significant difference to controls, p ≤ 0.05. n = 3. (D) Cell cycle analysis after 6 weeks incubation with sunitinib (Switch, medium with sunitinib) or cell culture medium alone (Switch, medium without sunitinib) and subsequent 24 h incubation with axitinib, sorafenib, sunitinib or culture medium alone (C) (n = 3). * indicates significant difference to the untreated controls.
Figure 3
Figure 3
(A) Cell growth analysis by the MTT assay. HUVECs were incubated with sunitinib for 6 weeks and then switched to axitinib or sorafenib for 24 h (Switch, medium with sunitinib). In parallel, HUVECs were incubated with sunitinib for 6 weeks and incubated for a further 24 h with sunitinib (Sunitinib) or with culture medium alone (Control). Figure 3A, “Switch, medium without sunitinib” indicates cell growth behavior of HUVECs incubated with medium alone for 6 weeks and then switched to axitinib or sorafenib for 24 h. In parallel, HUVECs were incubated with cell culture medium for 6 weeks and then incubated for a further 24 h with sunitinib (Sunitinib) or with culture medium alone (Control). * indicates significant difference to untreated controls (n = 6). (B) Protein profile of cell-cycle-regulating proteins after 6 weeks sunitinib (medium with sunitinib) or cell culture medium alone (medium without sunitinib) followed by a 24 h switch to axitinib (Axi), sorafenib (Sora), to further 24 h sunitinib (Suni) or 24 h culture medium alone (C). Each protein analysis was accompanied by a β-actin loading control. One representative internal control is shown. (C) The ratio of protein intensity/β-actin intensity was calculated and expressed as a percentage of the controls, set to 100%. * indicates significant difference to controls, p ≤ 0.05. n = 3. (D) Cell cycle analysis after 6 weeks incubation with sunitinib (Switch, medium with sunitinib) or cell culture medium alone (Switch, medium without sunitinib) and subsequent 24 h incubation with axitinib, sorafenib, sunitinib or culture medium alone (C) (n = 3). * indicates significant difference to the untreated controls.
Figure 4
Figure 4
(A) Cell growth analysis by the MTT assay. HUVECs were incubated with sunitinib for 6 weeks and then switched to axitinib or sorafenib for a further 6 weeks (End, medium with sunitinib). In parallel, HUVECs were incubated with sunitinib for 6 weeks and incubated for a further 6 weeks with sunitinib (Sunitinib) or with culture medium alone (Control). Figure 4A, “End, medium without sunitinib” indicates cell growth behavior of HUVECs incubated with medium alone for 6 weeks and then switched to axitinib or sorafenib for 6 weeks. In parallel, HUVECs were incubated with cell culture medium for 6 weeks and then incubated for a further 6 weeks with sunitinib (Sunitinib) or with culture medium alone (Control). * indicates significant difference to untreated controls (n = 6). (B) Protein profile of cell-cycle-regulating proteins after 6 weeks sunitinib (Medium with sunitinib) or cell culture medium alone (Medium without sunitinib) followed by a 6 week switch to axitinib (Axi), sorafenib (Sora), to a further 6 weeks sunitinib (Suni) or 6 weeks culture medium alone (C). Each protein analysis was accompanied by a β-actin loading control. One representative internal control is shown. (C) The ratio of protein intensity/β-actin intensity was calculated and expressed as a percentage of the controls, set to 100%. * indicates significant difference to controls, p ≤ 0.05. n = 3. (D) Cell cycle analysis after 6 weeks incubation with sunitinib (End, medium with sunitinib) or cell culture medium alone (End, medium without sunitinib) and subsequent 6 week incubation with axitinib, sorafenib, sunitinib or culture medium alone (C) (n = 3). * indicates significant difference to untreated controls.
Figure 4
Figure 4
(A) Cell growth analysis by the MTT assay. HUVECs were incubated with sunitinib for 6 weeks and then switched to axitinib or sorafenib for a further 6 weeks (End, medium with sunitinib). In parallel, HUVECs were incubated with sunitinib for 6 weeks and incubated for a further 6 weeks with sunitinib (Sunitinib) or with culture medium alone (Control). Figure 4A, “End, medium without sunitinib” indicates cell growth behavior of HUVECs incubated with medium alone for 6 weeks and then switched to axitinib or sorafenib for 6 weeks. In parallel, HUVECs were incubated with cell culture medium for 6 weeks and then incubated for a further 6 weeks with sunitinib (Sunitinib) or with culture medium alone (Control). * indicates significant difference to untreated controls (n = 6). (B) Protein profile of cell-cycle-regulating proteins after 6 weeks sunitinib (Medium with sunitinib) or cell culture medium alone (Medium without sunitinib) followed by a 6 week switch to axitinib (Axi), sorafenib (Sora), to a further 6 weeks sunitinib (Suni) or 6 weeks culture medium alone (C). Each protein analysis was accompanied by a β-actin loading control. One representative internal control is shown. (C) The ratio of protein intensity/β-actin intensity was calculated and expressed as a percentage of the controls, set to 100%. * indicates significant difference to controls, p ≤ 0.05. n = 3. (D) Cell cycle analysis after 6 weeks incubation with sunitinib (End, medium with sunitinib) or cell culture medium alone (End, medium without sunitinib) and subsequent 6 week incubation with axitinib, sorafenib, sunitinib or culture medium alone (C) (n = 3). * indicates significant difference to untreated controls.
Figure 5
Figure 5
(A) Tube formation after 24 h sunitinib exposure, compared to untreated controls. One representative figure and the mean tube length of treated versus untreated HUVECs are shown (n = 3). Blue = cell covered area, red = tubes, yellow = branching points. (B) Evaluation of tube length after 6 weeks sunitinib (6 weeks sunitinib + 24 h TKI) or cell culture medium (6 weeks medium + 24 h TKI) followed by 24 h axitinib, sorafenib or sunitinib (Switch). Untreated controls were set to 100%. * indicates significant difference to the untreated controls. (C) Evaluation of tube length after 6 weeks sunitinib (6 weeks sunitinib + 6 weeks TKI) or cell culture medium (6 weeks medium + 6 weeks TKI) followed by 6 weeks axitinib, sorafenib or sunitinib (End). Untreated controls were set to 100%. * indicates significant difference to untreated controls.
Figure 6
Figure 6
(A) Wound closure analyzed after 24 h sunitinib exposure and compared to untreated controls. One representative figure and the mean wound closure of treated versus untreated HUVECs are shown (n = 3). (B) Evaluation of wound closure after 6 weeks sunitinib (6 weeks sunitinib + 24 h TKI) or cell culture medium (6 weeks medium + 24 h TKI) followed by 24 h axitinib, sorafenib or sunitinib (Switch). Untreated controls were set to 100%. * indicates significant difference to the untreated controls. (C) Evaluation of wound closure after 6 weeks sunitinib (6 weeks sunitinib + 6 weeks TKI) or cell culture medium (6 weeks medium + 6 weeks TKI) followed by 6 weeks axitinib, sorafenib or sunitinib (End). Untreated controls were set to 100%. * indicates significant difference to the untreated controls.

References

    1. Siegel R.L., Miller K.D., Jemal A. Cancer statistics, 2020. CA Cancer J. Clin. 2020;70:7–30. doi: 10.3322/caac.21590. - DOI - PubMed
    1. Kroeger N., Choueiri T.K., Lee J.L., Bjarnason G.A., Knox J.J., MacKenzie M.J., Wood L., Srinivas S., Vaishamayan U.N., Rha S.Y., et al. Survival outcome and treatment response of patients with late relapse from renal cell carcinoma in the era of targeted therapy. Eur. Urol. 2014;65:1086–1092. doi: 10.1016/j.eururo.2013.07.031. - DOI - PubMed
    1. Aeppli S., Schmaus M., Eisen T., Escudier B., Grünwald V., Larkin J., McDermott D., Oldenburg J., Porta C., Rini B.I., et al. First-line treatment of metastatic clear cell renal cell carcinoma: A decision-making analysis among experts. ESMO Open. 2021;6:100030. doi: 10.1016/j.esmoop.2020.100030. - DOI - PMC - PubMed
    1. Li W., Feng C., Di W., Hong S., Chen H., Ejaz M., Yang Y., Xu T.R. Clinical use of vascular endothelial growth factor receptor inhibitors for the treatment of renal cell carcinoma. Eur. J. Med. Chem. 2020;200:112482. doi: 10.1016/j.ejmech.2020.112482. - DOI - PubMed
    1. George D.J., Lee C.H., Heng D. New approaches to first-line treatment of advanced renal cell carcinoma. Ther. Adv. Med. Oncol. 2021;13:17588359211034708. doi: 10.1177/17588359211034708. - DOI - PMC - PubMed

LinkOut - more resources