. 2021 Nov 6;9(11):1632.
doi: 10.3390/biomedicines9111632.

Physical Gold Nanoparticle-Decorated Polyethylene Glycol-Hydroxyapatite Composites Guide Osteogenesis and Angiogenesis of Mesenchymal Stem Cells

Affiliations

Physical Gold Nanoparticle-Decorated Polyethylene Glycol-Hydroxyapatite Composites Guide Osteogenesis and Angiogenesis of Mesenchymal Stem Cells

Chiung-Chyi Shen et al. Biomedicines. .

Abstract

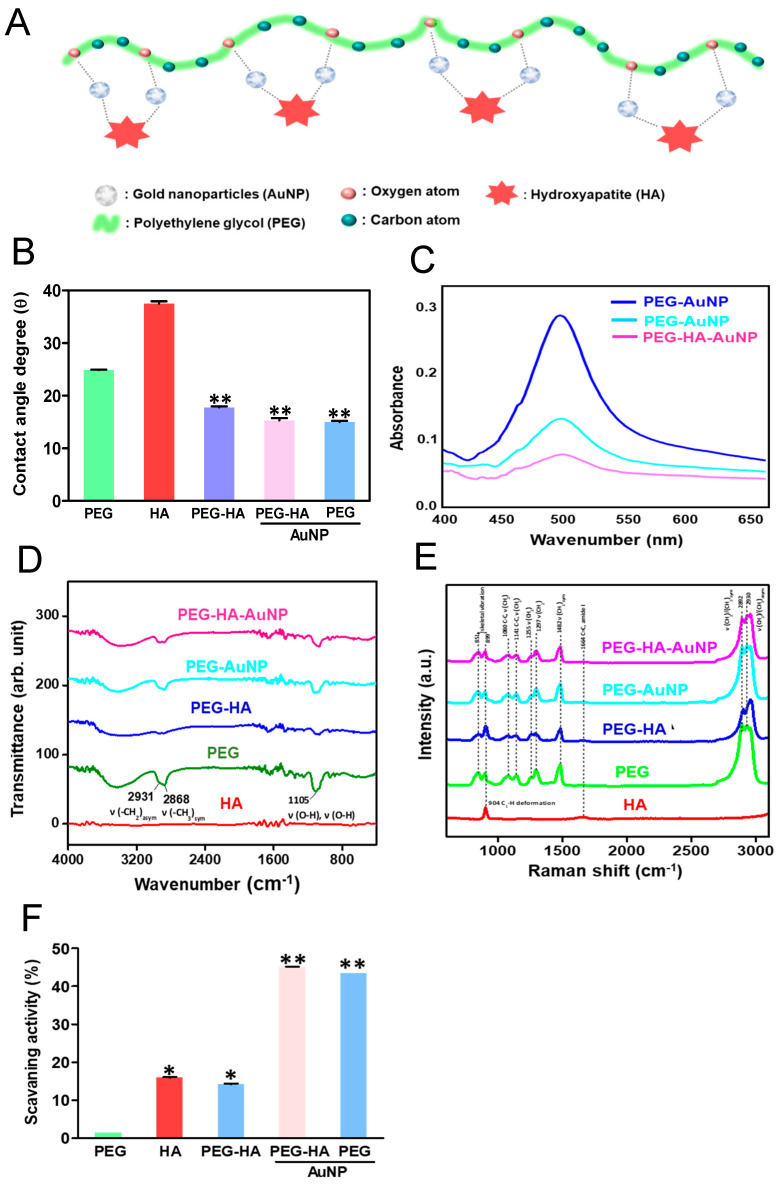
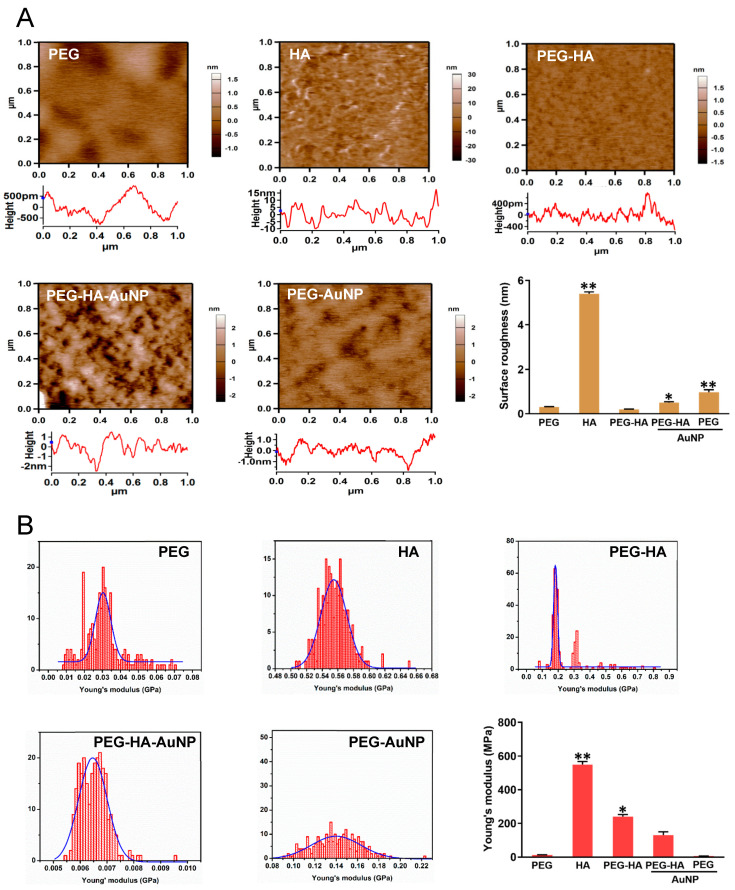
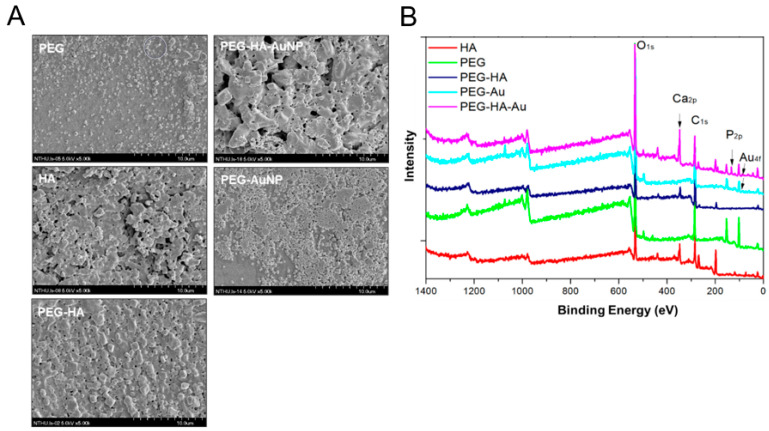
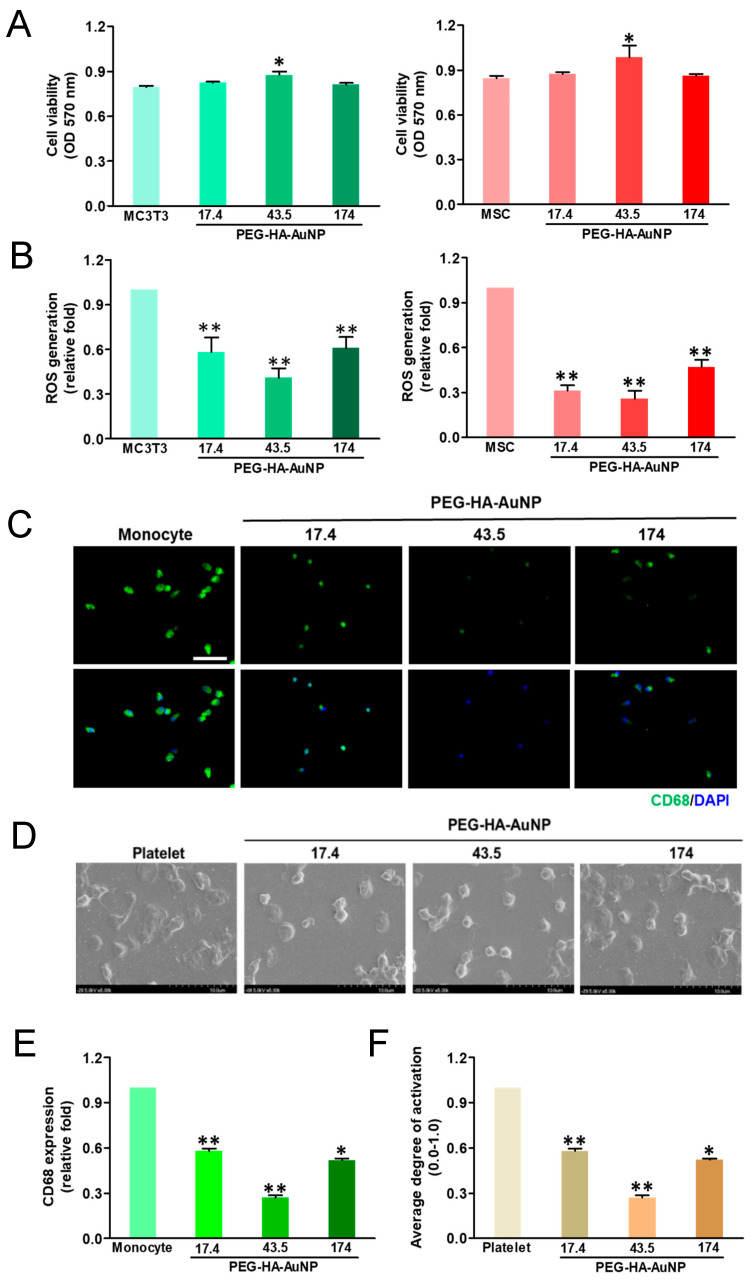
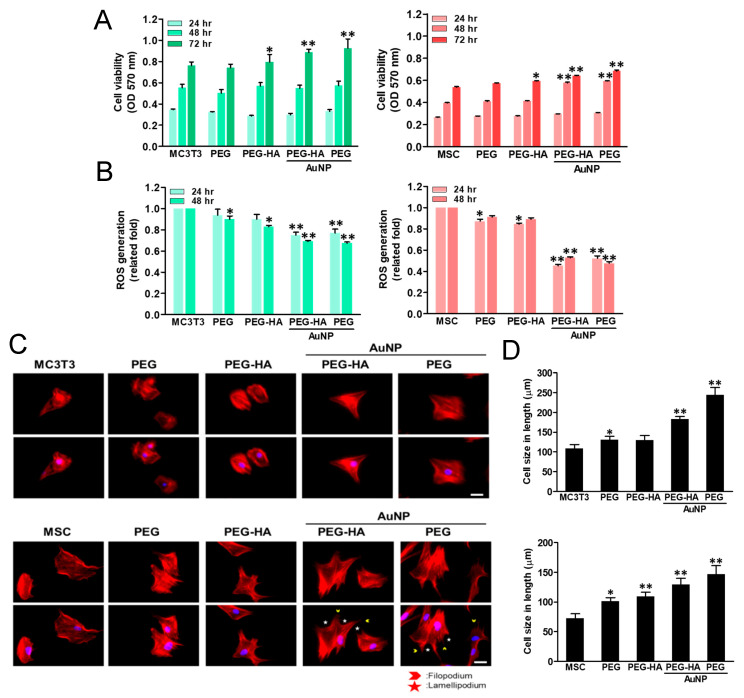
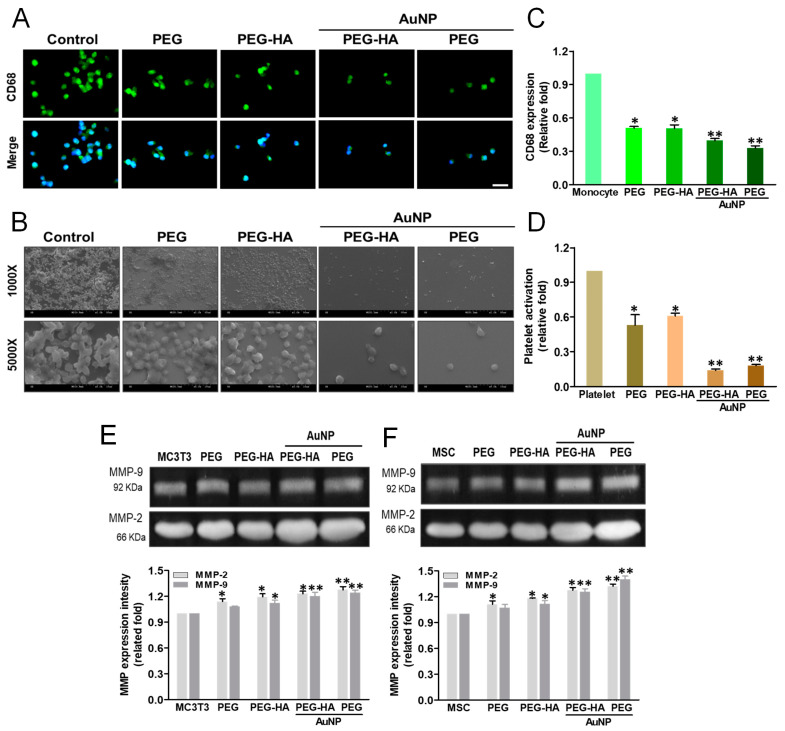
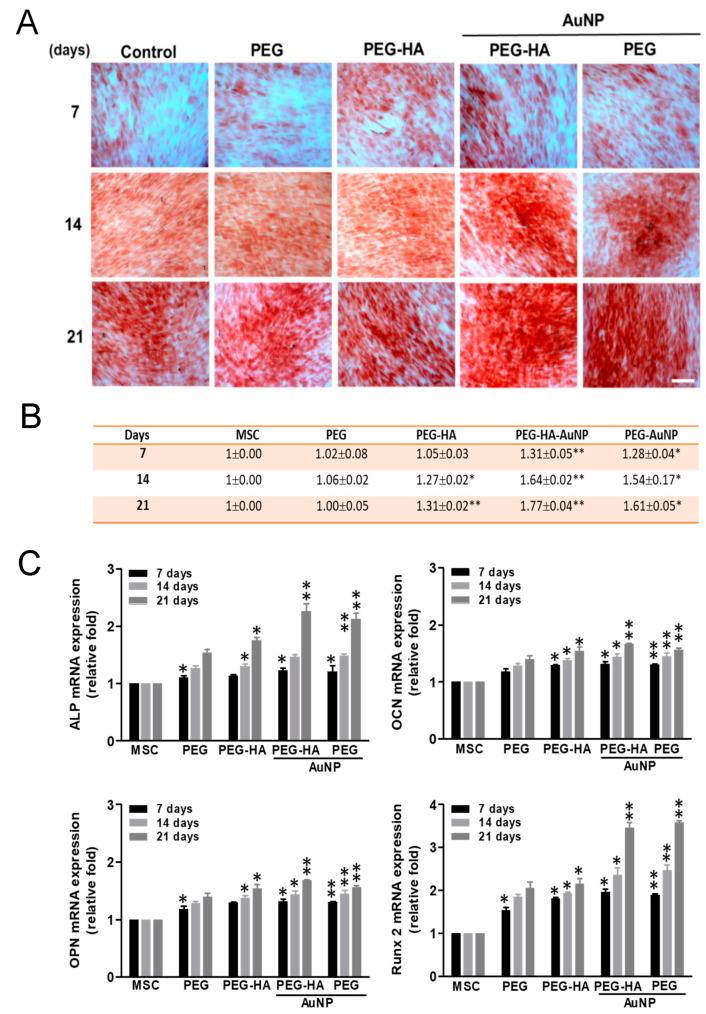
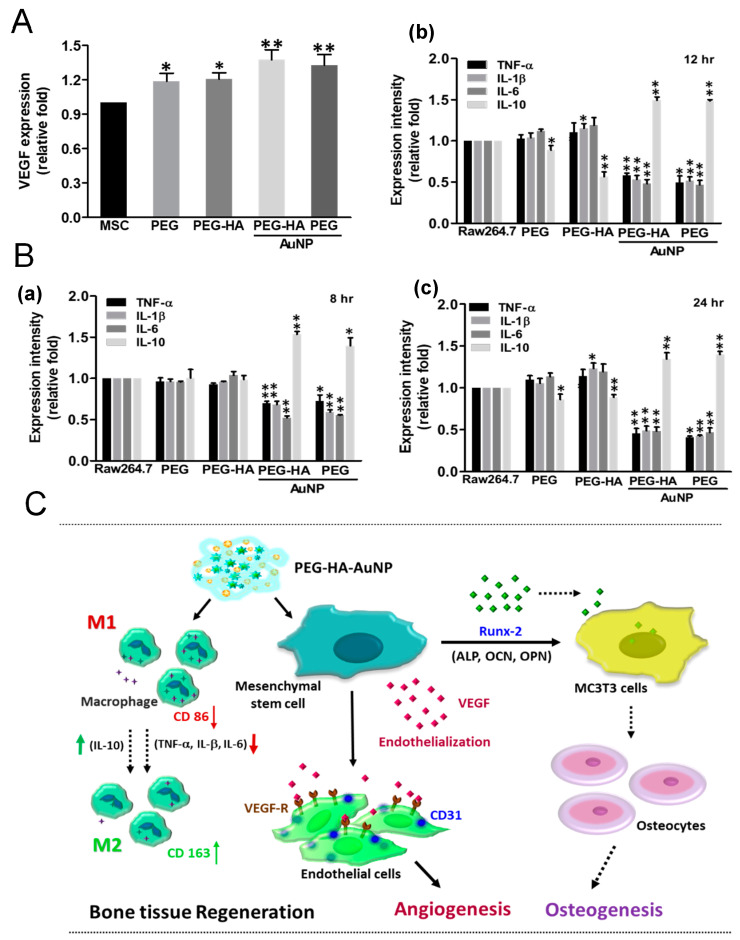
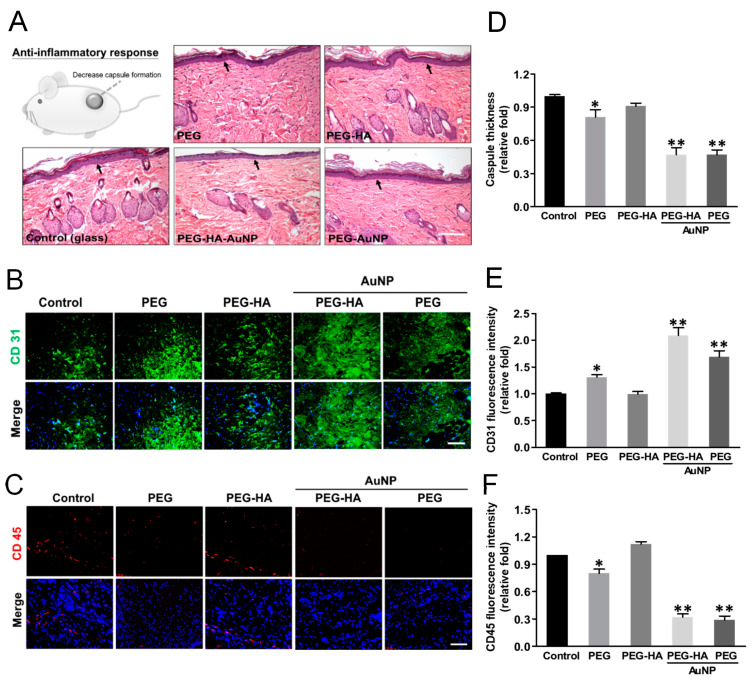
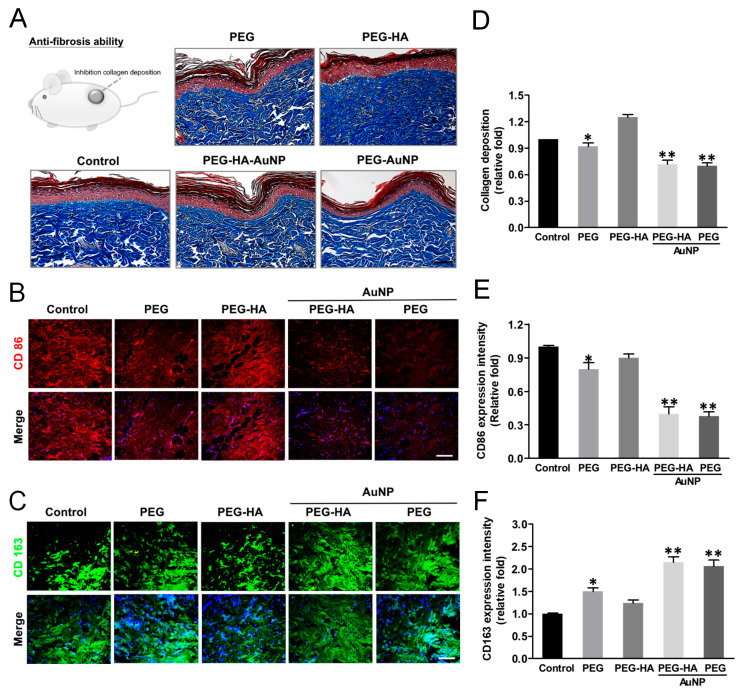
In this study, polyethylene glycol (PEG) with hydroxyapatite (HA), with the incorporation of physical gold nanoparticles (AuNPs), was created and equipped through a surface coating technique in order to form PEG-HA-AuNP nanocomposites. The surface morphology and chemical composition were characterized using scanning electron microscopy (SEM), atomic force microscopy (AFM), UV-Vis spectroscopy (UV-Vis), Fourier transform infrared spectroscopy (FTIR), X-ray photoelectron spectroscopy (XPS), and contact angle assessment. The effects of PEG-HA-AuNP nanocomposites on the biocompatibility and biological activity of MC3T3-E1 osteoblast cells, endothelial cells (EC), macrophages (RAW 264.7), and human mesenchymal stem cells (MSCs), as well as the guiding of osteogenic differentiation, were estimated through the use of an in vitro assay. Moreover, the anti-inflammatory, biocompatibility, and endothelialization capacities were further assessed through in vivo evaluation. The PEG-HA-AuNP nanocomposites showed superior biological properties and biocompatibility capacity for cell behavior in both MC3T3-E1 cells and MSCs. These biological events surrounding the cells could be associated with the activation of adhesion, proliferation, migration, and differentiation processes on the PEG-HA-AuNP nanocomposites. Indeed, the induction of the osteogenic differentiation of MSCs by PEG-HA-AuNP nanocomposites and enhanced mineralization activity were also evidenced in this study. Moreover, from the in vivo assay, we further found that PEG-HA-AuNP nanocomposites not only facilitate the anti-immune response, as well as reducing CD86 expression, but also facilitate the endothelialization ability, as well as promoting CD31 expression, when implanted into rats subcutaneously for a period of 1 month. The current research illustrates the potential of PEG-HA-AuNP nanocomposites when used in combination with MSCs for the regeneration of bone tissue, with their nanotopography being employed as an applicable surface modification approach for the fabrication of biomaterials.

Keywords: hydroxyapatite; mesenchymal stem cells; physical gold nanoparticle; polyethylene glycol.


Conflict of interest statement

The authors have declared that no competing interest exists.

Figures

Figure 1
Figure 1
(A) Schematic diagram illustrating the preparation procedure of PEG-HA-AuNPs. Characterization of PEG-HA-AuNP nanocomposites: (B) Average contact angle (θ) quantified from different materials. The contact angle from different materials without water is θ = 0°. Data are the mean ± SD (n = 3), ** p < 0.01, smaller than the control treatment (PEG). (C) UV–Vis spectra, (D) FTIR spectra, and (E) Raman spectra of different materials. (F) Free radical scavenging effect of HA, PEG, and PEG nanocomposites. Free radical scavenging effect of HA, PEG, and PEG nanocomposites. Mean ± SD.* p < 0.05; ** p < 0.01: greater than control.
Figure 2
Figure 2
Surface roughness property characterization of different materials by AFM analysis. AFM images of different materials. (A) Topographical images of different materials. (B) Histograms of Young’s modulus values (MPa) of different materials. The quantification data of surface roughness of AFM, and the quantification of Young’s modulus of different materials. * p < 0.05; ** p < 0.01: smaller than control.
Figure 3
Figure 3
Material characterization. (A) SEM analysis of different materials. (B) Wide-scan spectra of PEG and PEG composites by XPS analysis.
Figure 4
Figure 4
Cell proliferation of (A) MC3T3 cells and MSCs was promoted by culture on TCPS and different concentrations of AuNPs in the PEG-HA matrix. Data are the mean ± SD (n = 3), * p < 0.05; ** p < 0.05. Reactive oxygen species (ROS) generation assay of (B) MC3T3 cells and MSCs on different materials after 48 h of incubation. Intracellular ROS quantified by 2,7-dichlorofluorescein diacetate (DCFH-dA) and flow cytometric analysis. * p < 0.05; ** p < 0.01: smaller than control (TCPS). Biocompatibility assay. (C) The expression of CD68 for macrophages on different materials at 96 h. Cells were immunostained by the primary anti-CD68 antibody and conjugated with FITC-immunoglobulin secondary antibody (green color fluorescence). Cell nuclei were stained by DAPI (blue color fluorescence). Scale bar = 20 μm. (D) SEM images showing the adhesion and activation of human blood platelets on different materials. (E) CD68 expression was quantified based on fluorescence intensity. * p < 0.05: smaller than control (TCPS). (F) Quantification of the degree of platelet activation score. Data are the mean ± SD (n = 3). * p < 0.05; ** p < 0.01: smaller than control (TCPS). Based on these findings, we thus chose PEG-HA-AuNPs at 43.5 ppm in the following experiments.
Figure 5
Figure 5
Cell proliferation of (A) MC3T3 cells and MSCs was promoted by culturing them on PEG-HA-AuNPs and PEG-AuNPs. Data are the mean ± SD (n = 3), * p < 0.05; ** p < 0.05. Reactive oxygen species (ROS) generation assay of (B) MC3T3 cells and MSCs on different materials after 48 h of incubation. Intracellular ROS quantified by 2,7-dichlorofluorescein diacetate (DCFH-dA) and flow cytometric analysis. * p < 0.05; ** p < 0.01: smaller than control (TCPS). Cytoskeleton and cell morphology by rhodamine phalloidin staining of (C) MC3T3 cells and MSCs for actin fiber extension on different materials after 24 h of incubation under fluorescence microscopy analysis. Scale bar = 20 μm. Arrows indicate filopodia (green color) and lamellipodia (red color). Data are the mean ± SD (n = 3). Actin fiber extension in length quantified by Image J software in (D) MC3T3 cells and MSCs on different materials after 8 h is shown. Actin fiber length elongation was significantly observed in the PEG-HA-AuNP and PEG-AuNP test groups compared with the other groups. Data are mean ± SD (n = 3). * p < 0.05; ** p < 0.05. Scale bar = 50 μm.
Figure 6
Figure 6
Biocompatibility assay. (A) The expression of CD68 for macrophages on different materials at 96 h. Cells were immunostained by the primary anti-CD68 antibody and conjugated with the FITC-immunoglobulin secondary antibody (green color fluorescence). Cell nuclei were stained by DAPI (blue color fluorescence). Scale bar = 20 μm. (B) SEM images showing the adhesion and activation of human blood platelets on different materials. (C) CD68 expression was quantified based on fluorescence intensity. * p < 0.05: smaller than control (TCPS). (D) Quantification of the degree of platelet activation score. Data are the mean ± SD (n = 3). * p < 0.05; ** p < 0.01: smaller than control (TCPS). The MMP-2/9 enzymatic activity of (E) MC3T3 cells and (F) MSCs was increased in the PEG-HA-AuNP and PEG-AuNP groups. Semi-quantitative measurement of MC3T3 cells and MSCs shows the expression level of MMP-2/9 protein for cells on different materials after 48 h of incubation. Semi-quantitative data in the graph represent the optical density (OD) of gelatinolytic bands. Data are the mean ± SD (n = 3). * p < 0.05; ** p < 0.01: greater than control (TCPS).
Figure 7
Figure 7
Osteogenic differentiation. (A) Osteogenic differentiation was confirmed by ARS staining of MSCs on different materials after 7, 14 and 21 days of incubation. Scale bar = 20 μm. (B) Semi-quantification of osteoblastic differentiation by ARS staining. All images represent the mean ± SD of three independent experiments. Data are the mean ± SD (n = 3). * p < 0.05; ** p < 0.01: greater than control (TCPS). (C) Real-time PCR analysis of mRNA expression level for Runx-2, ALP, OCN, and OPN in MSCs after being cultured with different materials. GAPDH was used as an internal control. The results are represented as the ratio of Runx-2/GAPDH signals for each condition, normalized to control. Data are the mean ± SD (n = 3). * p < 0.05; ** p < 0.01: greater than control (TCPS).
Figure 8
Figure 8
Assessment of the immune response and angiogenesis of MSCs on different materials. (A) Measurement by ELISA assay shows significantly increased VEGF protein expressions for MSCs after culture on different materials after 48 h of incubation. Data are mean ± SD. * p < 0.05: ** p < 0.01: greater than TCPS. (B) ELISA results for inflammatory cytokines: (a) 8 h, (b) 12 h, and (c) 24 h of production by RAW264.7 cells. * p < 0.05; ** p < 0.01. (C) Scheme illustrates PEG-HA-AuNPs’ prominent superior biological and biocompatibility performance, which may account for the induction of the better differentiation ability into bone tissue of MSCs for this substrate. Schematic diagram shows that PEG-HA-AuNPs with MSCs induced better angiogenic and osteogenic differentiation. After combining with PEG-HA-AuNPs, the expression of CD 86 was decreased. In contrast with CD 86, CD 163 expression was increased. This result indicates that PEG-HA-AuNPs could inhibit the inflammation response. Moreover, PEG-HA-AuNPs effectively promoted endothelialization, leading to a higher expression of CD 31; they also induced the expression of the Runx-2 gene, which caused MC3T3 cells to differentiate into osteocytes. The former was linked to angiogenesis, and the latter was related to osteogenesis. The above evidence shows that PEG-HA-AuNPs could become an outstanding biomaterial for bone tissue regeneration.
Figure 9
Figure 9
Evaluation of foreign body response of different substrates after subcutaneous implantation. Histology of H&E-stained sections and IHC staining after implantation of material for 4 weeks. (A) FBR is exhibited by the capsule thickness (arrows) based on the histology examination. The scale bar is 100 μm. (B) Immunofluorescence staining of CD31 (marker of endothelialization), and (C) CD45 (marker of immunoflammation) in response to the implant materials. The scale bar is 100 μm. Quantification of (D) capsule thickness, and (E) CD31 and (F) CD45 fluorescence intensities. Data are mean ± SD. * p < 0.05, ** p < 0.01: greater than control (glass). The number of rats was 5 (n = 5).
Figure 10
Figure 10
Masson’s trichrome staining of (A) collagen deposition (blue color) of rat femoral artery subcutaneously implanted in an SD rat assessed the immune response of different materials at 4 weeks. Immunofluorescence staining images (marker of macrophages) in response to the implant materials. (B) CD86 (M1) = red color, (C) CD163 (M2) = green color. The scale bar represents 100 μm. Quantification of (D) collagen deposition, and (E) CD86 and (F) CD163 fluorescence intensities. Data are mean ± SD. * p < 0.05, ** p < 0.01: smaller or greater than control group (glass). The number of rats was 5 (n = 5).

References

    1. Zhu T., Cui Y., Zhang M., Zhao D., Liu G., Ding J. Engineered three-dimensional scaffolds for enhanced bone regeneration in osteonecrosis. Bioact. Mater. 2020;5:584–601. doi: 10.1016/j.bioactmat.2020.04.008. - DOI - PMC - PubMed
    1. Zhao D., Zhu T., Li J., Cui L., Zhang Z., Zhuang X., Ding J. Poly (lactic-co-glycolic acid)-based composite bone-substitute materials. Bioact. Mater. 2021;6:346–360. doi: 10.1016/j.bioactmat.2020.08.016. - DOI - PMC - PubMed
    1. Qiu H., Guo H., Li D., Hou Y., Kuang T., Ding J. Intravesical Hydrogels as Drug Reservoirs. Trends Biotechnol. 2020;38:579–583. doi: 10.1016/j.tibtech.2019.12.012. - DOI - PubMed
    1. Le H., Xu W., Zhuang X., Chang F., Wang Y., Ding J. Mesenchymal stem cells for cartilage regeneration. J. Tissue Eng. 2020;11:2041731420943839. doi: 10.1177/2041731420943839. - DOI - PMC - PubMed
    1. Cui L., Zhang J., Zou J., Yang X., Guo H., Tian H., Zhang P., Wang Y., Zhang N., Zhuang X., et al. Electroactive composite scaffold with locally expressed osteoinductive factor for synergistic bone repair upon electrical stimulation. Biomaterials. 2020;230:119617. doi: 10.1016/j.biomaterials.2019.119617. - DOI - PubMed

LinkOut - more resources