. 2021 Nov 9;22(22):12103.
doi: 10.3390/ijms222212103.

Study of the Role of the Tyrosine Kinase Receptor MerTK in the Development of Kidney Ischemia-Reperfusion Injury in RCS Rats

Affiliations

Study of the Role of the Tyrosine Kinase Receptor MerTK in the Development of Kidney Ischemia-Reperfusion Injury in RCS Rats

Thomas Pelé et al. Int J Mol Sci. .

Abstract

Renal ischaemia reperfusion (I/R) triggers a cascade of events including oxidative stress, apoptotic body and microparticle (MP) formation as well as an acute inflammatory process that may contribute to organ failure. Macrophages are recruited to phagocytose cell debris and MPs. The tyrosine kinase receptor MerTK is a major player in the phagocytosis process. Experimental models of renal I/R events are of major importance for identifying I/R key players and for elaborating novel therapeutical approaches. A major aim of our study was to investigate possible involvement of MerTK in renal I/R. We performed our study on both natural mutant rats for MerTK (referred to as RCS) and on wild type rats referred to as WT. I/R was established by of bilateral clamping of the renal pedicles for 30' followed by three days of reperfusion. Plasma samples were analysed for creatinine, aspartate aminotransferase (ASAT), lactate dehydrogenase (LDH), kidney injury molecule -1 (KIM-1), and neutrophil gelatinase-associated lipocalin (NGAL) levels and for MPs. Kidney tissue damage and CD68-positive cell requirement were analysed by histochemistry. monocyte chemoattractant protein-1 (MCP-1), myeloperoxidase (MPO), inducible nitric oxide synthase (iNOS), and histone 3A (H3A) levels in kidney tissue lysates were analysed by western blotting. The phagocytic activity of blood-isolated monocytes collected from RCS or WT towards annexin-V positive bodies derived from cultured renal cell was assessed by fluorescence-activated single cell sorting (FACS) and confocal microscopy analyses. The renal I/R model for RCS rat described for the first time here paves the way for further investigations of MerTK-dependent events in renal tissue injury and repair mechanisms.

Keywords: MerTK; RCS rats; inflammation; ischemia-reperfusion; microparticles; phagocytosis.


Conflict of interest statement

The authors declare no conflict of interest.

Figures
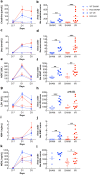
Figure 1
Figure 1
Plasma levels of creatinine, urea, ASAT, LDH, KIM-1, and NGAL in both WT and RCS under SHAM or I/R conditions on day 1 and day 3 post-reperfusion. Plasma from both WT or RCS rats that were not submitted to surgery (D-7), were submitted to surgery without renal pedicle clamping (SHAM) or were submitted to a 30-min renal pedicle clamping (I/R) was analyzed on day 1 (D1) and on day 3 (D3) post-reperfusion or post-surgery for creatinine (a), urea (c), ASAT (e), LDH (g), KIM-1 (i) or NGAL (k) levels. Creatinine, urea, LDH, and ASAT levels were measured using a Cobas C701 automatic analyzer. Plasma NGAL and KIM-1 levels were determined by sandwich ELISA. For each marker and each condition, five to 10 rats were used; data are presented as means ± SEM. The area under the curve (from D-7 to D3) for each marker and each condition was calculated using R-studio software and is represented in panels (b) (creatinine), (d) (urea), (f) (ASAT), (h) (LDH), (j) (KIM-1), and (l) (NGAL); lines represent the mean for each condition. The Mann–Whitney test was used for determining the p values. *: p < 0.05; **: p < 0.01; ***: p < 0.005.
Figure 2
Figure 2
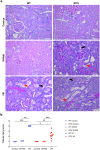
Histological analysis of kidney sections from both WT and RCS in the Control, SHAM, and I/R groups on day 3 post-reperfusion. Kidney sections from the Control, SHAM or I/R groups (three days after surgery or reperfusion) were stained with PAS coloration; the presence and the extent of tubular injury were examined and scored under the microscope (x200). Panel (a) represents the typical structure observed under each condition; the red arrows indicate cellular debris in the lumen while the black arrows indicate brush border loss; the scale bar represents 100 µm. In panel (b), the score of tubular injury from five to 13 rats from each condition was averaged and is presented; lines represent the mean for each condition. The Mann–Whitney test was used for determining the p values. *: p < 0.05; **: p < 0.01; ***: p < 0.005.
Figure 3
Figure 3
Kidney and plasma levels of MCP-1 in both WT and RCS rats under control, SHAM, and I/R conditions on day 1 or day 3 post-reperfusion. In panel (a), kidney tissue lysates from both WT or RCS rats that were not submitted to surgery (Control), were submitted to surgery without renal pedicle clamping (SHAM) or were submitted to a 30-min renal pedicle clamping followed by three days reperfusion (I/R) were analyzed by western blotting for the presence of the MCP-1 protein (20 kDa); protein loads are shown at the bottom of each western blot. In panel (b), the intensity of MCP-1 bands was normalized to the GAPDH protein and are presented; three to eight rats were used for each condition. In panel (c), plasma MCP-1 levels, at 1- and 3-days post-surgery or post-reperfusion, determined by ELISA are presented. The area under the curve relative to panel (c) was calculated using R-studio software and is represented in panels (d); four to nine rats were used; lines represent the mean for each condition. The Mann–Whitney test was used for determining the p values. *: p < 0.05; **: p < 0.01; ***: p < 0.005.
Figure 4
Figure 4
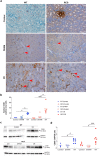
CD68-positive leukocyte recruitment within the kidney following the I/R sequence in both WT and RCS rats on day 3 post-reperfusion. Panel (a) represents typical structures observed by immunohistology analysis of kidney sections from the Control, SHAM or I/R groups in both WT and RCS rats on day 3 post- surgery or post-reperfusion using a monoclonal anti-CD68 antibody. The red arrows indicate CD68-positive leukocytes; the scale bar represents 100 µm. Panel (b) represents the numbers of CD68-positive cells scored under the microscope (×200); three to five rats were used for each condition. In panel (c), kidney tissue lysates from both WT or RCS rats that were not submitted to surgery (Control), were submitted to surgery without renal pedicle clamping (SHAM) or were submitted to a 30-min renal pedicle clamping followed by three days of reperfusion (I/R) were analysed by western blotting for the presence of the CD68 protein (25 kDa); GAPDH protein bands are shown at the bottom of each western blot (representative western blot). In panel (d), the intensity of CD68 bands normalised to the GAPDH protein are presented using 4–7 rats for each condition; lines represent the mean for each condition. The Mann–Whitney test was used for determining the p values. *: p < 0.05; **: p < 0.01; ***: p < 0.005.
Figure 5
Figure 5
Renal tissue MPO, H3a, and iNOS protein expression in both WT and RCS rats under Control, SHAM and I/R conditions on day 3 post-reperfusion. Kidney tissue lysates from both WT or RCS rats that were not submitted to surgery (Control), were submitted to surgery without renal pedicle clamping (SHAM) or were submitted to a 30-min renal pedicle clamping were analysed by western blotting on day 3 post-surgery or post-reperfusion (I/R) for the presence of MPO (59 kDa) panel (a), H3a (75 kDa) panel (c) or iNOS (130 kDa) panel (e). GAPDH protein bands are shown at the bottom of each western blot (representative western blots). In panels (b,d,f), the intensity of MPO, H3a or iNOS bands normalized to the GAPDH protein are presented; lines represent the mean for each condition. Statistical analysis of data from five to nine rats for each group was performed using the Kruskal–Wallis test followed by Dunn’s test. The Mann–Whitney test was used for determining the p values. *: p < 0.05; **: p < 0.01; ***: p < 0.005.
Figure 6
Figure 6
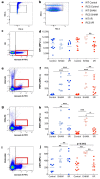
Identification of plasma MPs by flow cytometry in both WT and RCS rats under Control, SHAM, and I/R conditions on day 1 post-reperfusion. Panels (a,b) illustrate the use of Megamix-plus SSC for the settings of MP quantification by FACS analysis using a BDVerse flow cytometer. The characterization of total MPs (Annexin-V positives) from platelet-poor plasma (obtained at the control time, on day 1 after surgery without ischemia (SHAM), and on day 1 after I/R) was performed by FACS analysis and is illustrated in panel (c). The characterisation of cell-specific MPs was performed using annexin-V labelling in combination with anti-CD61 antibody for platelets MPs (PMPs). Panel (e), anti-CD54 antibody for endothelial MPs (EMPs) Panel (g) or anti-CD45 antibody for leukocytes MP (LMPs) Panel (i). For each condition, the concentration of MPs per μL of plasma was determined from four to 10 samples and is represented in panels (d,f,h,j); lines represent the mean for each condition. The Mann–Whitney test was used for determining the p values. *: p < 0.05; **: p < 0.01; ***: p < 0.005.
Figure 7
Figure 7
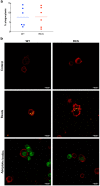
In vitro phagocytosis activity of monocytes isolated from both WT and RCS rats. Apoptotic bodies were obtained from cultured rat kidney cells (NRK-52 cells) that were exposed to 100 μM H2O2 for 3 h. NRK-52 cell apoptotic bodies were labelled with CMF-DA green tracker and used in the phagocytosis assay. Monocytes isolated from WT or RCS rat blood samples were exposed to NRK-52 cell apoptotic bodies or to fluorescent latex beads (positive control) for 9 h. Monocytes were then labelled with fluorescent (red) anti-CD45 Phycoerythrin (PE) antibody, and their ability to bind or to internalize NRK-52 cell apoptotic bodies or fluorescent latex beads was analysed by flow cytometry using an FACS BD Acuri C6 in panel (a) (six rats for each condition, lines represent the mean for each condition) or by confocal microscopy using an Olympus FV1000 confocal microscope in panel (b) (four rats for each condition). In parallel experiments, 2 µm fluorescent latex beads were used to visualise the ability of monocytes to bind or internalize latex beads and are represented in (b). Scale bars represent 10 µm.

References

    1. Chiang-Ting C., Tzu-Ching C., Ching-Yi T., Song-Kuen S., Ming-Kuen L. Adenovirus-Mediated Bcl-2 Gene Transfer Inhibits Renal Ischemia/Reperfusion Induced Tubular Oxidative Stress and Apoptosis. Am. J. Transplant. 2005;5:1194–1203. doi: 10.1111/j.1600-6143.2005.00826.x. - DOI - PubMed
    1. Eltzschig H.K., Eckle T. Ischemia and Reperfusion—From Mechanism to Translation. Nat. Med. 2011;17:1391–1401. doi: 10.1038/nm.2507. - DOI - PMC - PubMed
    1. Favreau F., Giraud S., Bon D., Chatauret N., Thuillier R., Hauet T. Ischemia reperfusion control: The key of kidney graft outcome. Med. Sci. 2013;29:183–188. doi: 10.1051/medsci/2013292016. - DOI - PubMed
    1. Pefanis A., Ierino F.L., Murphy J.M., Cowan P.J. Regulated Necrosis in Kidney Ischemia-Reperfusion Injury. Kidney Int. 2019;96:291–301. doi: 10.1016/j.kint.2019.02.009. - DOI - PubMed
    1. Wiegele G., Brandis M., Zimmerhackl L.B. Apoptosis and Necrosis during Ischaemia in Renal Tubular Cells (LLC-PK1 and MDCK) Nephrol. Dial. Transplant. 1998;13:1158–1167. doi: 10.1093/ndt/13.5.1158. - DOI - PubMed

MeSH terms

LinkOut - more resources