. 2021 Nov 9;22(22):12141.
doi: 10.3390/ijms222212141.

The Different Molecular Code in Generation of Dopaminergic Neurons from Astrocytes and Mesenchymal Stem Cells

Affiliations

The Different Molecular Code in Generation of Dopaminergic Neurons from Astrocytes and Mesenchymal Stem Cells

Nana Wang et al. Int J Mol Sci. .

Abstract

Transplantation of exogenous dopaminergic (DA) neurons is an alternative strategy to replenish DA neurons that have lost along the course of Parkinson's disease (PD). From the perspective of ethical acceptation, the source limitations, and the intrinsic features of PD pathology, astrocytes (AS) and mesenchymal stem cells (MSCs) are the two promising candidates of DA induction. In the present study, we induced AS or MSCs primary culture by the combination of the classical transcription-factor cocktails Mash1, Lmx1a, and Nurr1 (MLN), the chemical cocktails (S/C/D), and the morphogens SHH, FGF8, and FGF2 (S/F8/F2); the efficiency of induction into DA neurons was further analyzed by using immunostaining against the DA neuronal markers. AS could be efficiently converted into the DA neurons in vitro by the transcriptional regulation of MLN, and the combination with S/C/D or S/F8/F2 further increased the conversion efficiency. In contrast, MSCs from umbilical cord (UC-MSCs) or adipose tissue (AD-MSCs) showed moderate TH immunoreactivity after the induction with S/F8/F2 instead of with MLN or S/C/D. Our data demonstrated that AS and MSCs held lineage-specific molecular codes on the induction into DA neurons and highlighted the unique superiority of AS in the potential of cell replacement therapy for PD.

Keywords: AS; DA candidate; MSCs; PD; morphogens; small molecules; transcription factors.


Conflict of interest statement

The authors declare no conflict of interest.

Figures

Figure 1
Figure 1
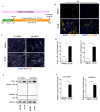
Characterization of primary cultured AS and MSCs. (A) Immunostaining analysis showed that nearly 95% of cells in the primary AS culture were immuno-positive for astrocytic markers GFAP and S-100β, only a small percentage of cells expressed makers for neural progenitor Nestin and PAX6. (B) Statistical analysis showed that the overwhelming majority of cells in the primary AS culture expressed astrocytic markers (n = 3 independent experiments). (C) MSCs were stained with surface markers CD90, CD105, CD45, and CD34 and subjected to flow cytometry analysis. More than 99% of cells are immunoreactive to mesenchymal stem cell markers CD90 and CD105 and negative for hematopoietic markers CD45 and CD34. (D) The osteogenic differentiation of MSCs was evaluated by Alizarin red staining. Note that the black arrows indicate the calcified tubercles. (E) The lipogenic differentiation of MSCs was detected by oil red staining, and the white arrows indicate lipid droplets. Scale bars: 20 µm in (A), 50 µm in (C,D). Numerical data represent mean ± SEM.
Figure 2
Figure 2
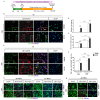
Induction of AS but not MSCs into DA neurons through a classical three-transcription-factor cocktail (Mash1, Lmx1a, Nurr1, collectively known as “MLN”). (A) The paradigm of the transcription factor-based induction of AS or MSCs into DA neurons. AS, UC-MSCs, or AD-MSCs were first transferred into the neuronal induction medium (NM) and infected with lentivirus carrying the reverse Tet-transactivator (FUW-rtTA2) and Tet-O-FUW-Mash1-P2A-Lmx1a-F2A-Nurr1-IRES-EGFP (MLN-EGFP). Dox was administered from the 3rd day (D3) to initiate the transcription of the MLN cocktail. Cells infected with lentivirus carrying FUW-rtTA2 and Tet-O-IRES-EGFP (EGFP) were used as a control. A total of 14 days later (D14), the induced AS, UC-MSCs, and AD-MSCs were stained with EGFP, TH, and MAP2 antibodies, and the representative images were shown in panel (B) (AS), (C) (UC-MSCs), and (D) (AD-MSCs). DAPI (blue) was used as counterstaining. EGFP-positive cells could be observed in all the MLN-EGFP or EGFP-infected cells, including AS, UC-MSCs, and AD-MSCs (BD); however, TH- and MAP2-positive DA neurons were detected only in the transcription factor-based induction system for AS (B), but not in the one for UC-MSCs (C) or AD-MSCs (D). (E) Numerical analysis revealed that the percentage of MLN-EGFP-positive cells in the AS culture is significantly lower than those in UC-MSCs or AD-MSCs cultures (n = 3 independent experiments). (F) Quantitative analysis revealed significantly more TH-positive neurons were induced from MLN-EGFP-positive AS on D14, as compared to those observed in UC-MSCs and AD-MSCs groups (n = 3 independent experiments). Scale bars: 50 µm in (BD). mean ± SEM. ** indicates p < 0.01, *** indicates p < 0.001 in AS culture vs. UC-MSCs or AD-MSCs.
Figure 3
Figure 3
AS and MSCs acquired neuronal phenotypes under chemical modulation. (A) The paradigm of chemical modulation. AS, UC-MSCs, or AD-MSCs was primed in NM for 3 days, followed by induction with chemicals SB431542, CHIR99021, and DAPT (S/C/D). On the 14th day, cells were fixed and analyzed by immunostaining or WB. (B) Representative immunostaining images of DMSO-treated (upper panel) and S/C/D-treated AS (lower panel). There are many cells expressing TuJ1 or MAP2 in the S/C/D-treated AS, markers of the immature and mature neurons, respectively. In contrast, few cells expressed these two markers in the DMSO-treated AS. None of the TH-positive DA neurons could be observed in the DMSO- or S/C/D-induced AS culture. (C) Representative images of DMSO-treated (upper panel) and S/C/D-treated MSCs (lower panel) subjected to TuJ1 and TH double immunostaining. Both UC-MSCs (left column) and AD-MSCs (right column) showed no obvious changes in cell morphology, albeit increasing TuJ1 expression pattern after S/C/D treatment. None of the TH+ cells could be detected in the MSCs. (D) Quantification analysis revealed that S/C/D treatment significantly increased the percentages of TuJ1-positive cells and MAP2-positive cells in the AS culture, as compared to the DMSO-treated group (n = 3 independent experiments). (E) Immunoblotting assay for TuJ1 (50 kDa), MAP2 (high-molecular-weight MAP2 at 280 kDa, low-molecular-weight MAP2 at 70 kDa), and TH (60 kDa) in DMSO- and S/C/D-treated UC-MSCs and AD-MSCs after 14-day induction. Note that neither MAP2- nor TH-positive bands could be observed in these MSCs treated with DMSO or S/C/D. (F) Numerical analysis showed that the expression levels of TuJ1 in MSCs were significantly increased under S/C/D treatment, as compared to the levels in DMSO-treated MSCs (n = 3 independent experiments). Scale bars: 50 µm in (B,C). Data represented as mean ± SEM, * p < 0.05 in S/C/D-treated cells vs. the DMSO-treated ones.
Figure 4
Figure 4
AS and MSCs showed different DA induction potential to the signaling molecules SHH, FGF8, and FGF2. (A) AS or MSCs were primed in NM for 3 days, followed by DA induction with signaling molecules SHH, FGF8, and FGF2 (S/F8/F2) till the 14th day. On the 14th day, cells were fixed and subjected to MAP2 and TH immunostaining. (B) The representative images of MAP2 and TH double staining showing AS (left column), UC-MSCs (middle column), and AD-MSCs (right column) treated with PBS (upper panel) or S/F8/F2 (lower panel) for 14 days. There were few MAP2- or TH-positive cells in all the PBS-treated cells. S/F8/F2 increased the expression of MAP2 in all three cell types, but only UC-MSCs and AD-MSCs expressed DA-specific marker TH. (CE) The percentages of MAP2- and TH-positive cells induced from AS (C), UC-MSCs (D), AD-MSCs (E) were counted and compared at day 14. Positive cells are included only when the staining was distributed in the nuclei as well as cytoplasm (n = 3 independent experiments). Scale bars: 50 µm in (B). Data represented as mean ± SEM, * p < 0.05, ** p < 0.01 in S/F8/F2-treated cells vs. the corresponding PBS-treated control.
Figure 5
Figure 5
Improvement of the DA induction efficiency and maturation in AS but not MSCs by a combination of the transcriptional and the chemical modulation. (A) The paradigm of DA induction by the transcriptional regulation and the chemical modulation. AS, UC-MSCs, or AD-MSCs were infected with lentivirus carrying MLN-EGFP or EGFP (control) and then treated with NM containing Dox and chemicals S/C/D to initiate both the transcriptional and chemical induction. The induction system was terminated and stained for various DA markers on the 14th or 28th day for functional analysis. (B,C) The representative confocal images of AS being treated with MLN cocktail and S/C/D for 14 days (B) and 28 days (C). Cells were double stained for EGFP (infected cells), TH (DA neurons), and DAPI (cell nuclei). The area in the dashed box was enlarged and shown in the insets of each figure. AS infected with EGFP showed none of the TH-positive staining (the right column); in contrast, all the AS infected with MLN cocktail are stained positive for TH (the left 3 columns). Note that in Figure 5B, the induced TH-positive neurons extended more of neurites with the addition of S/C/D (the lower panel), as compared to the corresponding DMSO-treated group (the upper panel). (D) Numerical analysis of the neurites per TH-positive cell in the AS culture induced with MLN cocktail w/o S/C/D. The neurites with a length over 100 μm are included. (E) The effects of MLN cocktail and S/C/D treatment on the percentages of TH-positive cells in the AS induction system (n = 3 independent experiments). (F) The effects of MLN cocktail and S/C/D treatment on the percentages of TH-positive cells in the MLN-EGFP-infected AS (n = 3 independent experiments). (G,H) The representative images of AD-MSCs or UC-MSCs were infected with lentivirus carrying EGFP, MLN-EGFP, or MLN-EGFP with Tet-O-Ngn2-IRES-EGFP (Ngn2), followed by treatment with DMSO or S/C/D for 14 days (G) or 28 days (H). Cells were double stained for EGFP and TH. Note that EGFP fluorescence could be detected in both AD-MSCs and UC-MSCs culture, but none of TH-positive cells could be observed. Scale bars: 50 µm in (B,C,G,H). Data represented as mean ± SEM. n.s. indicates not significantly different. *** p < 0.001.
Figure 6
Figure 6
AS exhibited higher TH expression levels as compared to MSCs by the transcriptional and morphogenic activation. (A) The paradigm of DA induction by the transcriptional regulation and the morphogenic activation. AS, UC-MSCs, or AD-MSCs were infected with lentivirus carrying MLN-EGFP or EGFP (control) and then treated with NM containing Dox and morphogens S/F8/F2 to initiate both the transcriptional and morphogenic induction for 14 days. On the 14th day, cells were fixed and stained for double staining of TH and EGFP, and the representative confocal images were shown in (B,F) (B, AS; UC-MSCs; AD-MSCs). DAPI was used as counterstaining. Note that TH-positive cells with more typical neuronal morphology (indicated with white arrows) could be observed in the AS, UC-MSCs and AD-MSCs treated simultaneously with MLN cocktail and S/F8/F2 (The lower panels in B). (CE) Quantified data showed the expression level of TH in AS was significantly higher as compared to UC-MSCs and AD-MSCs after the transcriptional and morphogenic induction for 14 days, in addition, the mRNA expression level of TH in UC-MSCs (D) and AD-MSCs (E) treated simultaneously with MLN cocktail, and S/F8/F2 was higher than the control groups with EGFP and S/F8/F2 (n = 5 independent experiments). (F) The representative images at low magnification showed that more TH-positive cells were observed in the AS group with both transcriptional and morphogenic induction for 14 days. (G) The effects of morphogens S/F8/F2 treatment on the percentages of TH-positive cells in the whole AS induction system or the MLN-EGFP-infected AS at day 14 (n = 3 independent experiments). (H) Immunoblotting assay for the synaptic makers synapsin1 (75 kDa) and PSD95 (100 kDa) in MLN-EGFP+S/F8/F2-treated AS, UC-MSCs, and AD-MSCs after 14-day induction. Note that the expression levels of Synapsin1 and PSD95 in AS were higher than the ones in UC-MSCs and AD-MSCs (n = 3 independent experiments). Scale bars: 50 µm in (B), 100 µm in (F). Data represented as mean ± SEM. * p < 0.05, ** p < 0.01, *** p < 0.001.
Figure 7
Figure 7
The differential decisive molecular code governing the DA phenotype acquirement of AS vs. MSCs. The diagram summarizes the sequential stages and possible key molecules involved in DA phenotype development from ectoderm- (AS) and mesoderm-derived (MSC) cells, respectively. Transcriptional regulation with Mash1, Nurr1, Lmx1a (MLN) plays a dominant role in the determination of DA phenotype from AS; small molecules involved in TGF-β, GSK-3β, and Notch pathways (SB431542, CHIR99021, and DAPT; S/C/D), as well as morphogens SHH, FGF2 and FGF8 (S/F8/F2), accelerate the efficiency of DA induction. In contrast, morphogens S/F8/F2 involved in DA regional specification are the key molecules for the DA phenotype acquirement from MSCs; Transcriptional cocktail MLN could promote the quality of DA phenotype derived from MSCs. Possible interactions between this network of molecules are indicated by arrows with solid lines. Molecules that do not promote DA phenotype acquirement are indicated by arrows with dashed lines. The decisive molecular codes are indicated by red circles and arrows with solid lines.

Similar articles

Cited by

References

    1. Pires A.O., Teixeira F.G., Mendes-Pinheiro B., Serra S.C., Sousa N., Salgado A.J. Old and new challenges in Parkinson’s disease therapeutics. Prog. Neurobiol. 2017;156:69–89. doi: 10.1016/j.pneurobio.2017.04.006. - DOI - PubMed
    1. Cacabelos R. Parkinson’s Disease: From Pathogenesis to Pharmacogenomics. Int. J. Mol. Sci. 2017;18:551. doi: 10.3390/ijms18030551. - DOI - PMC - PubMed
    1. Barker R.A., Drouin-Ouellet J., Parmar M. Cell-based therapies for Parkinson disease-past insights and future potential. Nat. Rev. Neurol. 2015;11:492–503. doi: 10.1038/nrneurol.2015.123. - DOI - PubMed
    1. Freed W.J., Perlow M.J., Karoum F., Seiger A., Olson L., Hoffer B.J., Wyatt R.J. Restoration of Dopaminergic Function by Grafbng of Fetal Rat Substantia Nigra to the Caudate Nucleus: Long-Term Behavioral, Biochemical, and Histochemical Studies. Ann. Neurol. 1980;8:510–519. doi: 10.1002/ana.410080508. - DOI - PubMed
    1. Liu Z., Cheung H.H. Stem Cell-Based Therapies for Parkinson Disease. Int. J. Mol. Sci. 2020;21:8060. doi: 10.3390/ijms21218060. - DOI - PMC - PubMed

MeSH terms