. 2021 Nov 10;22(22):12167.
doi: 10.3390/ijms222212167.

Overcoming Microenvironment-Mediated Chemoprotection through Stromal Galectin-3 Inhibition in Acute Lymphoblastic Leukemia

Affiliations

Overcoming Microenvironment-Mediated Chemoprotection through Stromal Galectin-3 Inhibition in Acute Lymphoblastic Leukemia

Somayeh S Tarighat et al. Int J Mol Sci. .

Abstract

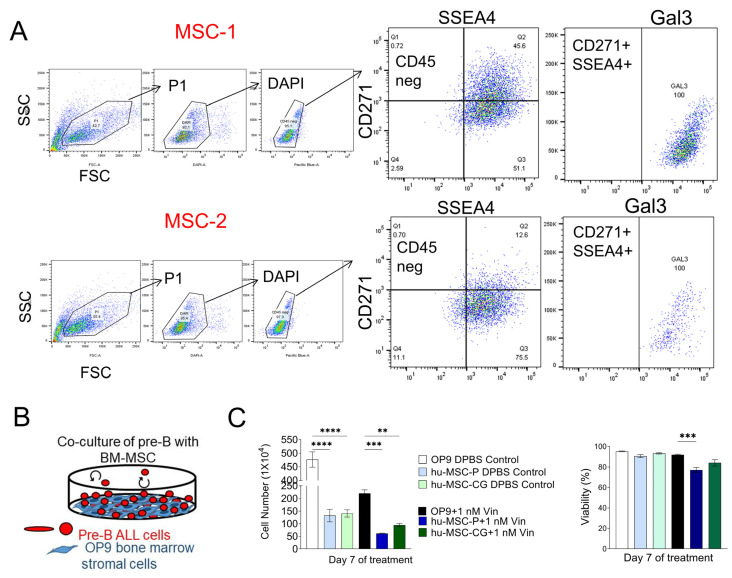
Environmentally-mediated drug resistance in B-cell precursor acute lymphoblastic leukemia (BCP-ALL) significantly contributes to relapse. Stromal cells in the bone marrow environment protect leukemia cells by secretion of chemokines as cues for BCP-ALL migration towards, and adhesion to, stroma. Stromal cells and BCP-ALL cells communicate through stromal galectin-3. Here, we investigated the significance of stromal galectin-3 to BCP-ALL cells. We used CRISPR/Cas9 genome editing to ablate galectin-3 in stromal cells and found that galectin-3 is dispensable for steady-state BCP-ALL proliferation and viability. However, efficient leukemia migration and adhesion to stromal cells are significantly dependent on stromal galectin-3. Importantly, the loss of stromal galectin-3 production sensitized BCP-ALL cells to conventional chemotherapy. We therefore tested novel carbohydrate-based small molecule compounds (Cpd14 and Cpd17) with high specificity for galectin-3. Consistent with results obtained using galectin-3-knockout stromal cells, treatment of stromal-BCP-ALL co-cultures inhibited BCP-ALL migration and adhesion. Moreover, these compounds induced anti-leukemic responses in BCP-ALL cells, including a dose-dependent reduction of viability and proliferation, the induction of apoptosis and, importantly, the inhibition of drug resistance. Collectively, these findings indicate galectin-3 regulates BCP-ALL cell responses to chemotherapy through the interactions between leukemia cells and the stroma, and show that a combination of galectin-3 inhibition with conventional drugs can sensitize the leukemia cells to chemotherapy.

Keywords: B-cell precursor ALL; adhesion; carbohydrate-based galectin-3 inhibitor; drug resistance; galectin; galectin-3; glycomimetic; lgals3; microenvironment; migration; monosaccharide; taloside.


Conflict of interest statement

The authors declare no conflict of interest.

Figures

Figure 1
Figure 1
Bone marrow stromal cells produce galectin-3. (A) MSC from two different normal BMT donor screens MSC-1 and MSC-2 were grown out as adherent cells. FACS analysis on the indicated populations using the gating strategy shown in the figure. (B) Schematic co-culture system. Stromal cells have been mitotically inactivated. They support the leukemia cells but no longer can divide. (C) Comparison of human primary bone marrow MSC with mouse bone marrow MSC OP9 cells for ability to protect human BCP-ALL US7 cells against chemotherapy. Right panel: viability (viable cell number/total cell number × 100) determined using Trypan blue. Left panel: total cell number. Stromal cells were mitotically inactivated by treatment with 10 μg/mL mitomycin C. Analysis on day seven of 1 nM vincristine treatment (comparison with OP9 cells, triplicate samples harvested in a single experiment. One-way ANOVA, Tukey’s multiple comparisons). hMSC-1 and hMSC-CG, primary and immortalized human MSC. ** p < 0.01, *** p < 0.001, **** p < 0.0001.
Figure 2
Figure 2
Protective stromal cells provide Gal3 to BCP-ALL cells. (A) Total Gal3 expression in 10,000 fixed and permeabilized OP9 stromal cells of the indicated genotypes. (B) Western blot of the indicated BCP-ALLs grown for >four days with OP9-EV, Gal3-KO or Gal3-KO + hGal3 cells. BCP-ALL cells were harvested from the medium.
Figure 3
Figure 3
Gal3 deficiency in stromal cells impairs BCP-ALL cell adhesion and migration. Adhesion of BCP-ALL cells to Gal3-deficient OP9 and control stroma presented as number of viable cells. (A) US7 cells after 24 and 72 h of migration and adhesion. (B) TXL2 cells at 24 and 72 h. (A,B) BCP-ALL cells in the supernatant (floating) and attached to OP9 stroma (adhered) were both determined. (C) Adhesion of US7 or TXL2 cells to the OP9 cells of the indicated genotype measured after 24 h. OP9-hGal3: OP9 Gal3-KO cells expressing hGal3. (D) Migration of US7 or TXL2 cells over a 4 h period toward OP9 Gal3-KO stroma and control OP9-EV cells measured using a Transwell assay. Motility in the presence of medium was used as readout for random (spontaneous) migration. Error bars, mean ± SEM of duplicate values in (C,D) or triplicates for (A,B) samples. (A,B) two-way ANOVA, Šidák’s multiple comparison test; (C,D) one-way ANOVA, Tukey’s multiple comparison test. Adjusted p-values. * p < 0.05.
Figure 4
Figure 4
Depletion of Gal3 in stromal cells significantly enhances BCP-ALL cell response to chemotherapy. (A) Viability of US7 cells grown on the indicated OP9 cells treated with solvent as control, or with 2 nM vincristine. (B) Viability of TXL2 cells plated on different OP9 cells and treated with 20 nM nilotinib. Panels (A,B): 2-way ANOVA comparing samples per time point, Tukey’s multiple comparison test; only statistical analysis of comparisons between vincristine-treated cells on OP9-Gal3-KO and OP9-EV are shown. (C) Cell numbers of analysis similar to panel (A). (D) Cell numbers of analysis similar to panel B. Panels (C,D): 2-way ANOVA comparing samples at each time point, Šidák’s multiple comparison test. (E) Viability of US7 cells grown on the indicated OP9 cells treated with solvent as control, or with 2 nM vincristine (F) Viability of TXL2 cells plated on the different OP9 cells and treated with 20 nM nilotinib. (G) Cell numbers of samples in panel (E). (H) Cell numbers of samples in panel (F). OP9-Gal3 KO cells reconstituted with human Gal3 are indicated as hGal3. Panels (EH): 2-way ANOVA comparing samples at each time point, Tukey’s multiple comparison test. Only values with significant differences are shown. Other comparisons, not significantly different. Panels (AD): error bars, mean ± SEM of 3–4 replicates per time point. Panels (EH): two replicates per time point. * p < 0.05, ** p < 0.01, *** p < 0.001, **** p < 0.0001. Viability is the percentage of Trypan blue excluding cells/total cells.
Figure 5
Figure 5
Effects of Cpd14 or 17 on BCP-ALL migration and adhesion. Adhesion of US7 (A) or TXL2 cells (B) to fibronectin-coated wells with and without the indicated amounts of Cpd14 in a 30-min assay. Migration of US7 (C) or TXL2 (D) to OP9 or to 200 ng/mL of the chemokine SDF-1α (24 and 4 h, respectively) in a Transwell assay when treated with the indicated concentrations of Cpd14. (E) Adhesion of ICN13 cells to OP9 stroma measured after 24 h in the presence of the indicated concentrations of Cpd17. Cells in suspension and adherent to (above and underneath) the OP9 cells were harvested and counted by Trypan blue exclusion. Results are presented as percentage of living [Trypan-blue excluding] leukemia cells adhering to OP9. Error bars, mean ± SEM of triplicate values for panels (A,B,E) or duplicate wells for panels (C,D); ctrl, DMSO control. One-way ANOVA, Dunnett;’s multiple comparison test. Adjusted p-values. * p < 0.05, ** p < 0.01, *** p < 0.001, **** p < 0.0001.
Figure 6
Figure 6
Analysis of effects of Cpd14 and 17 on cell cycle and apoptosis. (A) Cell cycle of US7 cells measured by DNA PI staining using FACS, following 48 h exposure to 250 µM Cpd14. Left: percentage of BCP-ALL cells in S phase; Right: representative image, arrow points to S phase DNA content. Error bars, mean ± SEM of duplicate measurements. * p < 0.05, unpaired t-test, two-tailed. (B) Percentage of BCP-ALL cells as indicated in S phase after 48-h treatment with 250 μM Cpd14. Single samples, 3 different BCP-ALLs. (C) Cell cycle analysis on US7 cells treated with Cpd17 using FACS and PI DNA staining. Duplicate measurements, 2-way ANOVA, differences not significant. PHA, 1 μM PHA-739358 (danusertib), single sample. (D) Percentage of apoptotic US7 cells based on AnnexinV/PI positivity after treatment with Cpd17.
Figure 7
Figure 7
Determination of IC50 values for Cpd17. (A) For IC50 determination, cells were incubated with different concentrations of Cpd17 for three days without OP9 cells. Cell counts were done using Alamar blue. Error bars, mean ± SEM of independent triplicate IC50 determinations. (BE) Different ALLs as indicated were co-cultured with OP9 cells for eight days and treated with ≈IC50 concentrations of Cpd17. Top panels, cell numbers; lower panels viability determined by Trypan blue exclusion. Representative results from three independent experiments. Note: cell viability is defined here as the number of Trypan blue excluding cells in Cpd17 treatment group/number of Trypan blue excluding cells in group treated with solvent DMSO at each time point. Error bars, mean ± SEM of triplicate samples. Two-way ANOVA, Šidák’s multiple comparison test. Each point compares vehicle to Cpd17 on the same day. ** p < 0.01, **** p < 0.0001.
Figure 8
Figure 8
Proliferation of BCP-ALLs under combination treatment with Cpd17. Cells were treated with DMSO, mono-treatment or combination as indicated. Fresh drugs were added with each change of medium. Cell counts by Trypan blue exclusion in DMSO and Cpd17 groups were terminated (on day 12–14 for DMSO and Cpd17-only samples, later in vincristine-only resistance) when growth exceeded well capacity in panels (AF). Results presented are average of three replicates +/− SD of one experiment. Note the discontinuity of the Y-axis. (A) US7 treated with 1 μM Cpd17 and 2 nM vincristine. Vincristine alone or vincristine + Cpd17 compared to DMSO, significantly different starting at d7 (not indicated in the figure). (B) US7 treated with 5 μM Cpd17 and 2 nM vincristine. Vincristine alone or vincristine + Cpd17 compared to DMSO, significantly different starting at d9. (C) ICN13 treated with 1 μM Cpd17 and 2 nM vincristine. Vincristine alone or vincristine + Cpd17 compared to DMSO, significantly different starting at d7. Vincristine compared to vincristine + Cpd17 significantly different on d9 and d12 as indicated in the figure [green asterisk]. (D) ICN13 treated with 5 μM Cpd17 and 2 nM vincristine. Vincristine alone or vincristine + Cpd17 compared to DMSO, significantly different starting at d5. Also significant differences between vincristine alone and vincristine + Cpd17 on d5, d7, d9 and d12 as indicated. (E) ICN3 treated with 5 μM Cpd17 and 2 nM vincristine. Difference between DMSO and vincristine alone or vincristine + Cpd17 significant starting from d9. Vincristine alone and vincristine + Cpd17, significantly different on d5, d7, d9, d12 [green asterisk]. (F) ICN06 treated with 5 μM Cpd17 and 2 nM vincristine. Vincristine alone and vincristine + Cpd17, significantly different on d5, d7, d9 [green asterisk]. (G) TXL2 treated with 40 μM Cpd17 and 5 nM nilotinib. Cpd17 was administered at 10 μM on day 0, increased to 20 μM on day six and further increased to 40 μM on day 10 as indicated by #, because drug combination effects were minimal at 10 or 20 μM. Nilotinib alone and nilotinib + Cpd17, significantly different from DMSO starting at d6. Nilotinib compared to nilotinib + Cpd17 significantly different on d17, d22 [green asterisks]. Cpd17 compared to DMSO different from d13–d23 [red asterisks]. Panel G: 2-way ANOVA, Tukey’s multiple comparison test. Panels (AF): 2-way ANOVA, Šidák’s multiple comparison test for vincristine versus vincristine + Cpd17; adjusted p-values. * p < 0.05, ** p < 0.01, *** p < 0.001, **** p < 0.0001.

Similar articles

Cited by

References

    1. Choi S., Henderson M.J., Kwan E., Beesley A.H., Sutton R., Bahar A.Y., Giles J., Venn N.C., Pozza L.D., Baker D.L., et al. Relapse in children with acute lymphoblastic leukemia involving selection of a preexisting drug-resistant subclone. Blood. 2007;110:632–639. doi: 10.1182/blood-2007-01-067785. - DOI - PubMed
    1. Chiarini F., Lonetti A., Evangelisti C., Buontempo F., Orsini E., Evangelisti C., Cappellini A., Neri L.M., McCubrey J.A., Martelli A.M. Advances in understanding the acute lymphoblastic leukemia bone marrow microenvironment: From biology to therapeutic targeting. Biochim. Biophys. Acta. 2016;1863:449–463. doi: 10.1016/j.bbamcr.2015.08.015. - DOI - PubMed
    1. Meads M.B., Hazlehurst L.A., Dalton W.S. The bone marrow microenvironment as a tumor sanctuary and contributor to drug resistance. Clin. Cancer Res. 2008;14:2519–2526. doi: 10.1158/1078-0432.CCR-07-2223. - DOI - PubMed
    1. Schroeder M.A., DiPersio J.F. Mobilization of hematopoietic stem and leukemia cells. J. Leukoc. Biol. 2012;91:47–57. doi: 10.1189/jlb.0210085. - DOI - PubMed
    1. Stamatopoulos B., Meuleman N., De Bruyn C., Pieters K., Mineur P., Le Roy C., Saint-Georges S., Varin-Blank N., Cymbalista F., Bron D., et al. AMD3100 disrupts the cross-talk between chronic lymphocytic leukemia cells and a mesenchymal stromal or nurse-like cell-based microenvironment: Pre-clinical evidence for its association with chronic lymphocytic leukemia treatments. Haematologica. 2012;97:608–615. doi: 10.3324/haematol.2011.052779. - DOI - PMC - PubMed

MeSH terms