. 2021 Nov 10;22(22):12172.
doi: 10.3390/ijms222212172.

There Is Strength in Numbers: Quantitation of Fc Gamma Receptors on Murine Tissue-Resident Macrophages

Affiliations

There Is Strength in Numbers: Quantitation of Fc Gamma Receptors on Murine Tissue-Resident Macrophages

Christof Vorsatz et al. Int J Mol Sci. .

Abstract

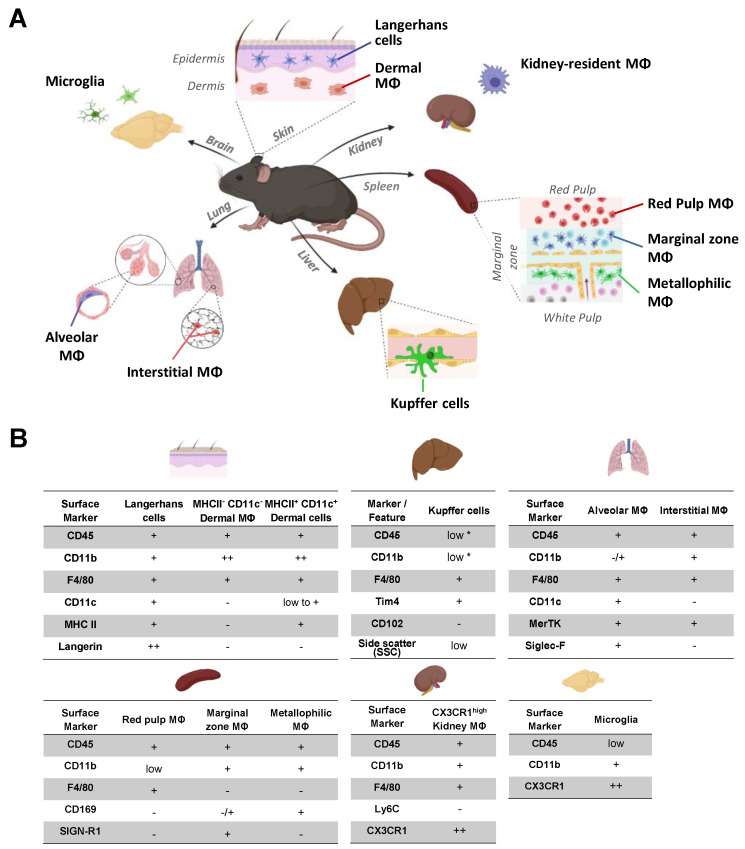
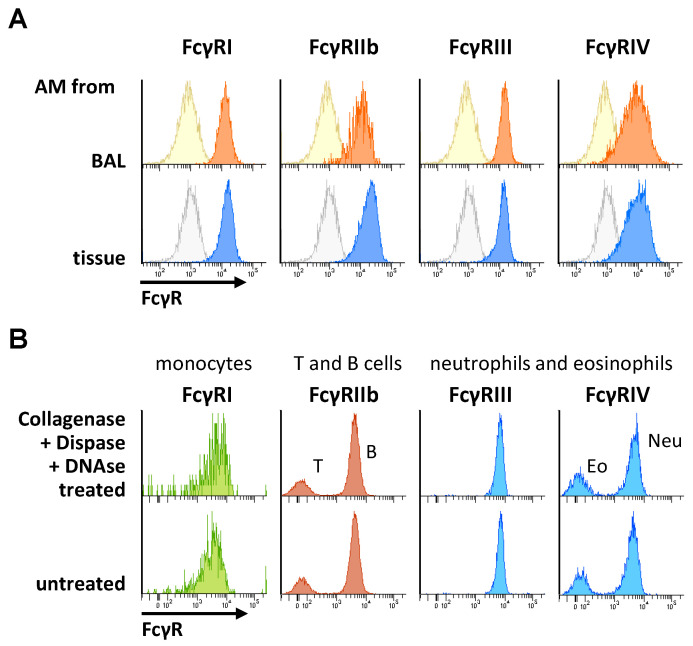
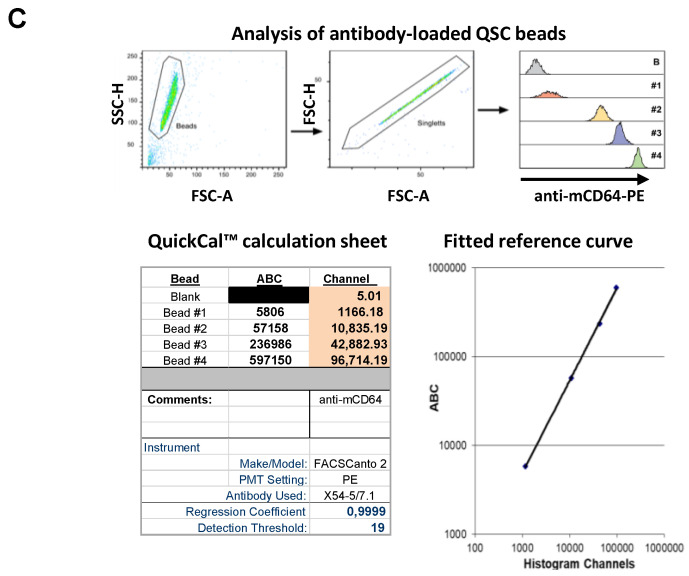
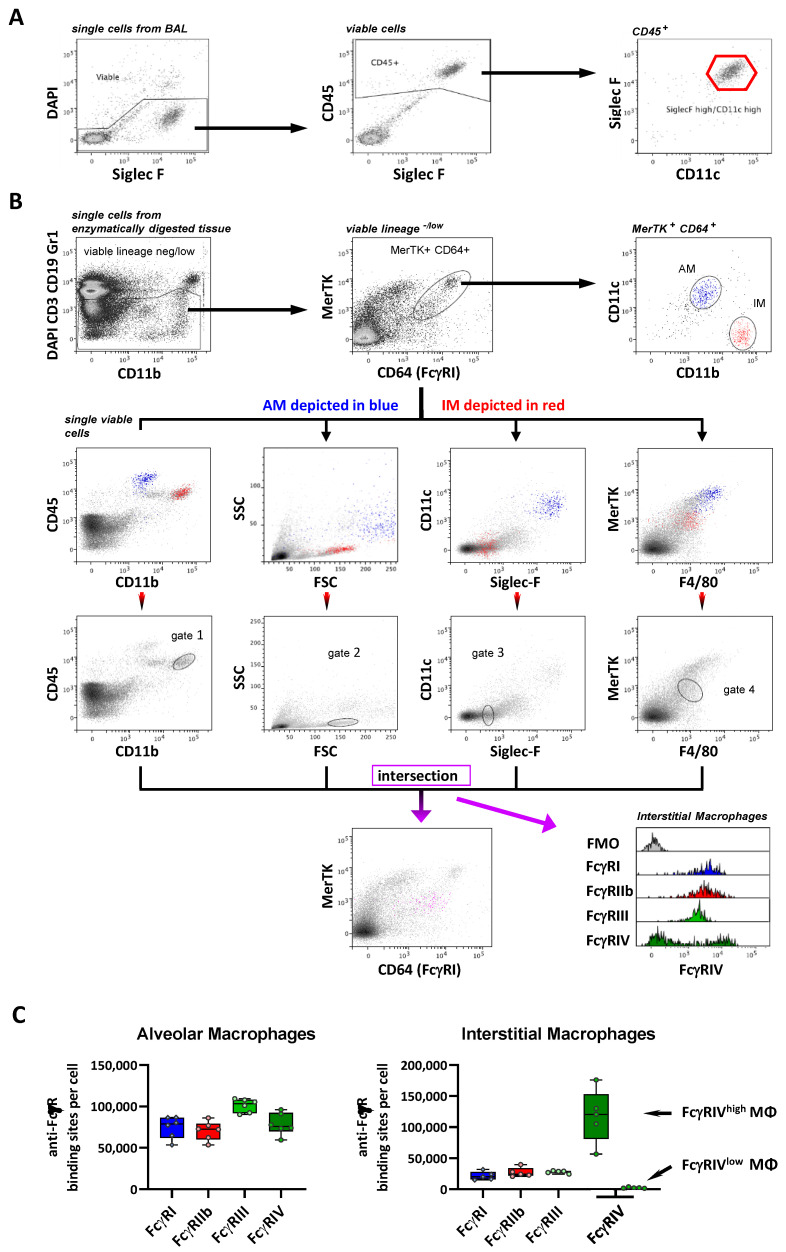
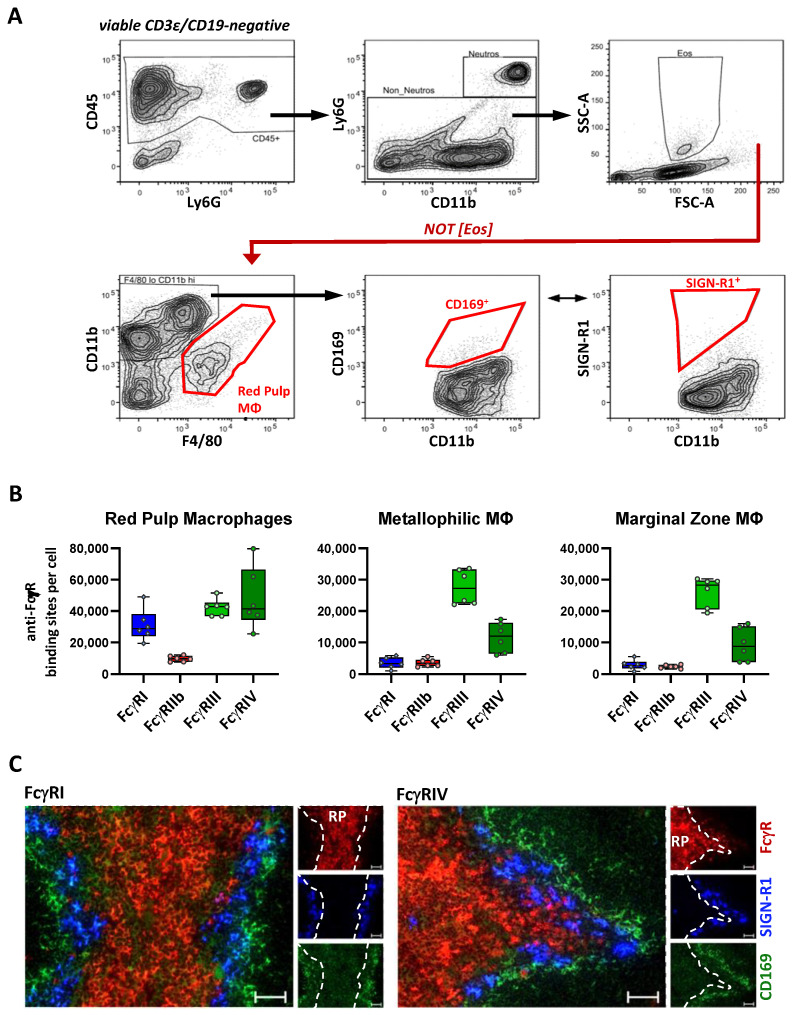
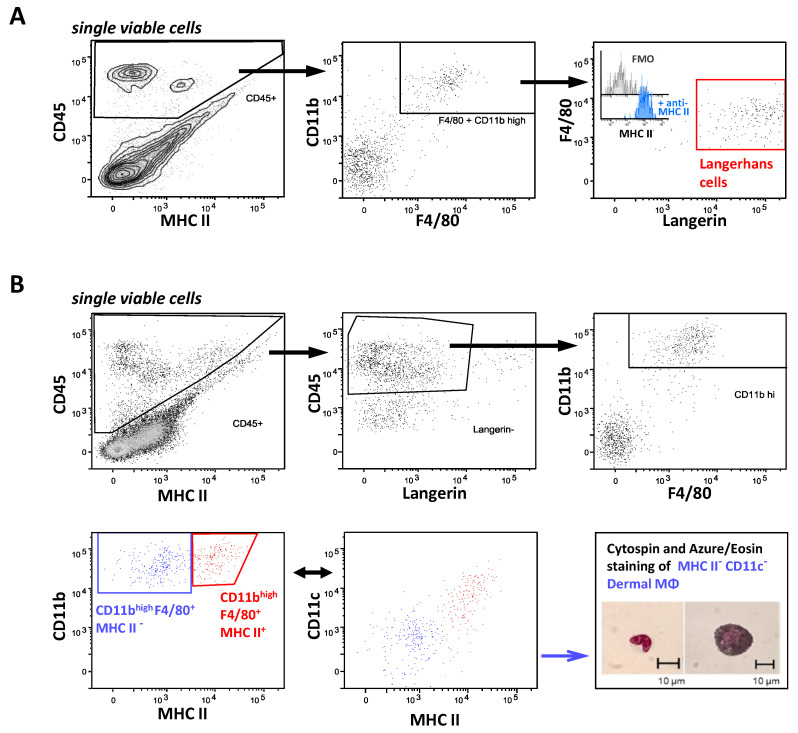
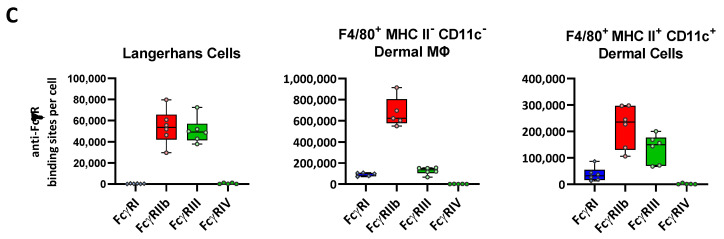
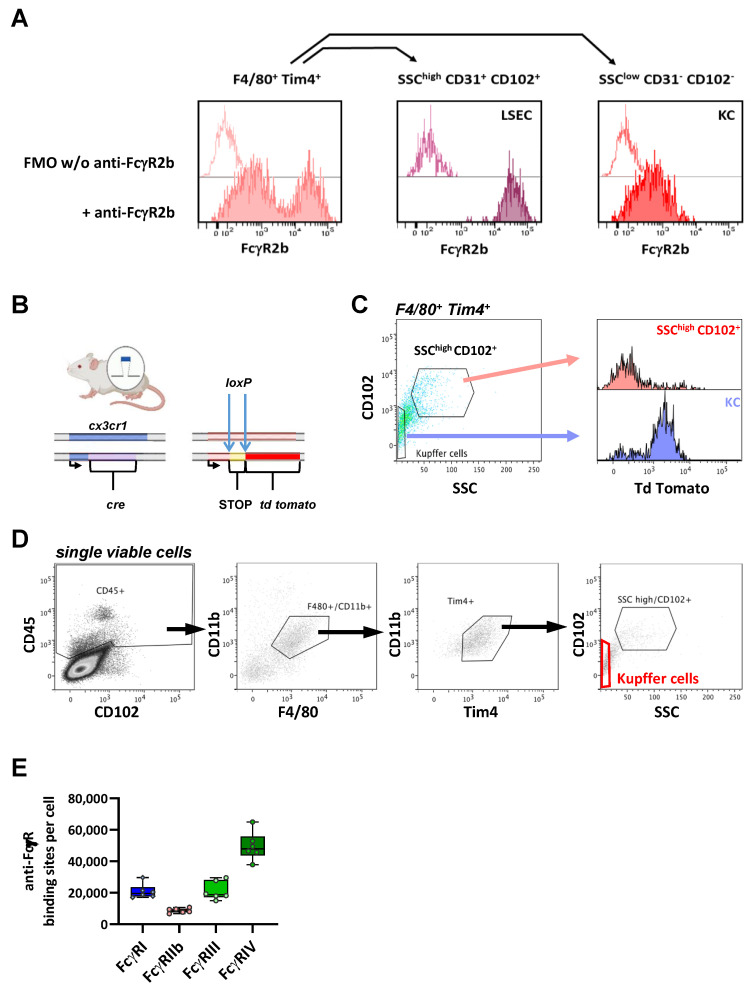
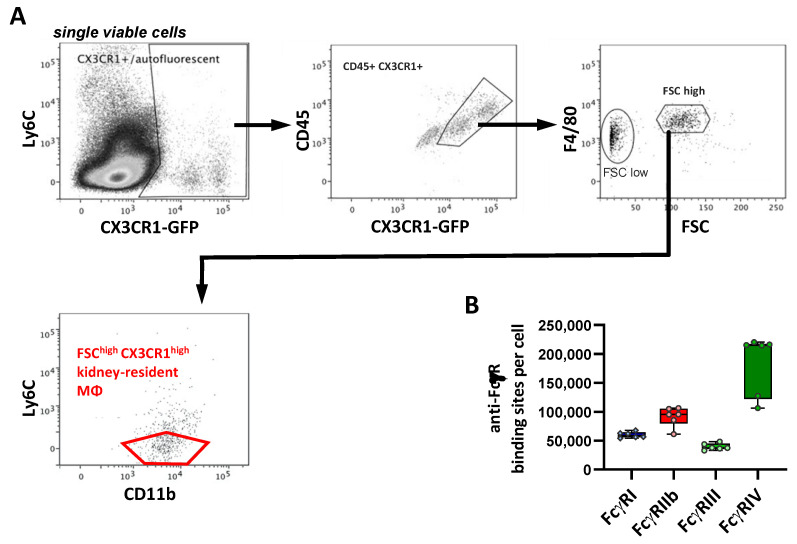
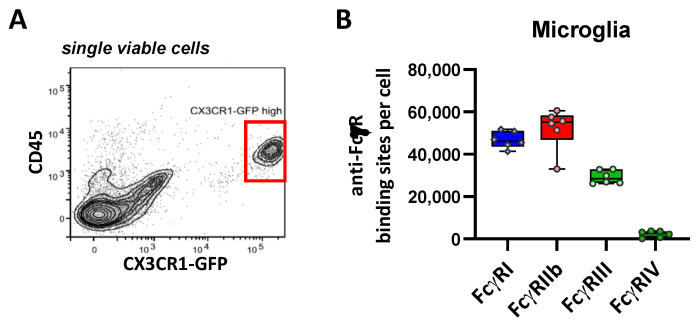
Many of the effector functions of antibodies rely on the binding of antibodies/immune complexes to cellular Fcγ receptors (FcγRs). Since the majority of innate immune effector cells express both activating and inhibitory Fc receptors, the outcome of the binding of immune complexes to cells of a given population is influenced by the relative affinities of the respective IgG subclasses to these receptors, as well as by the numbers of activating and inhibitory FcγRs on the cell surface. A group of immune cells that has come into focus more recently is the various subsets of tissue-resident macrophages. The central functions of FcγRs on tissue macrophages include the clearance of opsonized pathogens, the removal of small immune complexes from the circulation and the depletion of antibody-opsonized cells in the therapy of autoimmunity and cancer. Despite these essential functions of FcγRs on tissue-resident macrophages, an in-depth quantification of FcγRs is lacking. Thus, the aim of our current study was to quantify the various Fcγ receptors on macrophages in murine liver, lung, kidney, brain, skin and spleen. Our study identified a pronounced heterogeneity between FcγR expression patterns of the different tissue macrophages, which may reflect their specialized functions within their unique niches in different organ environments.

Keywords: Fc receptors; Kupffer cells; Langerhans cells; alveolar macrophages; antibodies; dermal macrophages; interstitial macrophages; kidney resident macrophages; macrophages; microglia; splenic macrophages.


Conflict of interest statement

The authors declare that they have no competing interests.

Figures

Figure 1
Figure 1
Markers allowing to identify tissue-resident macrophages subsets. (A) Schematic representation of the organs and organ-specific tissue-resident macrophages analyzed in this work, i.e., microglia from the brain; Langerhans cells from the epidermis and dermal macrophages from the dermis of the skin; kidney-resident macrophages, red pulp macrophages, the marginal zone and metallophilic macrophages from the spleen; Kupffer cells from the liver, alveolar macrophages from bronchoalveolar lavage and interstitial macrophages from tissue of the lung. (B) Depicted are the cell surface markers and cellular features of tissue-resident macrophages that were used for the identification of the respective macrophage population(s) by flow cytometry: no clear staining with the respective antibody; −/+, no clear shift upon staining with the respective antibody but “broadening” of the cell population in the corresponding dot plot; low, a distinct but minor shift upon staining with the respective antibody or low light scatter in comparison to several other cell populations; +, a distinct shift upon staining; ++, very prominent endogenous fluorescence (CX3CR1-GFP) or increase in fluorescence upon staining (Langerin, CD11b) in comparison to the other cell populations and *, low staining in comparison to fluorescence minus one control but adds to the pronounced autofluorescence, resulting in a high apparent fluorescence in total.
Figure 2
Figure 2
Impact of enzymatic digestions on FcγR expression analysis. (A) Depicted are the flow cytometric analyses of alveolar macrophages isolated by BAL (upper panels) or in enzymatically digested lung tissue (lower panels). Fluorescence intensities are shown for a respective FMO control (light ocher and light-blue histograms) or for cells stained with PE-conjugated antibodies directed against the indicated FcγRs. X-axis scaling for the BAL samples is identical to the depicted scaling of the tissue samples (B) Histograms showing the fluorescence intensities of the indicated murine peripheral blood leukocytes upon staining with PE-conjugated antibodies that are specific for the indicated FcγRs. The blood samples have been incubated without enzymes (lower panels) or with collagenase D, Dispase® and DNase I (upper panels) prior to antibody staining. X-axis scaling for the enzymatically treated samples is identical to the depicted scaling of the untreated samples. (C) Depicted is—as an example—the establishment of an anti-CD64 (FcγRI) reference curve for the deduction of the number of anti-FcγR-binding sites presented as the antibody-binding capacity (ABC) from the median fluorescence intensity. Five different types of QSC beads with known anti-mouse IgG-binding sites were loaded with an anti-FcγR antibody and analyzed by flow cytometry. Aggregated beads were excluded, and the fluorescence intensity of each single bead population was measured (upper panel). In the lower left panel, an excerpt from a QuickCal™ calculation sheet is shown, in which the detection threshold and quality of fitting (represented by the regression coefficient) are calculated from the known ABC values of the beads and measured fluorescence intensity (“channel”). The lower right panel depicts the reference curve for CD64 fitted to the anti-CD64-binding capacity (ABC) vs. fluorescence intensity (histogram channels) of the reference beads.
Figure 2
Figure 2
Impact of enzymatic digestions on FcγR expression analysis. (A) Depicted are the flow cytometric analyses of alveolar macrophages isolated by BAL (upper panels) or in enzymatically digested lung tissue (lower panels). Fluorescence intensities are shown for a respective FMO control (light ocher and light-blue histograms) or for cells stained with PE-conjugated antibodies directed against the indicated FcγRs. X-axis scaling for the BAL samples is identical to the depicted scaling of the tissue samples (B) Histograms showing the fluorescence intensities of the indicated murine peripheral blood leukocytes upon staining with PE-conjugated antibodies that are specific for the indicated FcγRs. The blood samples have been incubated without enzymes (lower panels) or with collagenase D, Dispase® and DNase I (upper panels) prior to antibody staining. X-axis scaling for the enzymatically treated samples is identical to the depicted scaling of the untreated samples. (C) Depicted is—as an example—the establishment of an anti-CD64 (FcγRI) reference curve for the deduction of the number of anti-FcγR-binding sites presented as the antibody-binding capacity (ABC) from the median fluorescence intensity. Five different types of QSC beads with known anti-mouse IgG-binding sites were loaded with an anti-FcγR antibody and analyzed by flow cytometry. Aggregated beads were excluded, and the fluorescence intensity of each single bead population was measured (upper panel). In the lower left panel, an excerpt from a QuickCal™ calculation sheet is shown, in which the detection threshold and quality of fitting (represented by the regression coefficient) are calculated from the known ABC values of the beads and measured fluorescence intensity (“channel”). The lower right panel depicts the reference curve for CD64 fitted to the anti-CD64-binding capacity (ABC) vs. fluorescence intensity (histogram channels) of the reference beads.
Figure 3
Figure 3
Characterization of the FcγR expression on pulmonary macrophages. (A) Depicted are single cells from the bronchoalveolar lavage (BAL). By selecting DAPI-negative cells, dead cell exclusion was performed. Next, the viable cells were subdivided based on their expression of CD45, Siglec F and CD11c. Among the CD45-positive populations, alveolar macrophages were identified by a pronounced expression of both Siglec F and CD11c. (B) Single cells from enzymatically digested lung tissue were stained with DAPI and antibodies specific for B-cell (CD19) and T-cell (CD3) markers, as well as Gr-1 (Ly6G and Ly6C) in a dump channel. Viable and CD19/CD3-negative cells and CD11b-positive Gr-1-negative-to-low cells were analyzed further to identify the macrophages as MerTK+ CD64+ cells. The IM were characterized as CD11bhigh CD11c−/low, shown in red, and AM as CD11blow CD11chigh in blue for comparison (upper panels). The IM and AM are marked in red and blue in dot plots for the various combinations of markers (second row of panels). The gates were set to identify IM in these dot plots (third row of panels). The intersection of these gates, depicted in magenta, was used to define a population that corresponds to the CD64+ MerTK+ IM in the anti-CD64-stained sample (lower panel). (C) Depicted are the number of anti-FcγR-binding sites per cell as a quantitative correlate of the FcγR receptor expression. Data are presented as box plots showing the median and interquartile range and whiskers showing extremes together with all single values. n = 6 for AM and 5 for IM.
Figure 4
Figure 4
Characterization of the FcγR expression on splenic macrophages. (A) Depicted is the gating strategy for splenic macrophages. B, T and dead cells were excluded by using a dump channel (using CD19 and CD3e and DAPI). From CD45-positive leukocytes, neutrophils were excluded by Ly6G expression and eosinophils by their light scatter characteristics with high side scatter (SSC). Within the remaining leukocyte population, red pulp macrophages were characterized by low CD11b expression and pronounced F4/80 expression. Among CD11b-high cells with no or low F4/80 staining, metallophilic macrophages were characterized by the expression of CD169. Cells with a high expression of SIGN-R1 were regarded as marginal zone macrophages. (B) Shown are the number of anti-FcγR-binding sites per cell as a quantitative correlate of the FcγR expression on RPM, the marginal zone and metallophilic MΦ. Data are presented as box plots showing the median and interquartile range and whiskers presenting extremes with all single values. n = 6. (C) Analysis of the FcγRI and RIV expression on splenic macrophages by fluorescence microscopy. FcγRI (left panel) and FcγRIV (right panel) are shown in red. The presence of SIGN-R1 and CD169 is indicated by blue or green, respectively. Shown is the overlay of FcγR, SIGN-RI and CD169, as well as each single fluorescence channel. In the single-channel pictures, the position of the red pulp is shown based on its demarcation from the SIGN-R1-positive macrophages (dashed line). Scale bars represent 50 µm.
Figure 5
Figure 5
Characterization of the FcγR expression on skin macrophage subsets. (A) Shown is the gating strategy for the identification of Langerhans cells. CD45-positive populations among single viable cells from an enzymatically digested epidermis were examined for expression of the surface markers CD11b and F4/80. Among CD11b and F4/80-double-positive cells, Langerhans cells were identified by a pronounced expression of Langerin. The histogram inset in the right panel depicts their MHC II expression by comparing the fluorescence in the samples without (FMO, grey histogram) and with anti-MHC II antibody (blue histogram). (B) Gating strategy for Langerin-negative F4/80-positive dermal cells. Single viable cells from enzymatically digested and dermis-enriched skin were analyzed regarding their CD45 and Langerin expression to exclude Langerhans cells among the CD45-positive leukocytes. Among the CD45+ Langerin-negative cells, two subpopulations within the CD11b and F4/80-positive cells were distinguished based on a high or low level of MHC II expression (depicted in blue or red), respectively. Both population were then examined for CD11c expression. Inset: Microscopic analysis of the sorted MHC II CD11c DM. (C) Depicted is the ABC for each FcγR per cell as a quantitative correlate of the individual FcγR numbers. Data are presented as box plots showing the median and interquartile range and whiskers depicting extremes together with all single values. n = 6 or 5 upon the exclusion of single outliers according to the Grubbs’ test with alpha = 0.1.
Figure 5
Figure 5
Characterization of the FcγR expression on skin macrophage subsets. (A) Shown is the gating strategy for the identification of Langerhans cells. CD45-positive populations among single viable cells from an enzymatically digested epidermis were examined for expression of the surface markers CD11b and F4/80. Among CD11b and F4/80-double-positive cells, Langerhans cells were identified by a pronounced expression of Langerin. The histogram inset in the right panel depicts their MHC II expression by comparing the fluorescence in the samples without (FMO, grey histogram) and with anti-MHC II antibody (blue histogram). (B) Gating strategy for Langerin-negative F4/80-positive dermal cells. Single viable cells from enzymatically digested and dermis-enriched skin were analyzed regarding their CD45 and Langerin expression to exclude Langerhans cells among the CD45-positive leukocytes. Among the CD45+ Langerin-negative cells, two subpopulations within the CD11b and F4/80-positive cells were distinguished based on a high or low level of MHC II expression (depicted in blue or red), respectively. Both population were then examined for CD11c expression. Inset: Microscopic analysis of the sorted MHC II CD11c DM. (C) Depicted is the ABC for each FcγR per cell as a quantitative correlate of the individual FcγR numbers. Data are presented as box plots showing the median and interquartile range and whiskers depicting extremes together with all single values. n = 6 or 5 upon the exclusion of single outliers according to the Grubbs’ test with alpha = 0.1.
Figure 6
Figure 6
Characterization of FcγR expression on hepatic Kupffer cells. (A) Depicted is the fluorescence of F4/80 Tim4-double-positive liver cells with or without anti-FcγRIIb, respectively. Among these F4/80+ Tim4+ cells, FcγRIIb expression was analyzed in populations with either a high side scatter (SSC) and the presence of endothelial markers CD31 and CD102 (medium panel) or a low side scatter and the absence of CD31 and CD103 (right panel). (B) Genetic characteristics of BL6 Rosa26-td tomato x BL6 cx3cr1-cre mice. In these mice, one allele of the CX3CR1 locus mice encodes a Cre recombinase under control of the CX3CR1 promoter. In addition, one allele of the Rosa 26 locus contains a td tomato gene with a preceding floxed STOP cassette. (C) Depicted is the tdTomato expression in the F4/80+ Tim4+ subpopulations that were either SSChigh CD102+ or CD102-negative with a low light side scatter, which represents hepatic Kupffer cells. (D) Gating strategy for the identification of Kupffer cells. Among single viable cells from enzymatically digested liver, the CD45+ leukocytes were analyzed with respect to CD11b, F4/80 and Tim4 expression. Among the cells positive for all three markers, we characterized KC by their low side scatter and absence of endothelial marker CD102. (E) Depicted is the ABC for each FcγR per cell as a quantitative correlate of the individual FcγR numbers. Data are presented as box plots depicting the median and interquartile range and whiskers showing extremes together with all the single values; n = 6.
Figure 7
Figure 7
Characterization of FcγR expression on kidney-resident macrophages. (A) Gating strategy for the identification of kidney-resident MΦ. Single viable cells from enzymatically digested kidneys of B6 cx3cr1+/gfp mice were examined for cx3rcr1 promoter-driven GFP and CD45 expression. CD45+ CX3CR1+ cells were then analyzed with respect to F4/80 expression and cell size, as reflected by their forward light scatter characteristics (FSC). In the F4/80+ FSChigh population, we then selected cells that were negative for Ly6C but positive for CD11b. (B) Depicted are the number of anti-FcγR-binding sites per cell as a quantitative correlate of FcγR expression. Data are presented as box plots depicting the median and interquartile range and whiskers showing extremes together with all single values; n = 6.
Figure 8
Figure 8
Characterization of FcγR expression on the microglia. (A) Flow cytometric characterization of microglia. Viable cells from a single cell suspension of the enzymatically digested and myelin-ablated brain of B6 cx3cr1+/gfp mice were examined for cx3rcr1 promoter-driven GFP expression and CD45 expression. (B) Depicted are the number of anti-FcγR-binding sites per cell as the quantitative correlate of Fc receptor expression. Data are presented as box plots depicting the median and interquartile range and whiskers showing extremes together with all single values; n = 6.

References

    1. Hirayama D., Iida T., Nakase H. The phagocytic function of macrophage-enforcing innate immunity and tissue homeostasis. Int. J. Mol. Sci. 2018;19:92. doi: 10.3390/ijms19010092. - DOI - PMC - PubMed
    1. Watanabe S., Alexander M., Misharin A.V., Budinger G.R.S. The role of macrophages in the resolution of inflammation. J. Clin. Investig. 2019;129:2619–2628. doi: 10.1172/JCI124615. - DOI - PMC - PubMed
    1. Hine A.M., Loke P. Intestinal Macrophages in Resolving Inflammation. J. Immunol. 2019;203:593–599. doi: 10.4049/jimmunol.1900345. - DOI - PMC - PubMed
    1. Anfray C., Ummarino A., Andón F.T., Allavena P. Current Strategies to Target Tumor-Associated-Macrophages to Improve Anti-Tumor Immune Responses. Cells. 2019;9:46. doi: 10.3390/cells9010046. - DOI - PMC - PubMed
    1. Jaiswal S., Chao M.P., Majeti R., Weissman I.L. Macrophages as mediators of tumor immunosurveillance. Trends Immunol. 2010;31:212–219. doi: 10.1016/j.it.2010.04.001. - DOI - PMC - PubMed

MeSH terms

LinkOut - more resources