. 2021 Nov 11;22(22):12199.
doi: 10.3390/ijms222212199.

Ets1 Promotes the Differentiation of Post-Selected iNKT Cells through Regulation of the Expression of Vα14Jα18 T Cell Receptor and PLZF

Affiliations

Ets1 Promotes the Differentiation of Post-Selected iNKT Cells through Regulation of the Expression of Vα14Jα18 T Cell Receptor and PLZF

Ya-Ting Chuang et al. Int J Mol Sci. .

Abstract

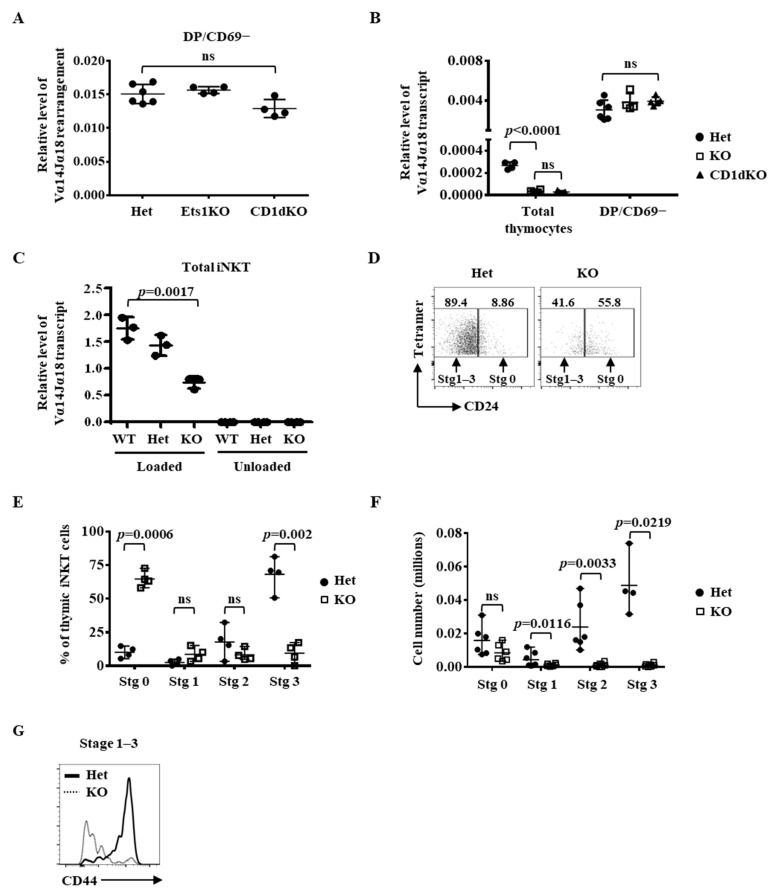
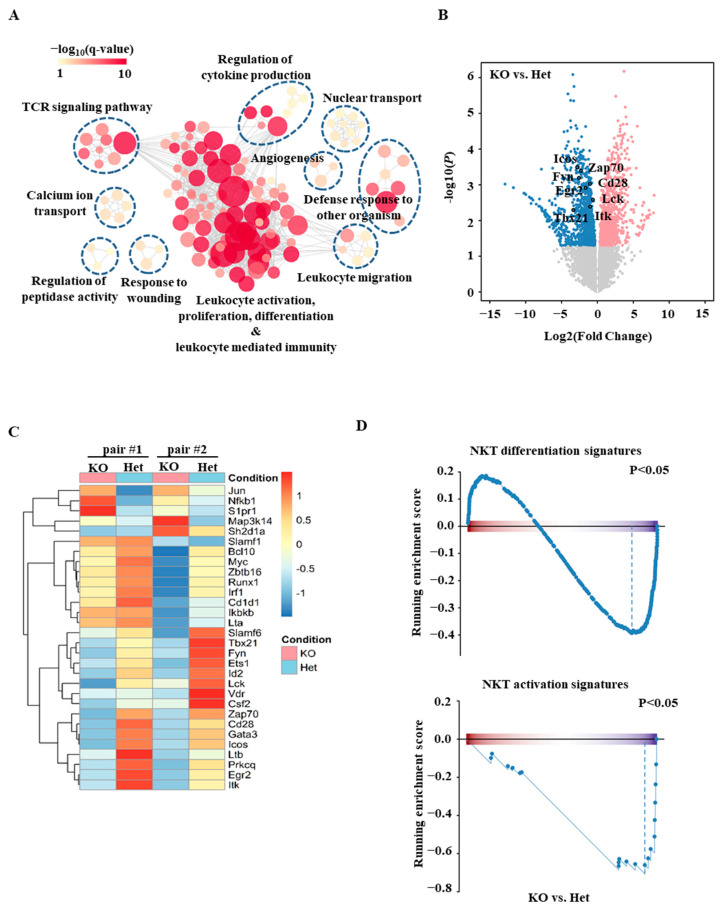
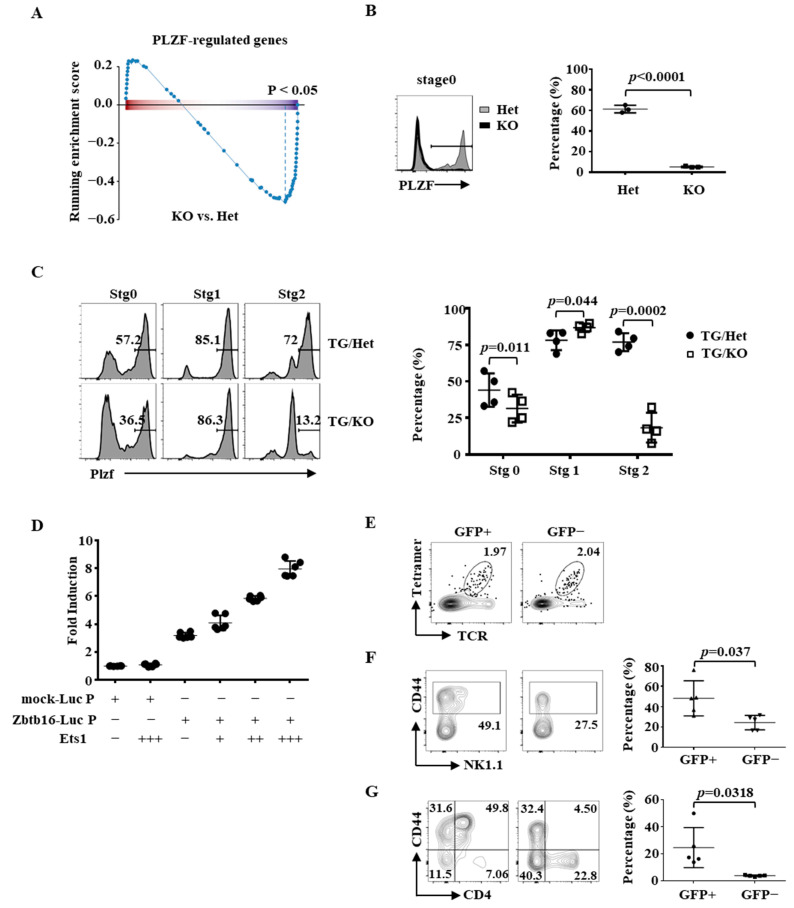
The transcription factor Ets1 is essential for the development/differentiation of invariant Natural Killer T (iNKT) cells at multiple stages. However, its mechanisms of action and target genes in iNKT cells are still elusive. Here, we show that Ets1 is required for the optimal expression of the Vα14Jα18 T cell receptor (TCR) in post-selected thymic iNKT cells and their immediate differentiation. Ets1 is also critical for maintaining the peripheral homeostasis of iNKT cells, which is a role independent of the expression of the Vα14Jα18 TCR. Genome-wide transcriptomic analyses of post-selected iNKT cells further reveal that Ets1 controls leukocytes activation, proliferation differentiation, and leukocyte-mediated immunity. In addition, Ets1 regulates the expression of ICOS and PLZF in iNKT cells. More importantly, restoring the expression of PLZF and the Vα14Jα18 TCR partially rescues the differentiation of iNKT cells in the absence of Ets1. Taken together, our results establish a detailed molecular picture of how Ets1 regulates the stepwise differentiation of iNKT cells.

Keywords: Ets1; ICOS; PLZF; iNKT cells.


Conflict of interest statement

The authors declare no conflict of interest.

Figures

Figure 1
Figure 1
A dispensable role of Ets1 in the expression of Vα14Jα18 TCR in thymic iNKT precursors and their selection. A-C. Genomic DNA (A) and cDNA (B,C) were prepared from total thymocytes (B), sorted CD69− DP thymocytes (A,B), and total iNKT cells (C) of indicated genotype and subjected to quantitative PCR using primers corresponding to the Vα14 and Jα18 regions. (DG) Thymic iNKT cells were identified with TCR and loaded CD1d tetramer and then subsequently separated into stage 0 and stage 1–3 based on the level of CD24 (D). Stage 1–3 cells were further fractionated into stage 1, 2, and 3 based on the expression of NK1.1 and CD44. The percentage of each stage of iNKT cells among total iNKT cells and their absolute numbers were calculated and are shown in E and F, respectively. G. CD44 staining of stage 1–3 iNKT cells is shown. The data shown in Figure 1 are compiled from at least three pairs of mice.
Figure 2
Figure 2
Enrichment of iNKT cells by CD1d-tetramers. (A) CD1d-tetramer-enriched iNKT cells from the indicated genotype were identified with TCR and loaded CD1d tetramer (left panels), subsequently separated into stage 0 and stage 1–3 based on the level of CD24, NK1.1, and CD44 (right panels). (B) Enriched iNKT cells from the indicated genotype were subjected to quantitative PCR using primers corresponding to the transcripts of Vα14 Jα18 TCR, PLZF, and IL-17rb. (C) Ki67 staining of stage 0 iNKT cells is shown.
Figure 3
Figure 3
Transcriptomic analyses of Ets1KO iNKT cells. Stage 0 iNKT cells from Het and Ets1KO mice were sorted and subjected to RNA-based next-generation sequencing (RNA-seq). (A) The enrichment map shows the significantly suppressed functions in KO compared with Het stage 0 iNKT cells. Nodes are GO gene sets, and edges indicate shared genes between GO gene sets. Node size represents the number of perturbed genes in a given set. (B,C) Differences in various genes’ expression in Het and KO stage 0 iNKT cells are shown in a volcano plot (B) and a heat map (C). p-value < 0.05 was used to identify differentially expressed genes in the volcano plot. The heat map represents data from two independent RNA-seq. (D) The results of GSEA analyses of NKT differentiation signatures (upper panel) and NKT activation signature (lower panel) of Het and KO stage 0 iNKT cells are shown.
Figure 4
Figure 4
Partial rescue of the differentiation of Ets1KO iNKT cells with a Vα14Jα18 TCR transgene. (A) The result of GSEA analysis of the TCR signaling pathway is shown. (B) The surface level of TCR and CD5 in thymic iNKT cells of indicated genotypes was compared in the histogram. (C) Representative NK1.1/CD44 plots of splenic iNKT cells of indicated genotypes are shown. The percentages of stage 1 and stage 2 splenic iNKT cells from six pairs of TG/KO and TG/Het mice are shown in the right panel. (D,E) The percentage and absolute numbers of total, CD4+, and CD4− iNKT cells in spleens (D) and livers (E) of indicated genotypes are shown. Representative CD4/CD44 FACS plots of splenic iNKT cells of indicated genotypes are also shown in (D).
Figure 5
Figure 5
Identification of ICOS as a target gene of Ets1. (A) cDNA was prepared from various thymic iNKT subpopulations of indicated genotypes, and the transcript levels of ICOS were quantified with quantitative PCR. (B,C) The surface levels of ICOS in different stages of thymic iNKT cells (B) and peripheral iNKT cells (C) are shown. (D) Activated Th cells were subjected to ChIP analysis using anti-Ets1 or control IgG. The recruitment of Ets1 to the promoter of ICOS, CD127, and TLR7 was examined with quantitative PCR. (E,F). Bone marrow cells transduced with RV vector alone (RV) or GFP− ICOS-RV (RV-ICOS) and stained with ICOS. The co-expression of ICOS and GFP are shown in (E). Splenic iNKT cells of WT mice reconstituted with GFP−ICOS retrovirus-transduced TG/KO bone marrow cells were identified with TCR/CD1d-tetramer (the upper panel of (F)) and divided into GFP+ (transduced) and GFP− (un-transduced) populations (the upper panels of (F)). The distribution of stage 1, 2, and 3 GFP+ and GFP− donor iNKT cells was determined by NK1.1 and CD44. Representative FACS plots are shown in the bottom panels of (F). Cumulative data from six mice are shown in the right panel of (F). Statistical analyses were performed with a paired Student’s t test.
Figure 6
Figure 6
Partial rescue of the differentiation/homeostasis of TG/KO iNKT with PLZF. (A) The result of GSEA analyses of Zbtb16 regulated genes is shown. (B) PLZF staining of stage 0 iNKT cells of the indicated genotypes is shown. The cumulative results are shown in the right panel. (C) PLZF staining of iNKT cells from various stages and indicated genotypes is shown. The cumulative results are shown in the right panel. (D) 293 cells were transfected with luciferase reporter only (mock-Luc P) or with Zbtb16 promoter region (Zbtb16-Luc P) and different amounts of Ets1 expression plasmid. The luciferase activity was normalized against internal control obtained from renilla luciferase activity. The normalized activity obtained from mock-Luc was arbitrarily set as 1. The data shown are from three independent experiments. (EG) Splenocytes of CD45.1 WT mice reconstituted with GFP-PLZF retrovirus-transduced CD45.2 TG/KO bone marrow cells were separated into CD45.2+GFP+ (transduced) and CD45.2+GFP− (un-transduced) populations and then, iNKT cells were identified with TCR/CD1d-tetramers (E). The distribution of stage 1, 2, and 3 as well as the expression of CD4 in GFP+ and GFP− CD45.2 iNKT cells were examined by FACS. Representative NK1.1/CD44 (F) and CD44/CD4 (G) plots and cumulative data from six mice (the right panels of (F,G)) are shown. Statistical analyses were performed with a paired Student’s t-test.

Similar articles

References

    1. Godfrey D.I., Stankovic S., Baxter A.G. Raising the NKT cell family. Nat. Immunol. 2010;11:197–206. doi: 10.1038/ni.1841. - DOI - PubMed
    1. Bendelac A., Savage P.B., Teyton L. The biology of NKT cells. Annu. Rev. Immunol. 2007;25:297–336. doi: 10.1146/annurev.immunol.25.022106.141711. - DOI - PubMed
    1. Gapin L., Matsuda J.L., Surh C.D., Kronenberg M. NKT cells derive from double-positive thymocytes that are positively selected by CD1d. Nat. Immunol. 2001;2:971–978. doi: 10.1038/ni710. - DOI - PubMed
    1. Bendelac A. Positive selection of mouse NK1+ T cells by CD1-expressing cortical thymocytes. J. Exp. Med. 1995;182:2091–2096. doi: 10.1084/jem.182.6.2091. - DOI - PMC - PubMed
    1. Benlagha K., Kyin T., Beavis A., Teyton L., Bendelac A. A thymic precursor to the NK T cell lineage. Science. 2002;296:553–555. doi: 10.1126/science.1069017. - DOI - PubMed

MeSH terms

Substances

LinkOut - more resources