. 2021 Nov 11;22(22):12205.
doi: 10.3390/ijms222212205.

Dissection of the Regulatory Elements of the Complex Expression Pattern of Puckered, a Dual-Specificity JNK Phosphatase

Affiliations

Dissection of the Regulatory Elements of the Complex Expression Pattern of Puckered, a Dual-Specificity JNK Phosphatase

Katerina Karkali et al. Int J Mol Sci. .

Abstract

For developmental processes, we know most of the gene networks controlling specific cell responses. We still have to determine how these networks cooperate and how signals become integrated. The JNK pathway is one of the key elements modulating cellular responses during development. Yet, we still know little about how the core components of the pathway interact with additional regulators or how this network modulates cellular responses in the whole organism in homeostasis or during tissue morphogenesis. We have performed a promoter analysis, searching for potential regulatory sequences of puckered (puc) and identified different specific enhancers directing gene expression in different tissues and at different developmental times. Remarkably, some of these domains respond to the JNK activity, but not all. Altogether, these analyses show that puc expression regulation is very complex and that JNK activities participate in non-previously known processes during the development of Drosophila.

Keywords: Drosophila; JNK; dual specificity phosphatase; gene expression.


Conflict of interest statement

The authors declare no competing financial interests.

Figures

Figure 1
Figure 1
puc genomic organization. The area expanding the gene puc expands around 26 Kb. It includes four exons (purple) that are conserved across all Drosophilae. Several P element insertions have been identified within the gene; those with known expression patterns (enhancer traps) or phenotypically characterized, have been mapped (blue triangles). For characterizing the puc genomic region, we have subdivided it into five domains [red boxes—puc Genomic Regions 1 to 5 (PG1 to PG5)]. These domains covered: upstream sequences and the 5′ untranslated domain (PG1); the first and second intron (PG2); the 5′ half of the third intron (PG3); the 3′ half of the third intron (PG4); and the 3′ untranslated domain and downstream sequences (PG5). We further identified four hyper-conserved motifs (Regulatory Sequences—green vertical bars) in puc introns shared in D. mojavensis, D. virilis and D. ananassae, the most divergent species from D. melanogaster sequenced so far. RS1 resides within the PG2 domain and RS2–4 map in the PG3 region.
Figure 2
Figure 2
Expression directed by the Upstream Regulatory Sequences of puc. (A) Expression of a PG1-directed GFP-reporter on a live, late stage 17 embryo. Salivary glands (arrowhead) and conspicuous groups of epithelial cells are labeled. Scale bar 100 µm. (B) Lateral view of a live third-instar larva, showing strong expression of the PG1-directed GFP-reporter in the salivary glands and in segmentally iterated groups of epithelial cells at the locations of the dorsal denticles (arrowhead). Expression is also observed in epithelial cells distributed in scattered ventral spots. Anterior is left. Scale bar 400 µm. (C) Representative image of GFP-immunostained first-instar larva brains, dissected from animals expressing the GFP-reporter under the control of the PG1 Gal4 line. Arrowheads point to PG1-driven expression in neurons of the brain lobes and the thoracic ganglion. The CNS perimeter is marked (red line) and the anterior is up. Scale bar 20 µm.
Figure 3
Figure 3
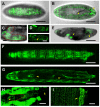
PG2-driven expression in embryonic and larval stages. (A) and (B). Lateral (A) and dorsal (B) views of a live, late-stage 17 embryo, expressing GFP under the control of the PG2 Gal4 line. Expression is detected throughout the epidermis (A), in the tracheal dorsal trunk wall, as well as in the posterior spiracles (arrowheads in (B)). Scale bar 100 µm. (C) Image corresponding to a deeper focal plane of the embryo shown in (A). GFP-expression is observed in the foregut in between the two brain lobes (demarked by a blue line) as well as in the CNS (demarked by a red line). Scale bar 20 µm. (D) Ventrolateral (upper panel) and mediolateral (lower panel) views of the ventral nerve cord portion of the CNS are shown in (C). Activation of the PG2 fragment in the CNS is limited to the perineural/sub-perineural glia and the channel glia (arrowhead). Scale bar 20 µm. (E) Lateral view of a stage 17, maternal-zygotic hep mutant embryo, with a characteristic dorsal open phenotype. Reporter activation by the PG2 fragment remains unaffected in the remnants of the salivary glands, the dorsal tracheal trunk and the posterior spiracles (arrowheads). No expression was observed in the epidermis. Scale bar 100 µm. (F) and (G). Lateral (F) and dorsal (G) views of a live third instar larva, exhibiting strong GFP expression in the epidermis and the dorsal tracheal trunk (F), as well as in the brain and in the midgut (arrowheads in (G)). In the nervous system, puc expression is limited to two rows of cells running along the VNC and to a limited number of glia ensheathing intersegmental nerves (H). Last, it is expressed in the anal pad (I). Scale bar 400 µm. In all cases, anterior is left.
Figure 4
Figure 4
PG2 is expressed in glia. (AC) Flat preparation of embryos, at stage 17, expressing GFP under the control of the PG2 Gal4 line. Dorsal (top) and ventral (bottom) views of three segments of the ventral nerve cord (VNC) are shown. (A) Double staining with an anti-ELAV pan-neural antibody. (B) Double staining with an anti-Repo antibody labeling glial cells. Arrowhead points to cells co-expressing GFP and Repo (Glia). (C) Double staining with an anti-Fasciclin 2 antibody marking the longitudinal connectives, segmental and intersegmental nerves. Arrowhead points to an ensheathing glial cell expressing PG2-directed GFP. Scale bar 10 µm. In all cases anterior is top.
Figure 5
Figure 5
Gene expression modulation by the PG3 domain. (AC) Ventral views, acquired at different focal depths (with dorsal directionality), of a live, stage 17 embryo, expressing GFP under the control of the PG3 Gal4 line. Expression is detected in all body wall muscles (A); in the CNS midline glia (arrowhead in (B)); and in the salivary glands, pharynx, intestinal tract and anal pad (arrowheads in (C)). Scale bar 100 µm. (D) Lateral view of a dorsal-open, stage 17, hep null embryo. The activation of the PG3 regulatory sequence, in the salivary glands and in the remnants of the muscles (arrowheads) is sustained despite the loss-of-function of the JNK-activating kinase Hep. Scale bar 100 µm. (E) and (F). Dorsal superficial and deep views of a live, third instar larva. PG3 exhibits strong activation in all body-wall muscles (E). In a deep focal plane (F), PG3 activity is revealed in the heart tube, as well as in the alary muscles (arrowheads in (F)). Scale bar 400 µm. (G) and (H). Ventral superficial and deep views of a living third instar larva. GFP-expression directed by PG3 is detected in the salivary glands (G) and in the intestinal tract (arrowhead in (H)). Scale bar 400 µm. In all cases, anterior is left.
Figure 6
Figure 6
Complex gene expression modulation by the RS2 motif. (A) Lateral view of a live, stage 17 embryo expressing GFP under the control of the RS2 motif. Expression is detected in a subset of body wall muscles (arrowhead), the CNS and, faintly, in the posterior midgut. Scale bar 100 µm. (B) and (C) high magnification views (B) lateral and (C) ventral of the embryonic CNS (delimited by a red outline) of (A). Arrowheads point to neurons in the optic lobes and perineural and subperineral glia on the VNC. Scale bar 20 µm. (D) Lateral view of a dorsal-open, stage 17, hep null embryo. The activation by the RS2 motif in the remnants of the muscles, the CNS and the midgut is sustained (arrowheads). Scale bar 20 µm. (E) and (F) high magnification views showing the GFP signal (E) or the signal in a brightfield background (F) of the epithelial surface of (D). Arrowheads point to the ectopic expression of the marker in the anterior midgut and the epidermal cells (blue line) at the edge of the open hole consequence of the dorsal closure failure in hep mutants. Scale bar 20 µm. (GI) Dorsal (G), lateral (H) and ventral (I) views of a live third instar larva showing RS2-directed GFP expression in a subset of body-wall muscles, in the heart tube and in the alary muscles (arrowheads). Scale bar 400 µm. (J) High magnification image of the heart tube and the attached alary muscles (arrowhead) expressing RS2-directed GFP. Scale bar 100 µm. (K) 3D-reconstruction of the heart tube and the attached alary muscles (asterisks). Arrowheads point to the hemolymph exit pores along the cardiac tube. Scale bar 100 µm. In all instances, anterior is left.
Figure 7
Figure 7
RS3-driven expression in embryonic and larval stages. (A) Dorsal view of a live, stage 17 embryo, expressing GFP under the control of the RS3 Gal4 line. Strong activation of this motif is observed throughout the epidermis. Scale bar 100 µm. (B) and (C) Details from the embryo shown in (A). RS3 activation is observed in the trachea wall (arrowhead in (B)) and in the posterior spiracles (arrowhead in (C)). Scale bar 20 µm. (D) Lateral view of a dorsal-open, stage 17, hep null embryo. In hep null embryos, activation of the RS3 motif is abolished from the epidermis but not from the trachea. Arrowheads point to remnants of the trachea that sustain RS3-induced GFP expression. Scale bar 100 µm. (E) Dorsal view of a live third-instar larva, showing strong expression of the RS3-directed GFP-reporter in the epidermis, the trachea and the posterior spiracles. Scale bar 400 µm. (F) and (G) High magnification images showing details of RS3 expression in third instar larval tracheal system. Arrows point to the tracheal terminal arborizations at the dorsal midline (F) and at the posterior spiracles (G). Scale bars 20 (F) and 50 µm (G) respectively. Anterior is left.
Figure 8
Figure 8
Gene expression modulation by the PG4 domain. (A) and (B) Dorsal views at different focal planes of a live stage 17 embryo showing strong epidermal GFP expression directed by the PG4 Gal4 line. Expression by this line is also driven in a group of 4–5 cells positioned medially along the embryo’s dorso-ventral axis (arrowhead in (B)). Scale bar 100 µm. (C) and (D). High magnification images from (A). PG4 is activated in the ring gland and anterior midgut (arrowheads in (C)); as well as in the posterior spiracles (arrowhead in (D)). Scale bar 20 µm. (E) Lateral view of a dorsal-open stage 17 hep null embryo, showing PG4 activation in the salivary glands and on a medially positioned group of cells and the remnants of the posterior spiracle (arrowheads). Scale bar 100 µm. (F) Ventral view of a live, third instar larva, exhibiting activation by PG4 sequence in the anal pad (arrowhead) and the epidermis. Scale bar 400 µm. (G) Dorsal view of a third instar larva showing distinct PG4-directed expression predominantly in the midgut and the ring gland (arrowheads) but also in scattered positions along the dorsal trachea trunk and posterior spiracles. Scale bar 400 µm. Inset shows a high magnification of the ring gland expressing GFP as a marker for PG4 activity. DAPI is blue and Phalloidin is red. Scale bar 20 µm. Anterior is left, in all instances.
Figure 9
Figure 9
Gene expression modulation by the PG5 domain. (A) Lateral view of a live stage 17 embryo expressing GFP under the control of the PG5 Gal4 line. Expression is detected in the salivary glands, in cells surrounding the maxilla and in iterated groups of epidermal cells (arrowheads). Scale bar 100 µm. (B) High magnification of the image in A focus on those PG5 positive cells around the embryonic maxilla. Scale bar 20 µm. (C) Lateral view of a live third instar larva showing the persistence of the embryonic PG5 activation pattern. Arrowheads point to the cells surrounding the maxilla and the denticle bearing cells. Scale bar 400 µm. Anterior is left.

Similar articles

Cited by

References

    1. Lemmon M.A., Freed D.M., Schlessinger J., Kiyatkin A. The Dark Side of Cell Signaling: Positive Roles for Negative Regulators. Cell. 2016;164:1172–1184. doi: 10.1016/j.cell.2016.02.047. - DOI - PMC - PubMed
    1. Johnson G.L., Lapadat R. Mitogen-activated protein kinase pathways mediated by ERK, JNK, and p38 protein kinases. Science. 2002;298:1911–1912. doi: 10.1126/science.1072682. - DOI - PubMed
    1. Hibi M., Lin A., Smeal T., Minden A., Karin M. Identification of an oncoprotein- and UV-responsive protein kinase that binds and potentiates the c-Jun activation domain. Genes Dev. 1993;7:2135–2148. doi: 10.1101/gad.7.11.2135. - DOI - PubMed
    1. Lazarus P., Calcagnotto A. Identification and partial characterization of the c-jun oncogene in Xenopus laevis. Cancer Lett. 1994;86:201–208. doi: 10.1016/0304-3835(94)90079-5. - DOI - PubMed
    1. Ip Y.T., Davis R.J. Signal transduction by the c-Jun N-terminal kinase (JNK)—From inflammation to development. Curr. Opin. Cell Biol. 1998;10:205–219. doi: 10.1016/S0955-0674(98)80143-9. - DOI - PubMed

MeSH terms

Substances

LinkOut - more resources